CNe RG IIT KGP Per Com 2019 Avoiding
- Slides: 71
CNe. RG IIT KGP Per. Com 2019 Avoiding Stress Driving: Online Trip Recommendation from Driving Behavior Prediction Authors: Rohit Verma, Bivas Mitra and Sandip Chakraborty Indian Institute of Technology Kharagpur
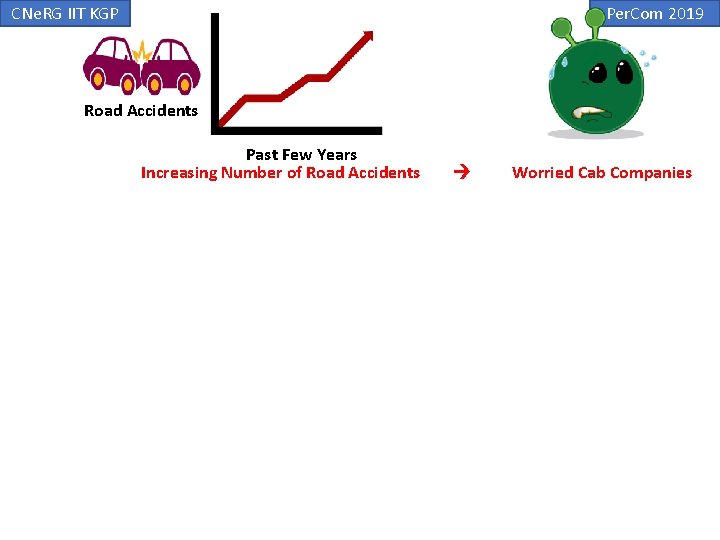
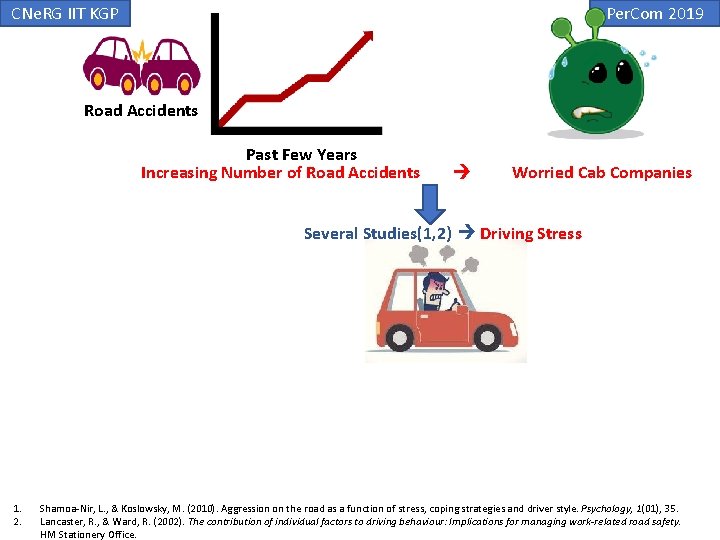
CNe. RG IIT KGP Per. Com 2019 Road Accidents Past Few Years Increasing Number of Road Accidents Worried Cab Companies
CNe. RG IIT KGP Per. Com 2019 Road Accidents Past Few Years Increasing Number of Road Accidents Worried Cab Companies Several Studies(1, 2) Driving Stress 1. 2. Shamoa-Nir, L. , & Koslowsky, M. (2010). Aggression on the road as a function of stress, coping strategies and driver style. Psychology, 1(01), 35. Lancaster, R. , & Ward, R. (2002). The contribution of individual factors to driving behaviour: Implications for managing work-related road safety. HM Stationery Office.
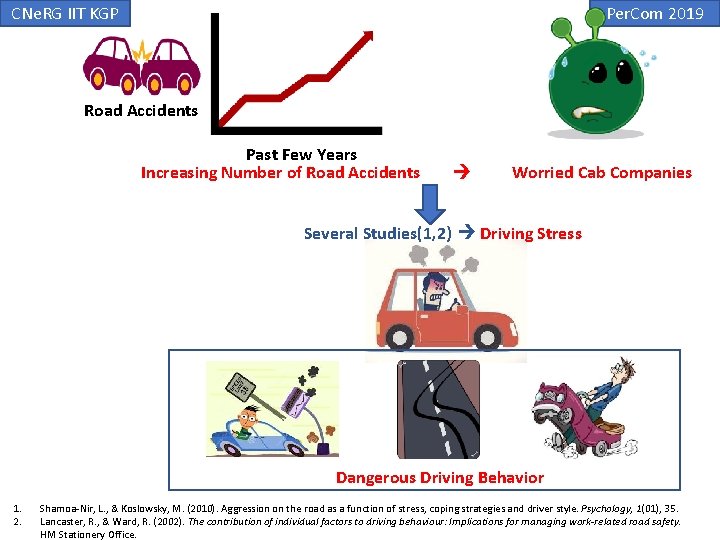
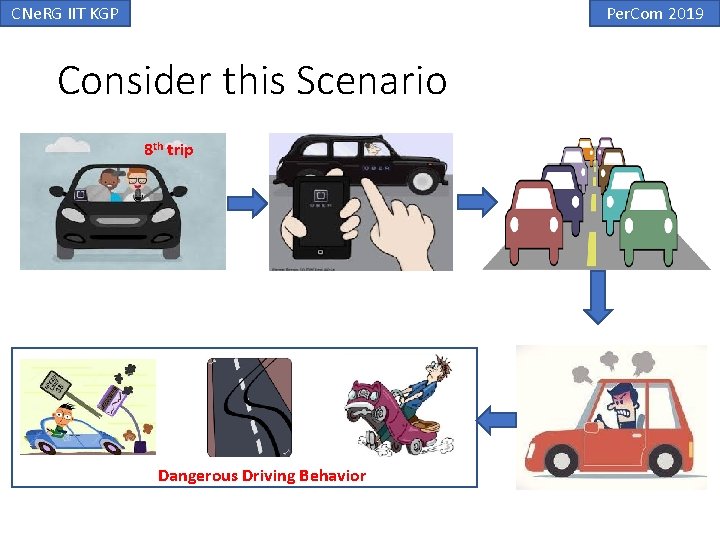
CNe. RG IIT KGP Per. Com 2019 Road Accidents Past Few Years Increasing Number of Road Accidents Worried Cab Companies Several Studies(1, 2) Driving Stress Dangerous Driving Behavior 1. 2. Shamoa-Nir, L. , & Koslowsky, M. (2010). Aggression on the road as a function of stress, coping strategies and driver style. Psychology, 1(01), 35. Lancaster, R. , & Ward, R. (2002). The contribution of individual factors to driving behaviour: Implications for managing work-related road safety. HM Stationery Office.
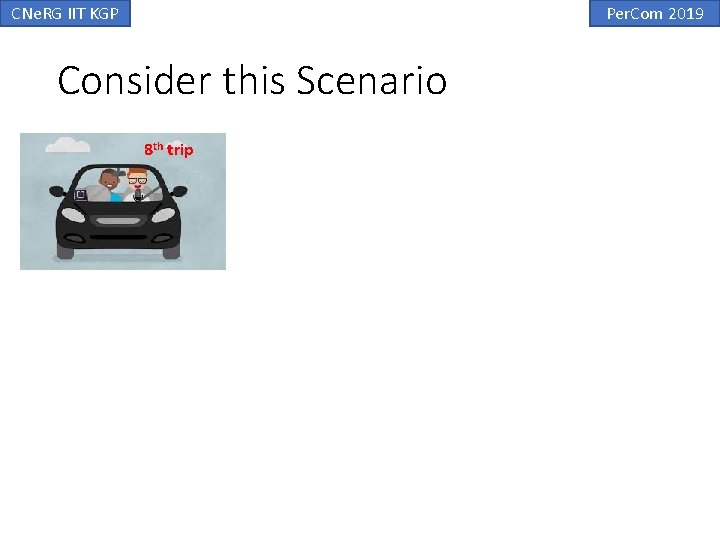
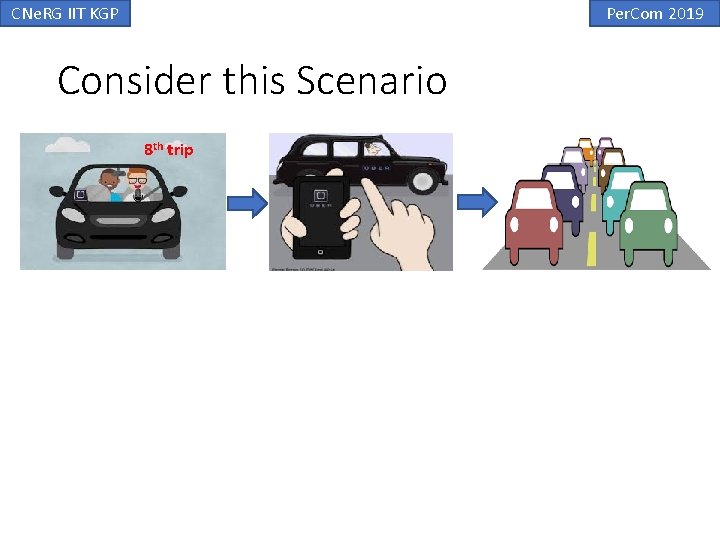
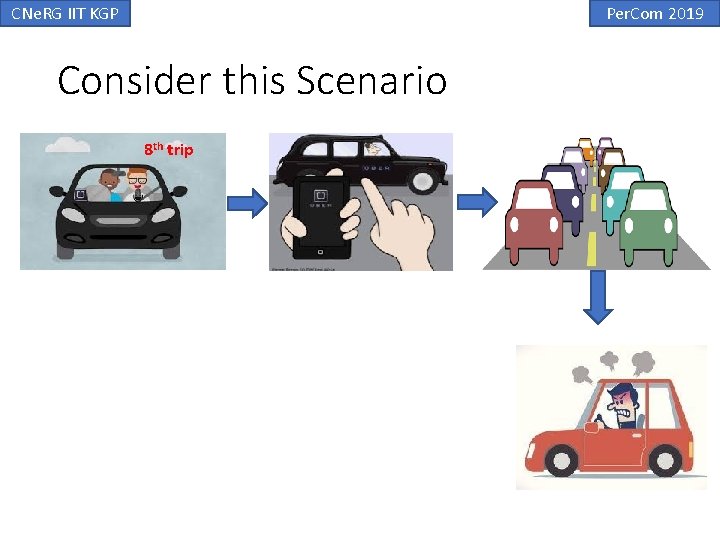
CNe. RG IIT KGP Per. Com 2019 Consider this Scenario 8 th trip
CNe. RG IIT KGP Per. Com 2019 Consider this Scenario 8 th trip
CNe. RG IIT KGP Per. Com 2019 Consider this Scenario 8 th trip
CNe. RG IIT KGP Per. Com 2019 Consider this Scenario 8 th trip
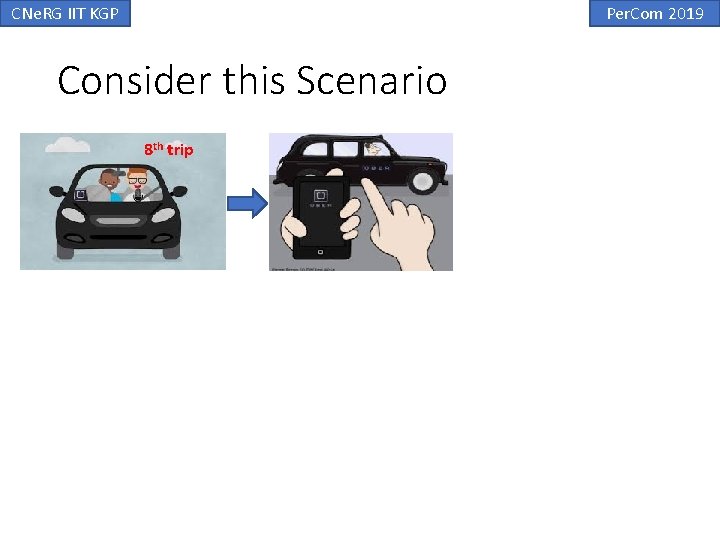
CNe. RG IIT KGP Per. Com 2019 Consider this Scenario 8 th trip Dangerous Driving Behavior
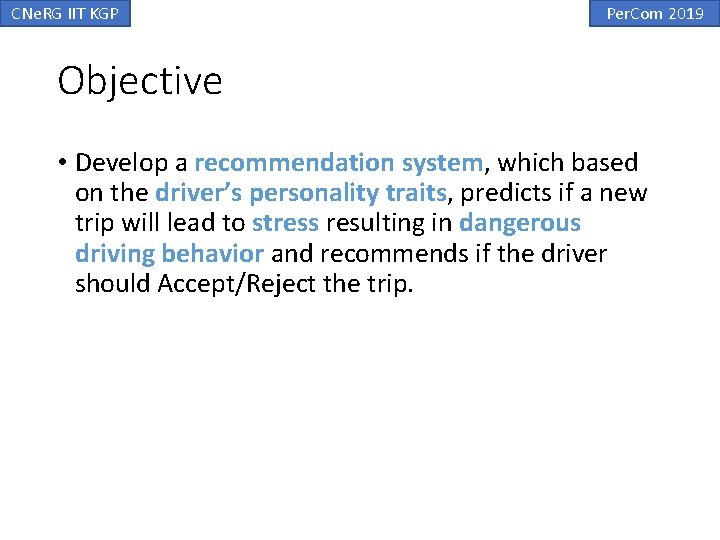
CNe. RG IIT KGP Per. Com 2019 Objective • Develop a recommendation system, which based on the driver’s personality traits, predicts if a new trip will lead to stress resulting in dangerous driving behavior and recommends if the driver should Accept/Reject the trip.
CNe. RG IIT KGP Per. Com 2019 Breaking down the Objective • Stress Model: Develop a model to compute stress taking into account a driver’s personality traits.
CNe. RG IIT KGP Per. Com 2019 Breaking down the Objective • Stress Model: Develop a model to compute stress taking into account a driver’s personality traits. • Driving Behavior Model: Quantify dangerous driving behavior.
CNe. RG IIT KGP Per. Com 2019 Breaking down the Objective • Stress Model: Develop a model to compute stress taking into account a driver’s personality traits. • Driving Behavior Model: Quantify dangerous driving behavior. • Behavior Prediction Model: Develop a model to predict driving behavior from stress
CNe. RG IIT KGP Per. Com 2019 Breaking down the Objective • Stress Model: Develop a model to compute stress taking into account a driver’s personality traits. • Driving Behavior Model: Quantify dangerous driving behavior. • Behavior Prediction Model: Develop a model to predict driving behavior from stress • Recommender: Recommend the driver to Accept or Reject a trip.
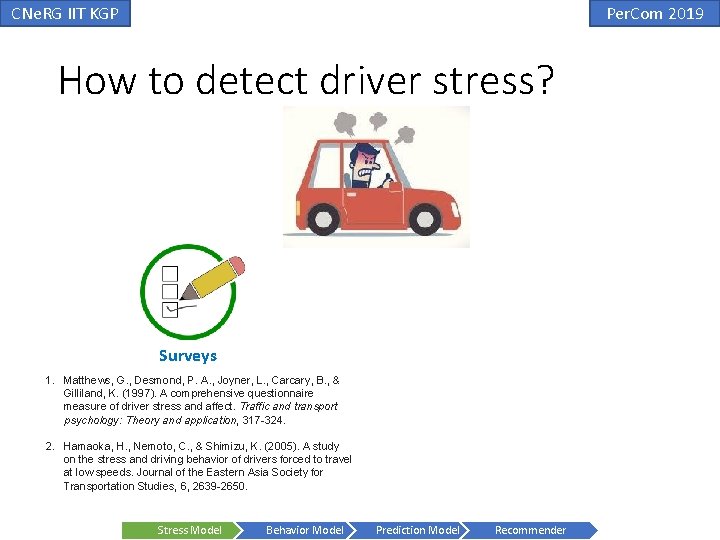
CNe. RG IIT KGP Per. Com 2019 How to detect driver stress? Surveys 1. Matthews, G. , Desmond, P. A. , Joyner, L. , Carcary, B. , & Gilliland, K. (1997). A comprehensive questionnaire measure of driver stress and affect. Traffic and transport psychology: Theory and application, 317 -324. 2. Hamaoka, H. , Nemoto, C. , & Shimizu, K. (2005). A study on the stress and driving behavior of drivers forced to travel at low speeds. Journal of the Eastern Asia Society for Transportation Studies, 6, 2639 -2650. Stress Model Behavior Model Prediction Model Recommender
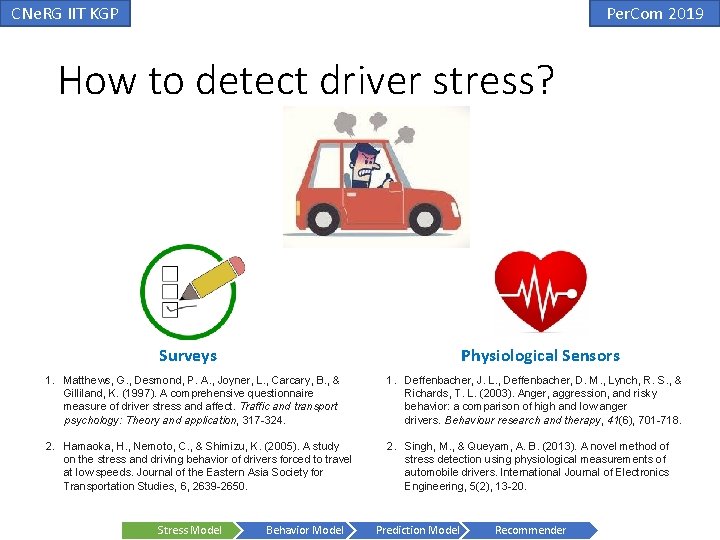
CNe. RG IIT KGP Per. Com 2019 How to detect driver stress? Surveys Physiological Sensors 1. Matthews, G. , Desmond, P. A. , Joyner, L. , Carcary, B. , & Gilliland, K. (1997). A comprehensive questionnaire measure of driver stress and affect. Traffic and transport psychology: Theory and application, 317 -324. 1. Deffenbacher, J. L. , Deffenbacher, D. M. , Lynch, R. S. , & Richards, T. L. (2003). Anger, aggression, and risky behavior: a comparison of high and low anger drivers. Behaviour research and therapy, 41(6), 701 -718. 2. Hamaoka, H. , Nemoto, C. , & Shimizu, K. (2005). A study on the stress and driving behavior of drivers forced to travel at low speeds. Journal of the Eastern Asia Society for Transportation Studies, 6, 2639 -2650. 2. Singh, M. , & Queyam, A. B. (2013). A novel method of stress detection using physiological measurements of automobile drivers. International Journal of Electronics Engineering, 5(2), 13 -20. Stress Model Behavior Model Prediction Model Recommender
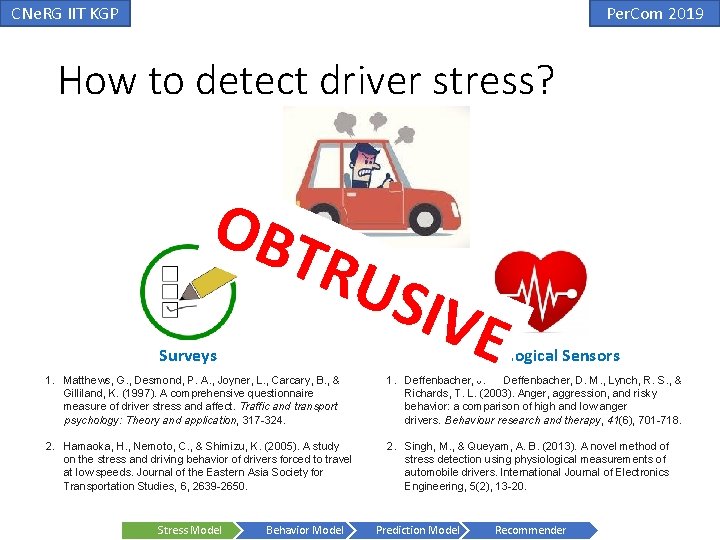
CNe. RG IIT KGP Per. Com 2019 How to detect driver stress? OBT Surveys RUS IVE Physiological Sensors 1. Matthews, G. , Desmond, P. A. , Joyner, L. , Carcary, B. , & Gilliland, K. (1997). A comprehensive questionnaire measure of driver stress and affect. Traffic and transport psychology: Theory and application, 317 -324. 1. Deffenbacher, J. L. , Deffenbacher, D. M. , Lynch, R. S. , & Richards, T. L. (2003). Anger, aggression, and risky behavior: a comparison of high and low anger drivers. Behaviour research and therapy, 41(6), 701 -718. 2. Hamaoka, H. , Nemoto, C. , & Shimizu, K. (2005). A study on the stress and driving behavior of drivers forced to travel at low speeds. Journal of the Eastern Asia Society for Transportation Studies, 6, 2639 -2650. 2. Singh, M. , & Queyam, A. B. (2013). A novel method of stress detection using physiological measurements of automobile drivers. International Journal of Electronics Engineering, 5(2), 13 -20. Stress Model Behavior Model Prediction Model Recommender
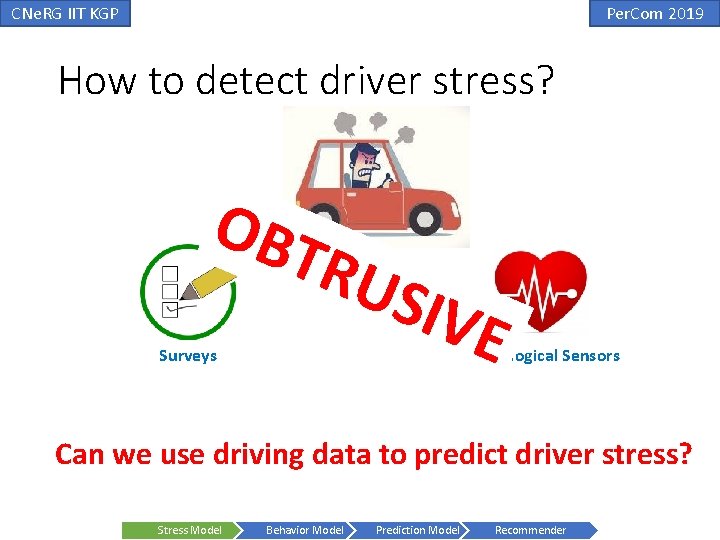
CNe. RG IIT KGP Per. Com 2019 How to detect driver stress? OBT Surveys RUS IVE Physiological Sensors Can we use driving data to predict driver stress? Stress Model Behavior Model Prediction Model Recommender
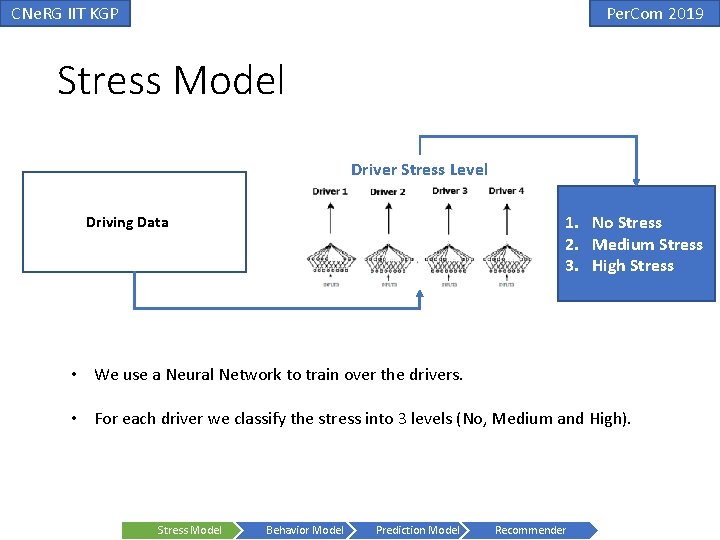
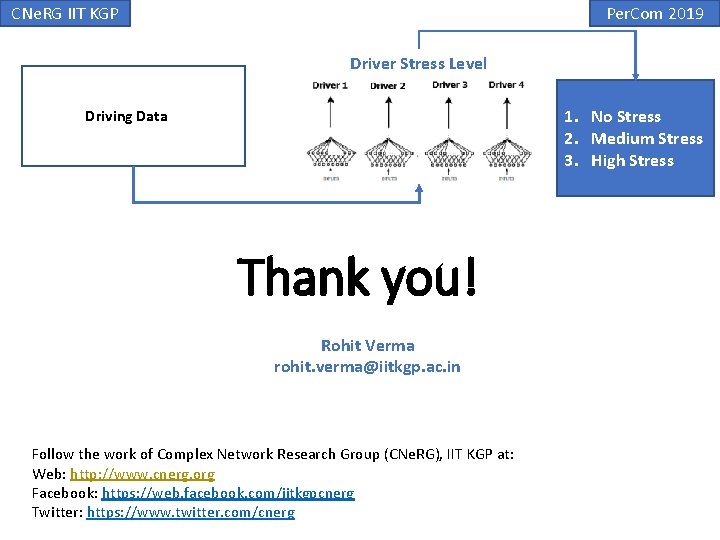
CNe. RG IIT KGP Per. Com 2019 Stress Model Driver Stress Level 1. No Stress 2. Medium Stress 3. High Stress Driving Data • We use a Neural Network to train over the drivers. • For each driver we classify the stress into 3 levels (No, Medium and High). Stress Model Behavior Model Prediction Model Recommender
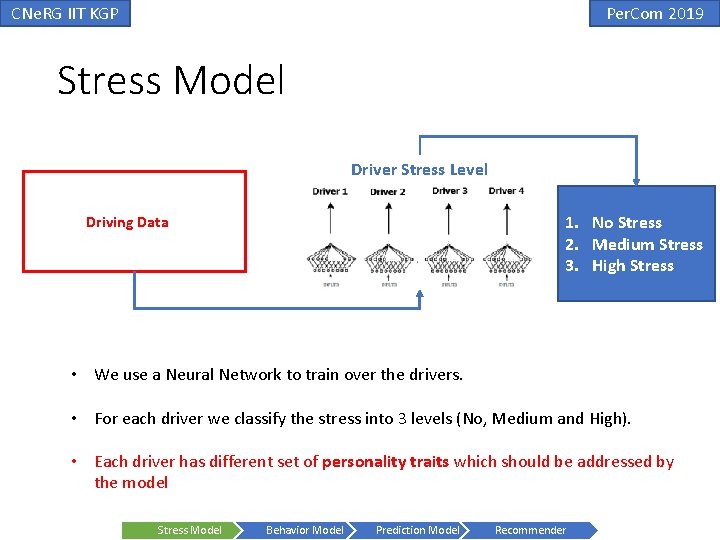
CNe. RG IIT KGP Per. Com 2019 Stress Model Driver Stress Level 1. No Stress 2. Medium Stress 3. High Stress Driving Data • We use a Neural Network to train over the drivers. • For each driver we classify the stress into 3 levels (No, Medium and High). • Each driver has different set of personality traits which should be addressed by the model Stress Model Behavior Model Prediction Model Recommender
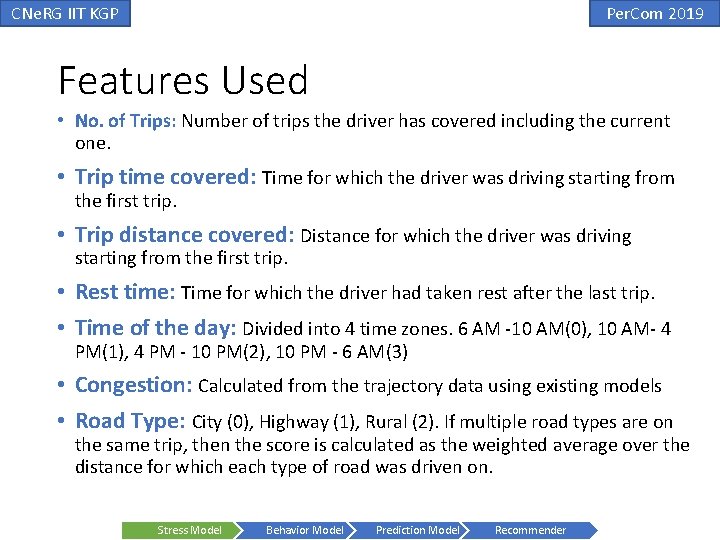
CNe. RG IIT KGP Per. Com 2019 Features Used • No. of Trips: Number of trips the driver has covered including the current one. Stress Model Behavior Model Prediction Model Recommender
CNe. RG IIT KGP Per. Com 2019 Features Used • No. of Trips: Number of trips the driver has covered including the current one. • Trip time covered: Time for which the driver was driving starting from the first trip. Stress Model Behavior Model Prediction Model Recommender
CNe. RG IIT KGP Per. Com 2019 Features Used • No. of Trips: Number of trips the driver has covered including the current one. • Trip time covered: Time for which the driver was driving starting from the first trip. • Trip distance covered: Distance for which the driver was driving starting from the first trip. Stress Model Behavior Model Prediction Model Recommender
CNe. RG IIT KGP Per. Com 2019 Features Used • No. of Trips: Number of trips the driver has covered including the current one. • Trip time covered: Time for which the driver was driving starting from the first trip. • Trip distance covered: Distance for which the driver was driving starting from the first trip. • Rest time: Time for which the driver had taken rest after the last trip. Stress Model Behavior Model Prediction Model Recommender
CNe. RG IIT KGP Per. Com 2019 Features Used • No. of Trips: Number of trips the driver has covered including the current one. • Trip time covered: Time for which the driver was driving starting from the first trip. • Trip distance covered: Distance for which the driver was driving starting from the first trip. • Rest time: Time for which the driver had taken rest after the last trip. • Time of the day: Divided into 4 time zones. 6 AM -10 AM(0), 10 AM- 4 PM(1), 4 PM - 10 PM(2), 10 PM - 6 AM(3) Stress Model Behavior Model Prediction Model Recommender
CNe. RG IIT KGP Per. Com 2019 Features Used • No. of Trips: Number of trips the driver has covered including the current one. • Trip time covered: Time for which the driver was driving starting from the first trip. • Trip distance covered: Distance for which the driver was driving starting from the first trip. • Rest time: Time for which the driver had taken rest after the last trip. • Time of the day: Divided into 4 time zones. 6 AM -10 AM(0), 10 AM- 4 PM(1), 4 PM - 10 PM(2), 10 PM - 6 AM(3) • Congestion: Calculated from the trajectory data using existing models Stress Model Behavior Model Prediction Model Recommender
CNe. RG IIT KGP Per. Com 2019 Features Used • No. of Trips: Number of trips the driver has covered including the current one. • Trip time covered: Time for which the driver was driving starting from the first trip. • Trip distance covered: Distance for which the driver was driving starting from the first trip. • Rest time: Time for which the driver had taken rest after the last trip. • Time of the day: Divided into 4 time zones. 6 AM -10 AM(0), 10 AM- 4 PM(1), 4 PM - 10 PM(2), 10 PM - 6 AM(3) • Congestion: Calculated from the trajectory data using existing models • Road Type: City (0), Highway (1), Rural (2). If multiple road types are on the same trip, then the score is calculated as the weighted average over the distance for which each type of road was driven on. Stress Model Behavior Model Prediction Model Recommender
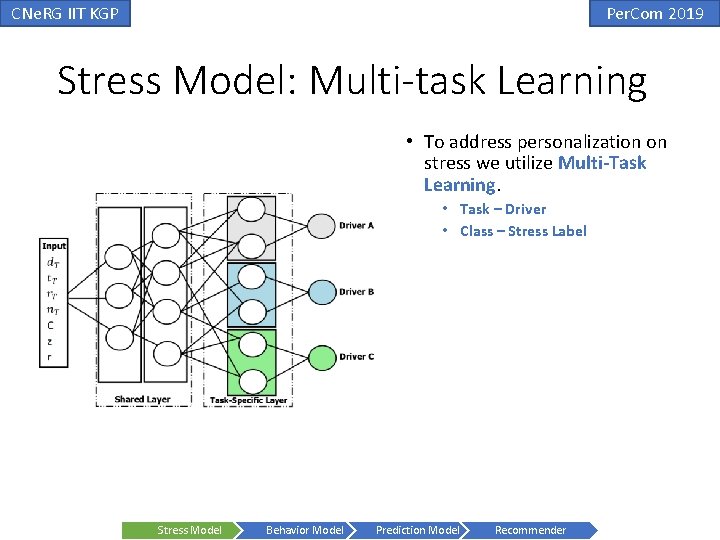
CNe. RG IIT KGP Per. Com 2019 Stress Model: Multi-task Learning • To address personalization on stress we utilize Multi-Task Learning. • Task – Driver • Class – Stress Label Stress Model Behavior Model Prediction Model Recommender
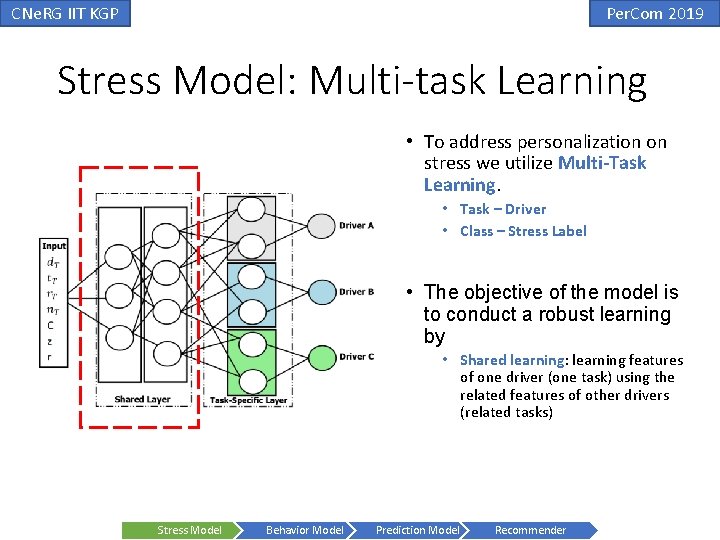
CNe. RG IIT KGP Per. Com 2019 Stress Model: Multi-task Learning • To address personalization on stress we utilize Multi-Task Learning. • Task – Driver • Class – Stress Label • The objective of the model is to conduct a robust learning by • Shared learning: learning features of one driver (one task) using the related features of other drivers (related tasks) Stress Model Behavior Model Prediction Model Recommender
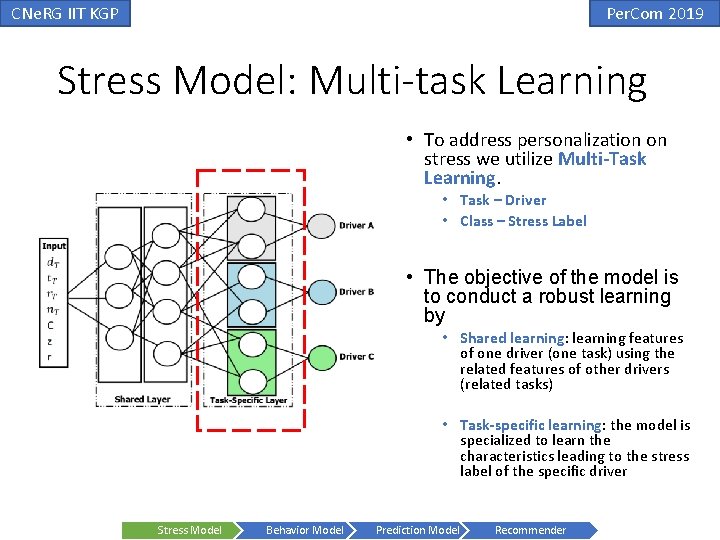
CNe. RG IIT KGP Per. Com 2019 Stress Model: Multi-task Learning • To address personalization on stress we utilize Multi-Task Learning. • Task – Driver • Class – Stress Label • The objective of the model is to conduct a robust learning by • Shared learning: learning features of one driver (one task) using the related features of other drivers (related tasks) • Task-specific learning: the model is specialized to learn the characteristics leading to the stress label of the specific driver Stress Model Behavior Model Prediction Model Recommender
CNe. RG IIT KGP Per. Com 2019 Training and Evaluation • Dataset Used: HCILab Dataset[1] • Drivers: 10 (3 female and 7 male) • Sensors: IMU sensors, GPS, ECG, SCR, Temperature, Heart Rate(HR) and HR Variability 1. Schneegass, S. , Pfleging, B. , Broy, N. , Heinrich, F. , & Schmidt, A. (2013, October). A data set of real world driving to assess driver workload. In Proceedings of the 5 th international conference on automotive user interfaces and interactive vehicular applications (pp. 150 -157). ACM. 2. Keshan, N. , Parimi, P. V. , & Bichindaritz, I. (2015, October). Machine learning for stress detection from ECG signals in automobile drivers. In 2015 IEEE International Conference on Big Data (Big Data) (pp. 2661 -2669). IEEE. Stress Model Behavior Model Prediction Model Recommender
CNe. RG IIT KGP Per. Com 2019 Training and Evaluation • Dataset Used: HCILab Dataset[1] • Drivers: 10 (3 female and 7 male) • Sensors: IMU sensors, GPS, ECG, SCR, Temperature, Heart Rate(HR) and HR Variability • Ground Truth Generation: • We use the technique given by Keshan et. al. [Big. Data 2015] to compute stress from the physiological sensor data. 1. Schneegass, S. , Pfleging, B. , Broy, N. , Heinrich, F. , & Schmidt, A. (2013, October). A data set of real world driving to assess driver workload. In Proceedings of the 5 th international conference on automotive user interfaces and interactive vehicular applications (pp. 150 -157). ACM. 2. Keshan, N. , Parimi, P. V. , & Bichindaritz, I. (2015, October). Machine learning for stress detection from ECG signals in automobile drivers. In 2015 IEEE International Conference on Big Data (Big Data) (pp. 2661 -2669). IEEE. Stress Model Behavior Model Prediction Model Recommender
CNe. RG IIT KGP Per. Com 2019 Training and Evaluation • Dataset Used: HCILab Dataset[1] • Drivers: 10 (3 female and 7 male) • Sensors: IMU sensors, GPS, ECG, SCR, Temperature, Heart Rate(HR) and HR Variability • Ground Truth Generation: • We use the technique given by Keshan et. al. [Big. Data 2015] to compute stress from the physiological sensor data. • Evaluation: • We divide the data into 60 -20 -20% for training, validation and testing • We also implement a Single Task Learning model to train each driver in isolation 1. Schneegass, S. , Pfleging, B. , Broy, N. , Heinrich, F. , & Schmidt, A. (2013, October). A data set of real world driving to assess driver workload. In Proceedings of the 5 th international conference on automotive user interfaces and interactive vehicular applications (pp. 150 -157). ACM. 2. Keshan, N. , Parimi, P. V. , & Bichindaritz, I. (2015, October). Machine learning for stress detection from ECG signals in automobile drivers. In 2015 IEEE International Conference on Big Data (Big Data) (pp. 2661 -2669). IEEE. Stress Model Behavior Model Prediction Model Recommender
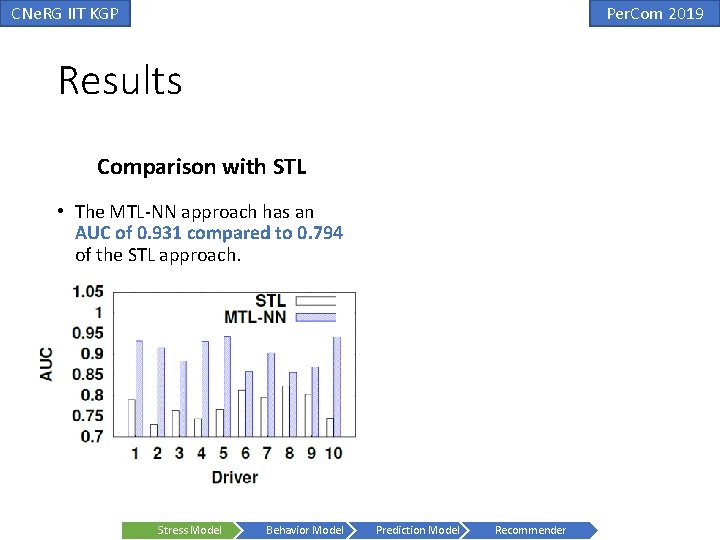
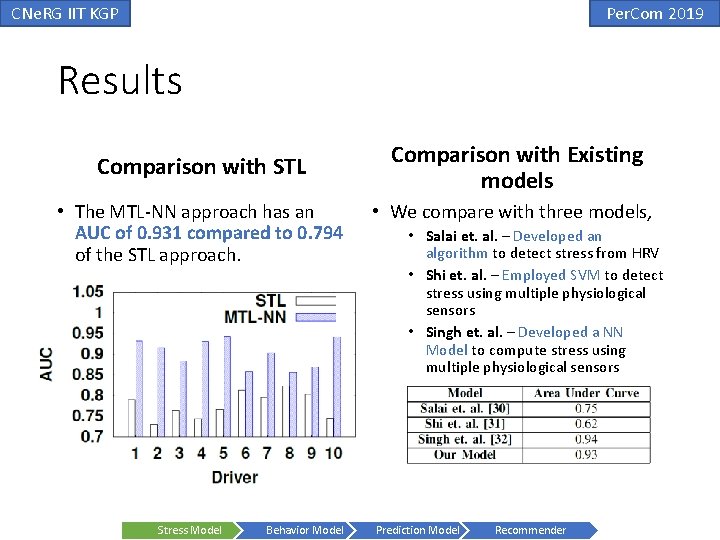
CNe. RG IIT KGP Per. Com 2019 Results Comparison with STL • The MTL-NN approach has an AUC of 0. 931 compared to 0. 794 of the STL approach. Stress Model Behavior Model Prediction Model Recommender
CNe. RG IIT KGP Per. Com 2019 Results Comparison with STL • The MTL-NN approach has an AUC of 0. 931 compared to 0. 794 of the STL approach. Stress Model Behavior Model Comparison with Existing models • We compare with three models, • Salai et. al. – Developed an algorithm to detect stress from HRV • Shi et. al. – Employed SVM to detect stress using multiple physiological sensors • Singh et. al. – Developed a NN Model to compute stress using multiple physiological sensors Prediction Model Recommender
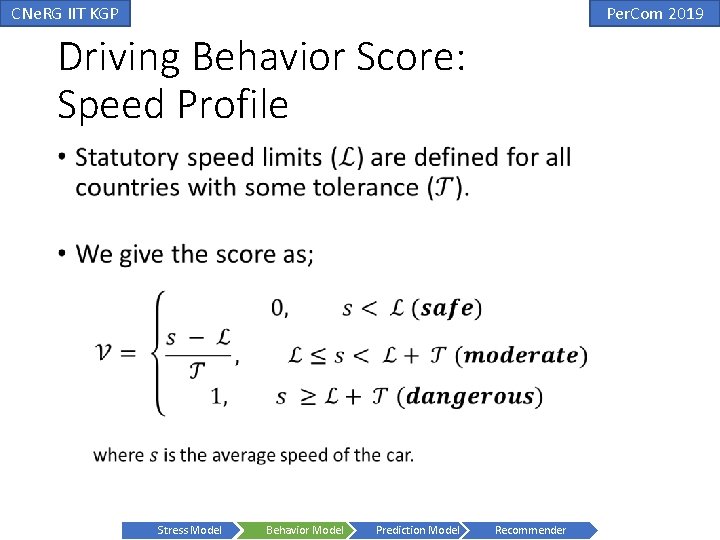
CNe. RG IIT KGP Per. Com 2019 Driving Behavior Score: Speed Profile • Stress Model Behavior Model Prediction Model Recommender
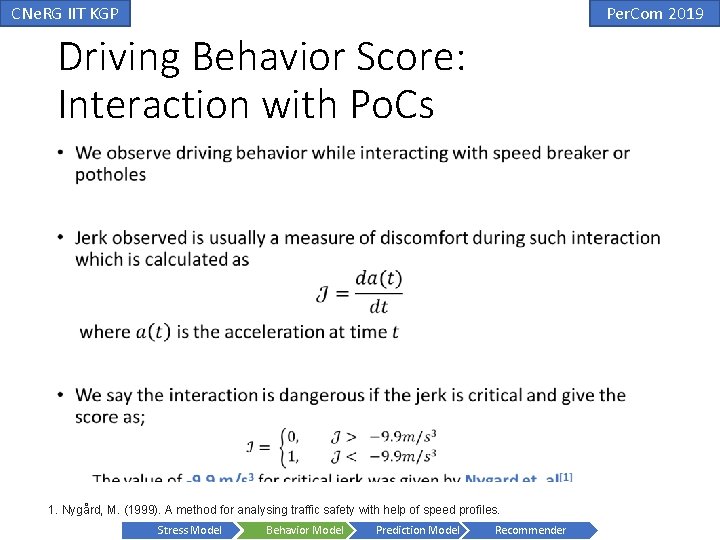
CNe. RG IIT KGP Per. Com 2019 Driving Behavior Score: Interaction with Po. Cs • We observe driving behavior while interacting with speed breaker or potholes Stress Model Behavior Model Prediction Model Recommender
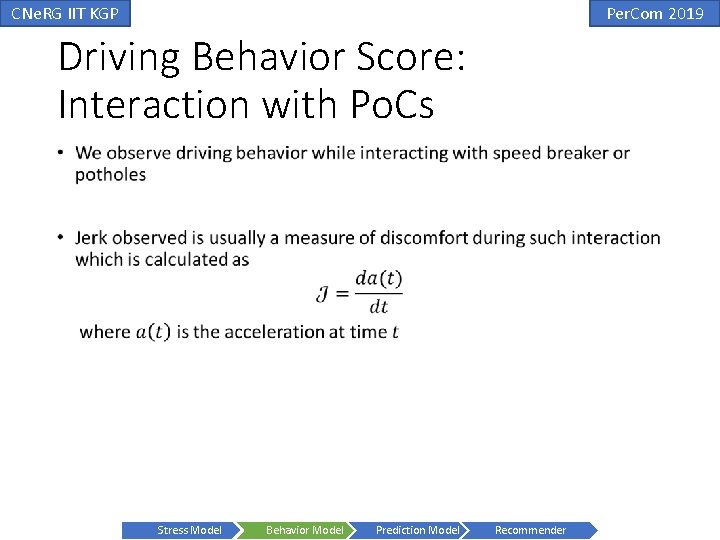
CNe. RG IIT KGP Per. Com 2019 Driving Behavior Score: Interaction with Po. Cs • Stress Model Behavior Model Prediction Model Recommender
CNe. RG IIT KGP Per. Com 2019 Driving Behavior Score: Interaction with Po. Cs • 1. Nygård, M. (1999). A method for analysing traffic safety with help of speed profiles. Stress Model Behavior Model Prediction Model Recommender
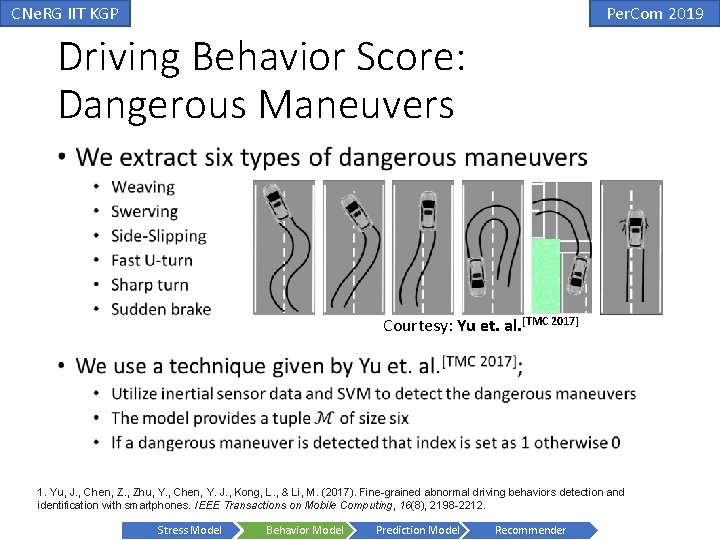
CNe. RG IIT KGP Per. Com 2019 Driving Behavior Score: Dangerous Maneuvers • Courtesy: Yu et. al. [TMC 2017] 1. Yu, J. , Chen, Z. , Zhu, Y. , Chen, Y. J. , Kong, L. , & Li, M. (2017). Fine-grained abnormal driving behaviors detection and identification with smartphones. IEEE Transactions on Mobile Computing, 16(8), 2198 -2212. Stress Model Behavior Model Prediction Model Recommender
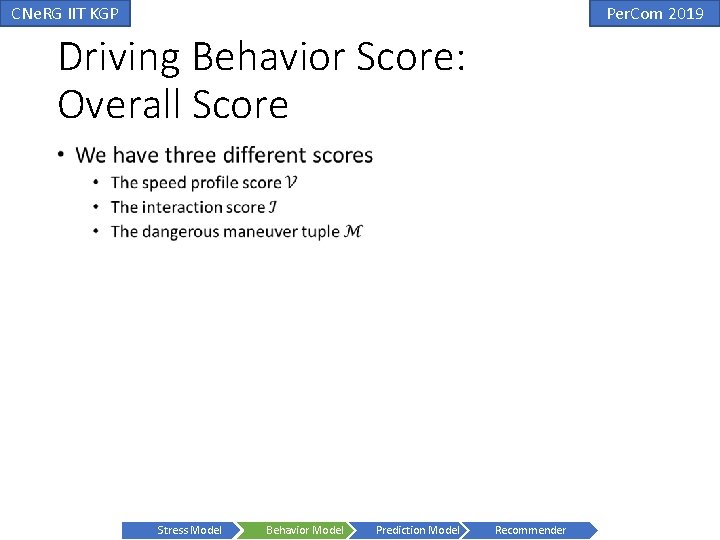
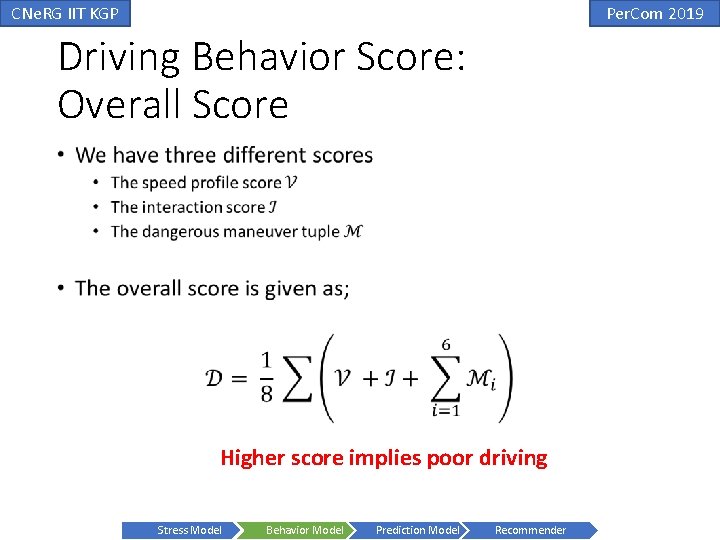
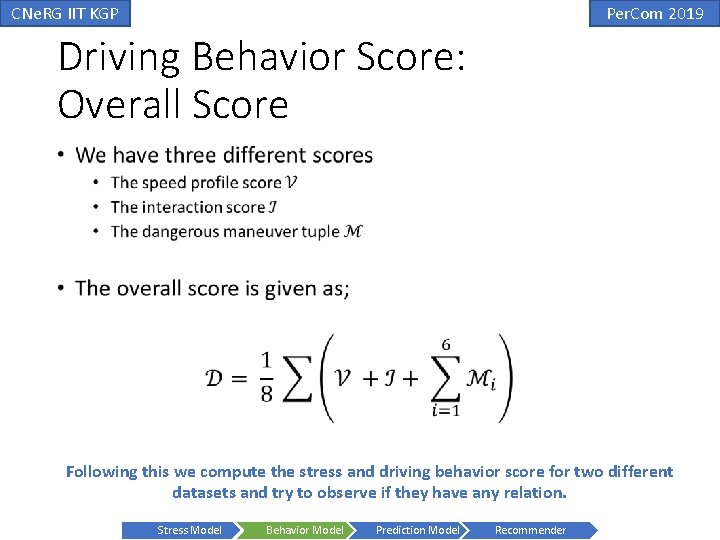
CNe. RG IIT KGP Per. Com 2019 Driving Behavior Score: Overall Score • Stress Model Behavior Model Prediction Model Recommender
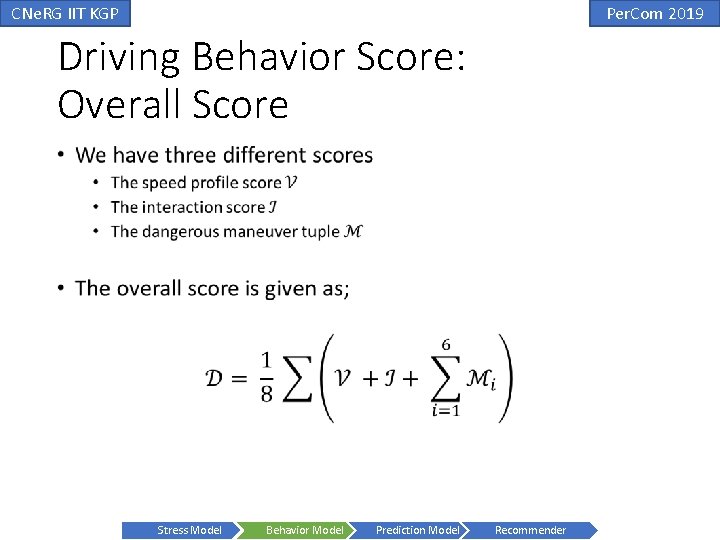
CNe. RG IIT KGP Per. Com 2019 Driving Behavior Score: Overall Score • Stress Model Behavior Model Prediction Model Recommender
CNe. RG IIT KGP Per. Com 2019 Driving Behavior Score: Overall Score • Higher score implies poor driving Stress Model Behavior Model Prediction Model Recommender
CNe. RG IIT KGP Per. Com 2019 Driving Behavior Score: Overall Score • Following this we compute the stress and driving behavior score for two different datasets and try to observe if they have any relation. Stress Model Behavior Model Prediction Model Recommender
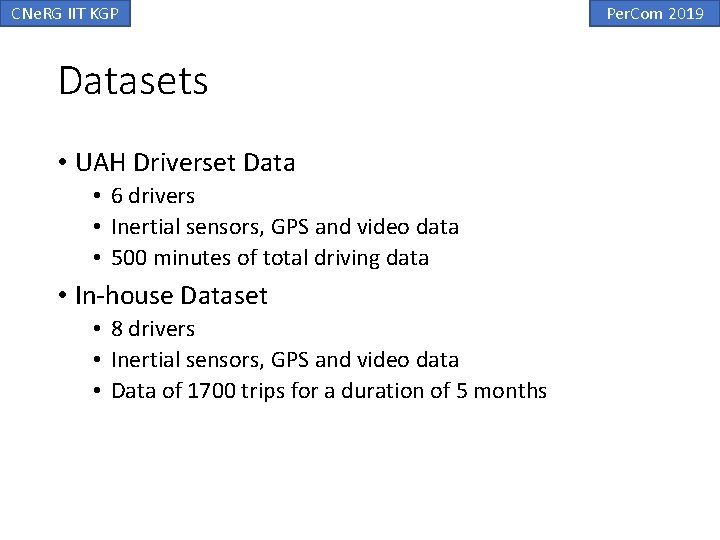
CNe. RG IIT KGP Datasets • UAH Driverset Data • 6 drivers • Inertial sensors, GPS and video data • 500 minutes of total driving data • In-house Dataset • 8 drivers • Inertial sensors, GPS and video data • Data of 1700 trips for a duration of 5 months Per. Com 2019
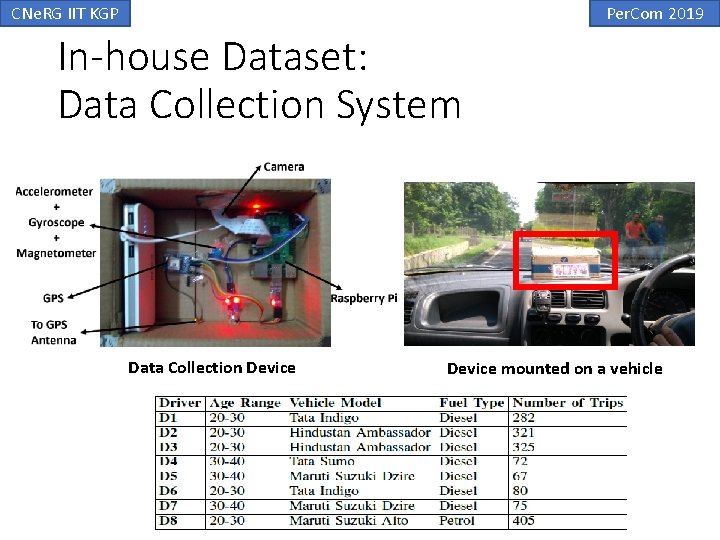
CNe. RG IIT KGP Per. Com 2019 In-house Dataset: Data Collection System Data Collection Device mounted on a vehicle
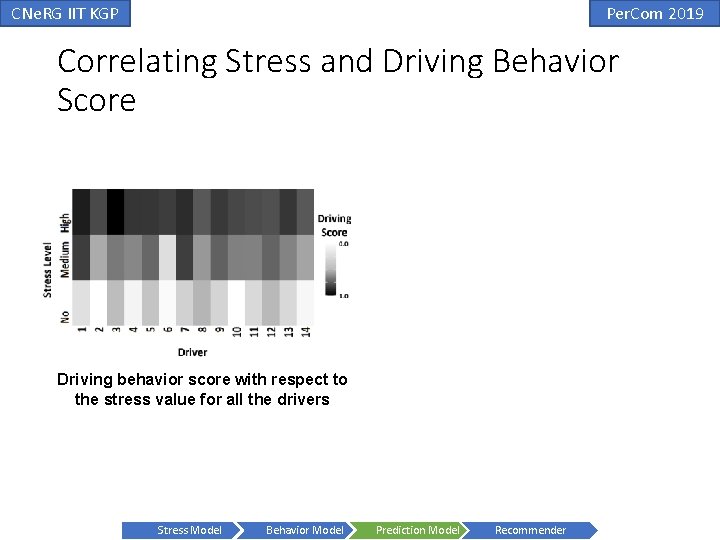
CNe. RG IIT KGP Per. Com 2019 Correlating Stress and Driving Behavior Score Driving behavior score with respect to the stress value for all the drivers Stress Model Behavior Model Prediction Model Recommender
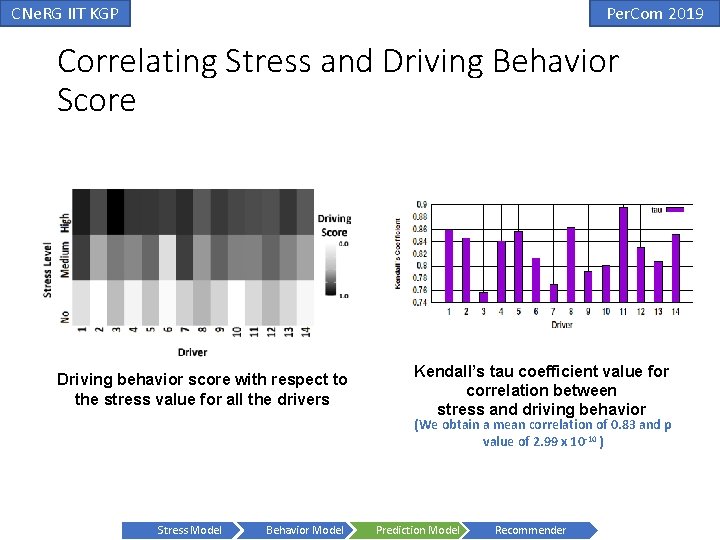
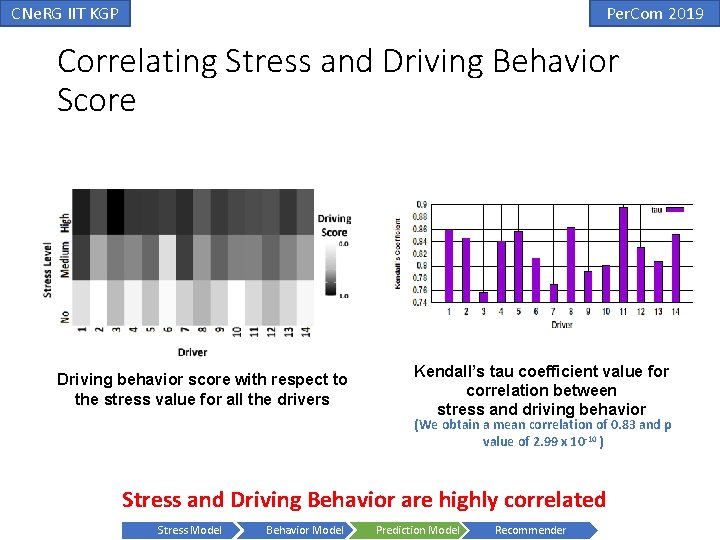
CNe. RG IIT KGP Per. Com 2019 Correlating Stress and Driving Behavior Score Driving behavior score with respect to the stress value for all the drivers Kendall’s tau coefficient value for correlation between stress and driving behavior (We obtain a mean correlation of 0. 83 and p value of 2. 99 x 10 -10 ) Stress Model Behavior Model Prediction Model Recommender
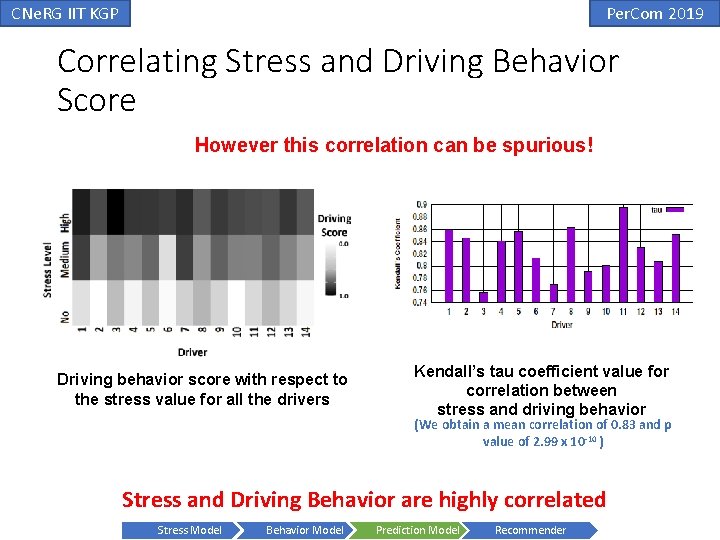
CNe. RG IIT KGP Per. Com 2019 Correlating Stress and Driving Behavior Score Driving behavior score with respect to the stress value for all the drivers Kendall’s tau coefficient value for correlation between stress and driving behavior (We obtain a mean correlation of 0. 83 and p value of 2. 99 x 10 -10 ) Stress and Driving Behavior are highly correlated Stress Model Behavior Model Prediction Model Recommender
CNe. RG IIT KGP Per. Com 2019 Correlating Stress and Driving Behavior Score However this correlation can be spurious! Driving behavior score with respect to the stress value for all the drivers Kendall’s tau coefficient value for correlation between stress and driving behavior (We obtain a mean correlation of 0. 83 and p value of 2. 99 x 10 -10 ) Stress and Driving Behavior are highly correlated Stress Model Behavior Model Prediction Model Recommender
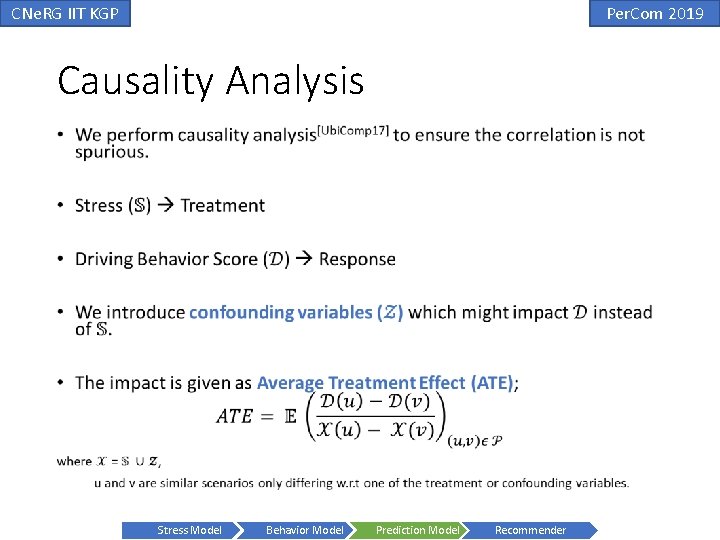
CNe. RG IIT KGP Per. Com 2019 Causality Analysis • Stress Model Behavior Model Prediction Model Recommender
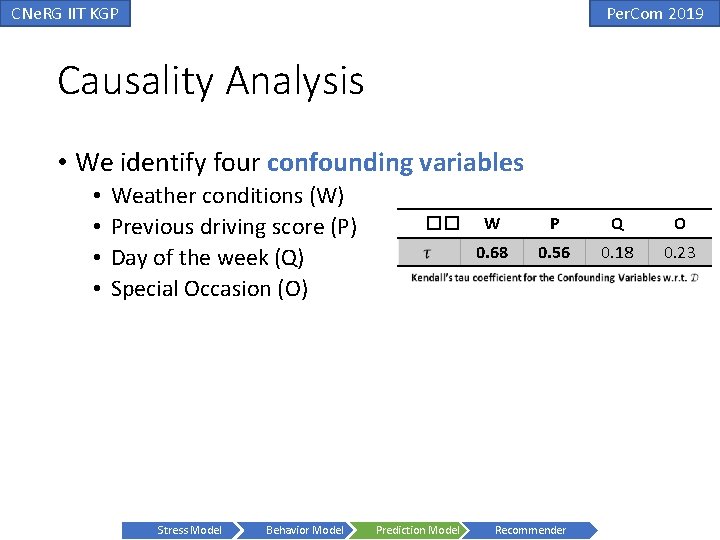
CNe. RG IIT KGP Per. Com 2019 Causality Analysis • We identify four confounding variables • • Weather conditions (W) Previous driving score (P) Day of the week (Q) Special Occasion (O) Stress Model Behavior Model �� W P Q O 0. 68 0. 56 0. 18 0. 23 Prediction Model Recommender
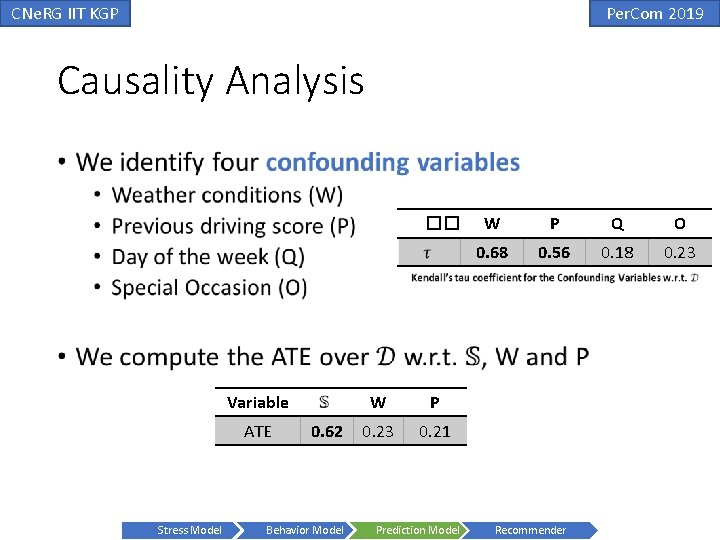
CNe. RG IIT KGP Per. Com 2019 Causality Analysis • �� W P Q O 0. 68 0. 56 0. 18 0. 23 Variable ATE Stress Model 0. 62 Behavior Model W P 0. 23 0. 21 Prediction Model Recommender
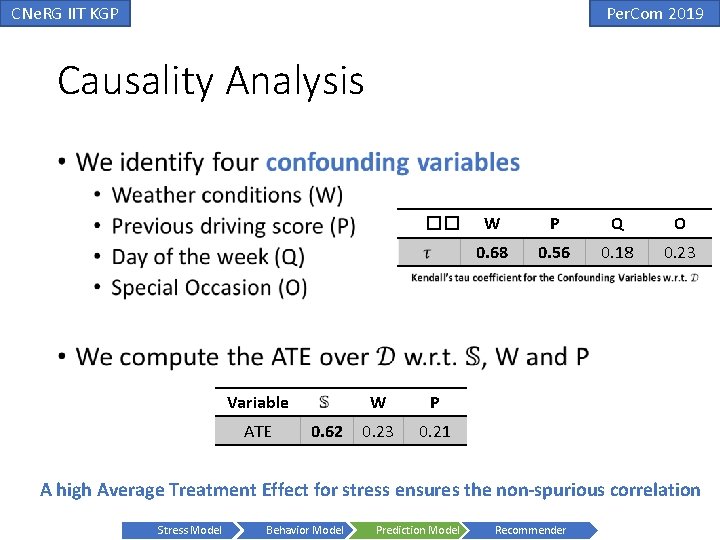
CNe. RG IIT KGP Per. Com 2019 Causality Analysis • �� W P Q O 0. 68 0. 56 0. 18 0. 23 Variable ATE 0. 62 W P 0. 23 0. 21 A high Average Treatment Effect for stress ensures the non-spurious correlation Stress Model Behavior Model Prediction Model Recommender
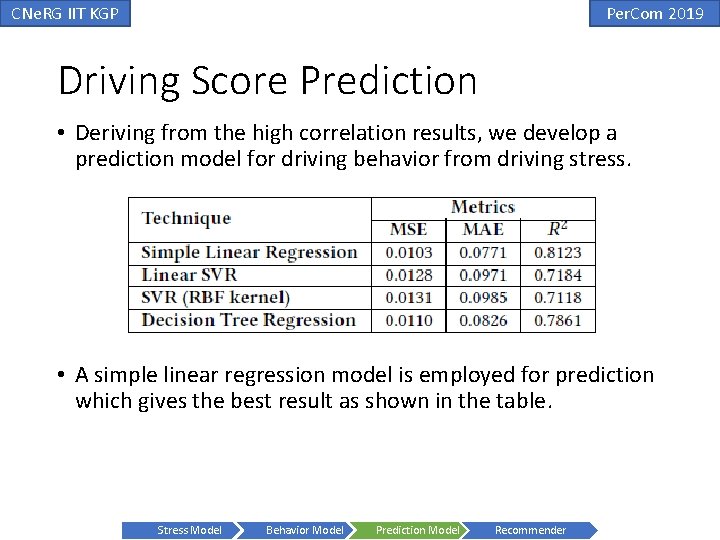
CNe. RG IIT KGP Per. Com 2019 Driving Score Prediction • Deriving from the high correlation results, we develop a prediction model for driving behavior from driving stress. • A simple linear regression model is employed for prediction which gives the best result as shown in the table. Stress Model Behavior Model Prediction Model Recommender
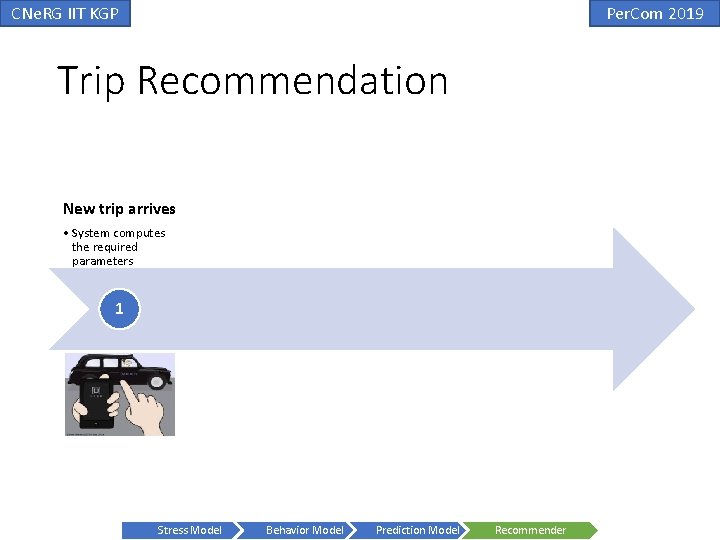
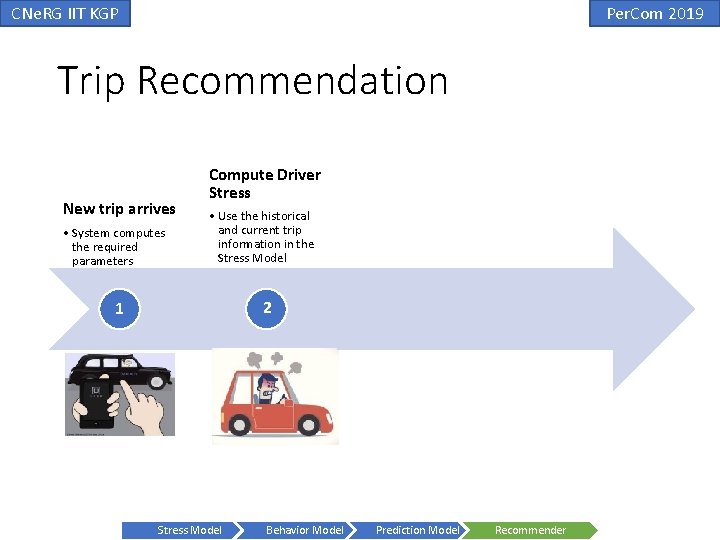
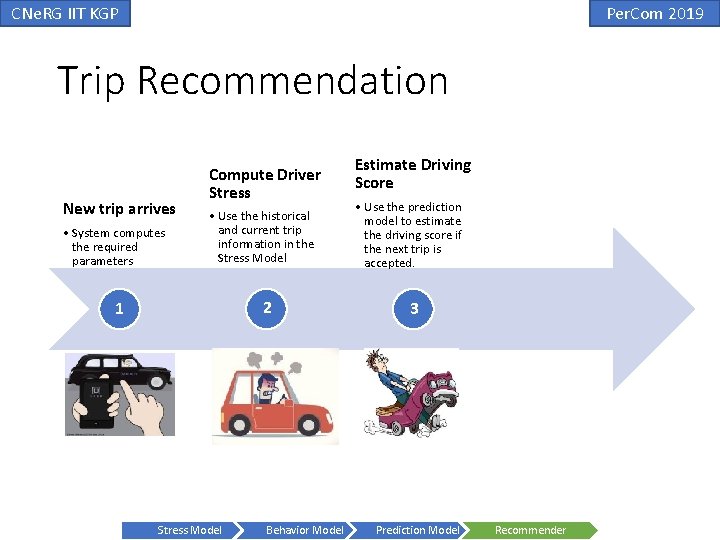
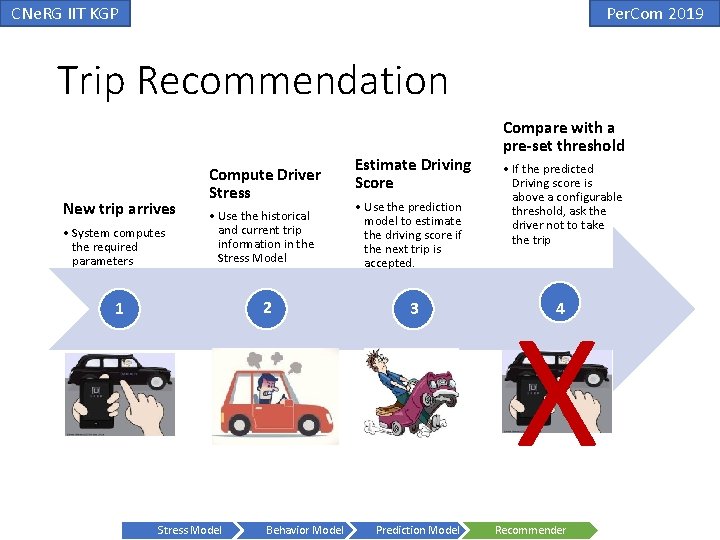
CNe. RG IIT KGP Per. Com 2019 Trip Recommendation New trip arrives • System computes the required parameters Compute Driver Stress Estimate Driving Score • Use the historical and current trip information in the Stress Model • Use the prediction model to estimate the driving score if the next trip is accepted. 2 3 1 Stress Model Behavior Model Prediction Model Compare with a pre-set threshold • If the predicted Driving score is above a configurable threshold, ask the driver not to take the trip X 4 Recommender
CNe. RG IIT KGP Per. Com 2019 Trip Recommendation New trip arrives • System computes the required parameters Compute Driver Stress • Use the historical and current trip information in the Stress Model 2 1 Stress Model Behavior Model Estimate Driving Score • Use the prediction model to estimate the driving score if the next trip is accepted. 3 Prediction Model Compare with a pre-set threshold • If the predicted Driving score is above a configurable threshold, ask the driver not to take the trip X 4 Recommender
CNe. RG IIT KGP Per. Com 2019 Trip Recommendation New trip arrives • System computes the required parameters Compute Driver Stress • Use the historical and current trip information in the Stress Model 2 1 Stress Model Behavior Model Estimate Driving Score • Use the prediction model to estimate the driving score if the next trip is accepted. 3 Prediction Model Compare with a pre-set threshold • If the predicted Driving score is above a configurable threshold, ask the driver not to take the trip X 4 Recommender
CNe. RG IIT KGP Per. Com 2019 Trip Recommendation New trip arrives • System computes the required parameters Compute Driver Stress • Use the historical and current trip information in the Stress Model 2 1 Stress Model Behavior Model Estimate Driving Score • Use the prediction model to estimate the driving score if the next trip is accepted. 3 Prediction Model Compare with a pre-set threshold • If the predicted Driving score is above a configurable threshold, ask the driver not to take the trip X 4 Recommender
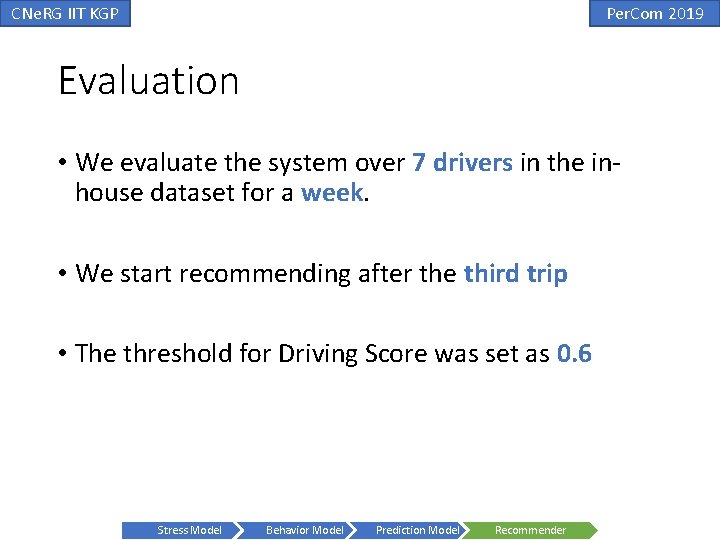
CNe. RG IIT KGP Per. Com 2019 Evaluation • We evaluate the system over 7 drivers in the inhouse dataset for a week. • We start recommending after the third trip • The threshold for Driving Score was set as 0. 6 Stress Model Behavior Model Prediction Model Recommender
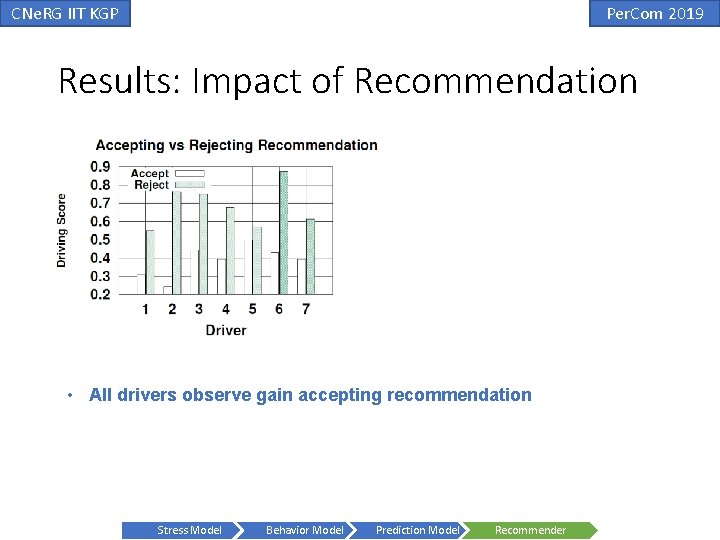
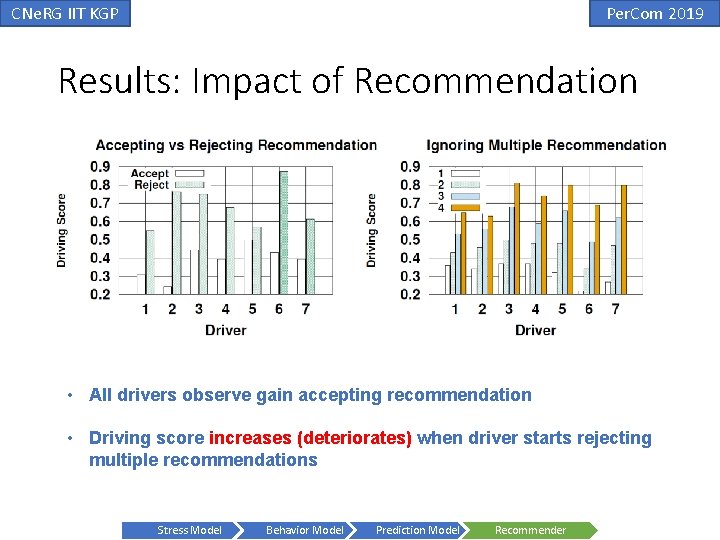
CNe. RG IIT KGP Per. Com 2019 Results: Impact of Recommendation • All drivers observe gain accepting recommendation Stress Model Behavior Model Prediction Model Recommender
CNe. RG IIT KGP Per. Com 2019 Results: Impact of Recommendation • All drivers observe gain accepting recommendation • Driving score increases (deteriorates) when driver starts rejecting multiple recommendations Stress Model Behavior Model Prediction Model Recommender
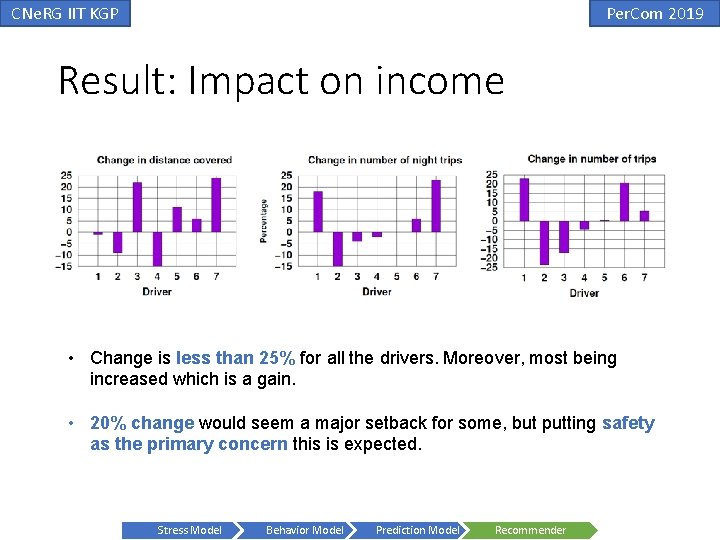
CNe. RG IIT KGP Per. Com 2019 Result: Impact on income • Change is less than 25% for all the drivers. Moreover, most being increased which is a gain. • 20% change would seem a major setback for some, but putting safety as the primary concern this is expected. Stress Model Behavior Model Prediction Model Recommender
CNe. RG IIT KGP Per. Com 2019 Conclusion • We have used driving data to develop a personalized model to compute driver’s stress.
CNe. RG IIT KGP Per. Com 2019 Conclusion • We have used driving data to develop a personalized model to compute driver’s stress. • We establish a strong quantitative relationship between driving behavior and driving stress.
CNe. RG IIT KGP Per. Com 2019 Conclusion • We have used driving data to develop a personalized model to compute driver’s stress. • We establish a strong quantitative relationship between driving behavior and driving stress. • We provide a model to predict driving behavior from stress.
CNe. RG IIT KGP Per. Com 2019 Conclusion • We have used driving data to develop a personalized model to compute driver’s stress. • We establish a strong quantitative relationship between driving behavior and driving stress. • We provide a model to predict driving behavior from stress. • We utilize these to develop a trip recommendation system for drivers.
CNe. RG IIT KGP Per. Com 2019 Conclusion • We have used driving data to develop a personalized model to compute driver’s stress. • We establish a strong quantitative relationship between driving behavior and driving stress. • We provide a model to predict driving behavior from stress. • We utilize these to develop a trip recommendation system for drivers. • We could also use the system for • Full day roster generation • Award system for better drivers • Driver recruitment based on how they cope in different scenarios
CNe. RG IIT KGP Per. Com 2019 Conclusion • We have used driving data to develop a personalized model to compute driver’s stress. • We establish a strong quantitative relationship between driving behavior and driving stress. • We provide a model to predict driving behavior from stress. • We utilize these to develop a trip recommendation system for drivers. • We could also use the system for • Full day roster generation • Award system for better drivers • Driver recruitment based on how they cope in different scenarios • We still need to look into how some non-quantifiable confounding variables like car condition, family issues, etc. can be utilized by the system.
CNe. RG IIT KGP Acknowledgements • Google – For supporting my travel. Per. Com 2019
CNe. RG IIT KGP Per. Com 2019 Driver Stress Level 1. No Stress 2. Medium Stress 3. High Stress Driving Data Thank you! Rohit Verma rohit. verma@iitkgp. ac. in Follow the work of Complex Network Research Group (CNe. RG), IIT KGP at: Web: http: //www. cnerg. org Facebook: https: //web. facebook. com/iitkgpcnerg Twitter: https: //www. twitter. com/cnerg