Ci Town The financialisation of residential housing Amsterdam


 Number of days available Amsterdam Air. Bn. B Prices (€/night) 19.")


 § Construction year is associated with higher price/m")

- Slides: 23
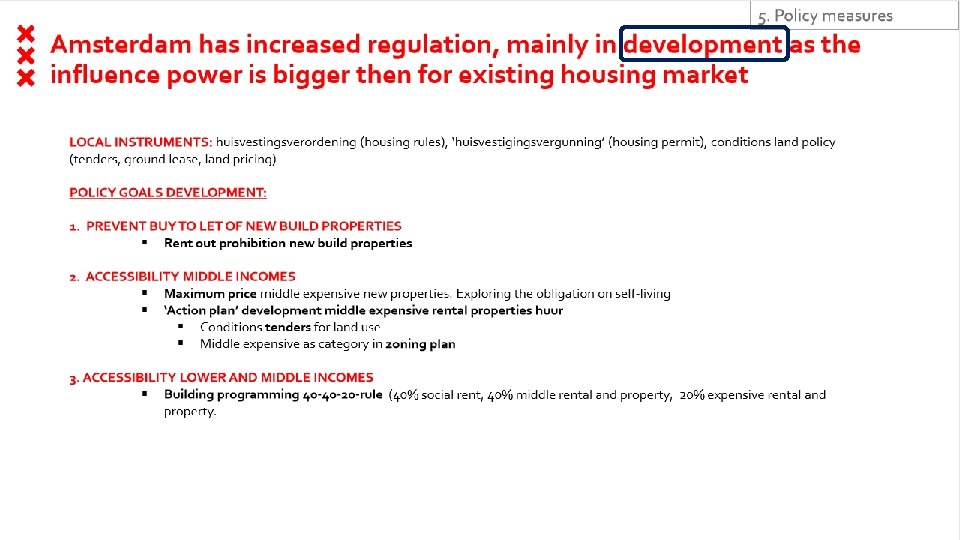
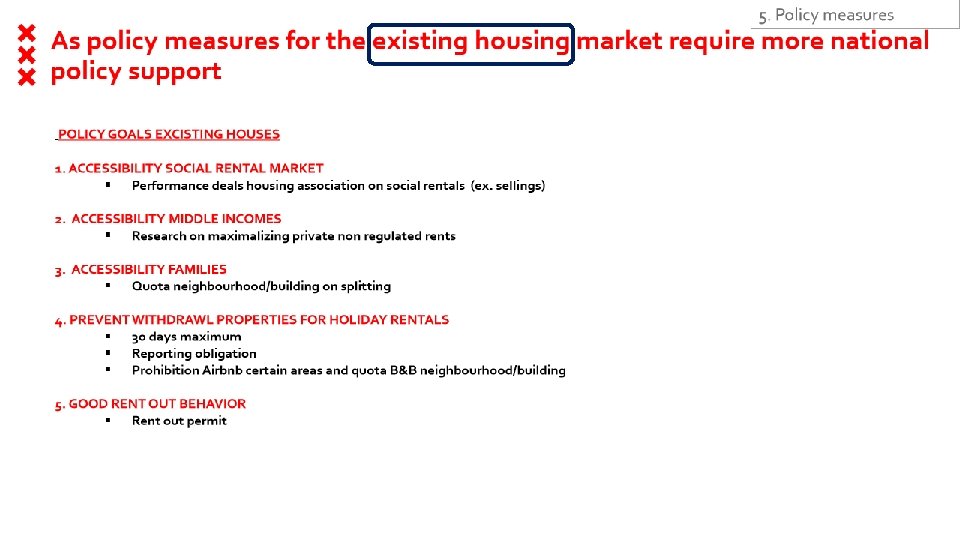
Ci. Town - The financialisation of residential housing § Amsterdam case study EC Joint Research Centre Territorial Development Unit (JRC. B 3) ricardo. barranco@ec. europa. eu chris. jacobs-crisioni@ec. europa. eu City of Amsterdam City Strategy Team j. taks@amsterdam. nl European Week of Regions and Cities Brussels, 8 th October 2019
Contents: 1. The Financialisation of housing: Policy for affordability - City of Amsterdam 2. Modelling Amsterdam housing costs - LUISA Territorial Modelling Platform
6696 (August, 2019) Number of days available Amsterdam Air. Bn. B Prices (€/night) 19. 619 houses for rent on Air. Bn. B 6696 houses rent out long term as hotels: (Frequently and over 60 days/month) = 5% of the owner-occupied properties.
2. Modelling Amsterdam housing costs: - A Data Science approach to analyse prices EC Joint Research Centre Territorial Development Unit (JRC. B 3) ricardo. barranco@ec. europa. eu chris. jacobs-crisioni@ec. europa. eu European Week of Regions and Cities Brussels, 8 th October 2019
Amsterdam housing costs: § The following slides show an analytical approach to study Amsterdam’s housing costs at fine resolution. § Is based on 2015 transaction data containing information for 10958 houses, several LUISA layers and uses price/m 2 as the study dependent variable. § The map gives an overview of Amsterdam’s housing costs spatial distribution. § Price/m 2 in “Inner Ring” area is considerably higher. Amsterdam Housing Prices (€/m 2): 2015
Amsterdam housing costs: § The following slides show an analytical approach to study Amsterdam’s housing costs at fine resolution. § Is based on 2015 transaction data containing information for 10958 houses, several LUISA layers and uses price/m 2 as the study dependent variable. § The map gives an overview of Amsterdam’s housing costs spatial distribution. § Older houses are mainly located within the “Inner Ring” area. Amsterdam Construction Year
Correlation Analysis: Correlation § For each of the 10958 houses were mapped 31 spatial indicators and then aggregated according to general thematics: Health, Education, Basic Services, Comsumption&Recreation, Transportation § They represented 2 main classes: - Distance indicators (distance to closest point) - Density indicators (total points within 500 m) § Calculated correlation coeficients for Price/m 2. Distance analysis Density analysis
Segmentation Analysis: § Customer segmentation is the practice of dividing a customer base into groups of individuals that are similar in specific ways. § Applied to 2 main groups: - Buyers segmentation - Seller segmentation § The 4 used variables were: - Type of residence; Type of buyer/seller; - Number of lots owned; Classification Buyers Segmentation: Cluster Type of buyer Type of residence Lots owned Classification Count Average Cost (€) Average Cost (€/m 2) Average Area (m 2) 1 Natural person Amsterdam resident Unknown Resident 5116 308. 000 3679 92 2 Natural person Amsterdam resident 1 -9 parcel Resident 3355 290. 750 4096 75 3 Natural person Amsterdam no-resident 10 -24 parcel Private owner < 25 addresses 2241 553. 000 3056 221 4 Company Amsterdam no-resident Unknown* Company 246 899. 000 3504 343 Sellers Segmentation: Cluster Type of buyer Type of residence Lots owned Classification Count Average Cost (€) Average Cost (€/m 2) Average Area (m 2) 1 Natural person Amsterdam resident 1 -9 parcel Resident 3984 230. 000 3879 69 2 Natural person Amsterdam no-resident 1 -9 parcel Small private owner < 25 addresses 4757 260. 000 4000 72 3 Natural person Unknown* 1246 353. 000 2674 130 4 Association Unknown* Housing Association 971 174. 000 2926 64 Notes: § Often missing information concerning buyers/sellers (*unknown). § Buying residents, invest in smaller areas but pay more per m 2. § Companies & Private owners buy bigger areas maybe for renting or office space.
Amsterdam ownership changes: Data description: The points represent 24231 real estates: § Built for residential purposes; § Privately owned by natural persons or regular companies in 2018; § Underwent at least one ownership change between 2015 and 2017. Methodology: § Analysis of clusters of high and low ownership change from 2007 to 2017 in real estate units in the municipality of Amsterdam. Notes: § Houses in West and Zuid boroughs located within A 10 motorway seem to be associated with recent ownership changes hotspots (red). Clusters of ownership change in privately owned houses: 2007 -2017
Modelling housing costs: Main determinants: § The Construction Year is the main driver, probably reflecting location/aesthetic preferences. Location plays an important role here also represented by Inner. Ring. The Buyer Segment is the 3 rd main determinant of the price/m 2. Year Inner. Ring Buyer. Segment Dist. Centre Accessibility Population Comsumption. Recreation Metro. Distance Mutations Seller. Segment Basic. Services. Distance Education Health Public. Transport Basic. Services Education. Distance Health. Distance Comsumption. Recreatio. . . Construction Year Output value § The aggregated indicators were applied on a machine learning regression model. The objective was to calculate what are the main housing cost determinants (R 2 = 0. 56, MAE: 744€/m 2). § Houses between 1950 and early 2000 are associated with lower output values. The market as a preference for older (pre-1950). § The relation between housing costs and distance to centre is not linear. After 4 km it’s when most houses are located as outside the Inner. Ring (blue dots). Inner Ring Output value Distance to centre 0 5 10 Feature Importance (%) 15 20 Outter Ring Impact on output value
Modelling housing costs: Main determinants: § The aggregated indicators were applied on a machine learning regression model. The objective was to calculate what are the main housing cost determinants (R 2 = 0. 56, MAE: 744€/m 2). § The Construction Year is the main driver, probably reflecting location/aesthetic preferences. Location plays an important role here also represented by Inner. Ring. The Buyer Segment is the 3 rd main determinant of the price/m 2. Year Inner. Ring Buyer. Segment Dist. Centre Accessibility Population Comsumption. Recreation Metro. Distance Mutations Seller. Segment Basic. Services. Distance Education Health Public. Transport Basic. Services Education. Distance Health. Distance Comsumption. Recreatio. . . Buyer segments influences the price/m 2: § Residents area linked with higher values per m 2. § Private owners/Companies have an opposite dynamics. They are linked with lower price/m 2. § Private owners/Companies potentially buy at lower prices for then selling more expensive: e. g. office space and buildings to be split/renovated. This is more evident closer to the city centre (“Inner Ring”). Buyer Segments Feature Importance (%) 15 20 Impact on output value Company 10 Private owner 5 Resident 0 Resident Output value Inner Ring Outter Ring
Main determinants: Predicted price (€/m 2) § Construction year is associated with higher price/m 2 for pre-1950 constructions. Construction Year Predicted price (€/m 2) § Distance to centre after 4 km impacts negatively the housing prices. Distance centre (km) Conclusions: § According to this modelling exercise Amsterdam prices/m 2 are mainly driven by the location (Year, Inner. Ring, Distance to centre), aesthetic (Year) and type of buyer (buyer segment). § This type of advance analysis allows having insights of the main determinants and possible interactions influencing housing prices. § Combines different datasources: House geolocation; Neighbourhood characteristics; Location/density of services; Buyers/sellers types; Transactions. . . § The graphical outputs make it intepretable to non-experts aiding decision makers on their policy and comunication to the general public. § Replicable method to compare European cities.
Thank you! Obrigado! Dank u! EC Joint Research Centre Territorial Development Unit (JRC. B 3) ricardo. barranco@ec. europa. eu chris. jacobs-crisioni@ec. europa. eu City of Amsterdam City Strategy Team j. taks@amsterdam. nl European Week of Regions and Cities Brussels, 8 th October 2019