Chapter 7 Why Diversification Is a Good Idea














- Slides: 85
Chapter 7 Why Diversification Is a Good Idea 1
The most important lesson learned is an old truth ratified. - General Maxwell R. Thurman 2
Outline u Introduction u Carrying your eggs in more than one basket u Role of uncorrelated securities u Lessons from Evans and Archer u Diversification and beta u Capital asset pricing model u Equity risk premium u Using a scatter diagram to measure beta u Arbitrage pricing theory 3
Introduction u Diversification of a portfolio is logically a good idea u Virtually all stock portfolios seek to diversify in one respect or another 4
Carrying Your Eggs in More Than One Basket u Investments in your own ego u The concept of risk aversion revisited u Multiple investment objectives 5
Investments in Your Own Ego u Never put a large percentage of investment funds into a single security • If the security appreciates, the ego is stroked and this may plant a speculative seed • If the security never moves, the ego views this as neutral rather than an opportunity cost • If the security declines, your ego has a very difficult time letting go 6
The Concept of Risk Aversion Revisited u Diversification is logical • If you drop the basket, all eggs break u Diversification is mathematically sound • Most people are risk averse • People take risks only if they believe they will be rewarded for taking them 7
The Concept of Risk Aversion Revisited (cont’d) u Diversification is more important now • Journal of Finance article shows that volatility of individual firms has increased – Investors need more stocks to adequately diversify 8
Multiple Investment Objectives u Multiple objectives justify carrying your eggs in more than one basket • Some people find mutual funds “unexciting” • Many investors hold their investment funds in more than one account so that they can “play with” part of the total – E. g. , a retirement account and a separate brokerage account for trading individual securities 9
Role of Uncorrelated Securities u Variance of a linear combination: the practical meaning u Portfolio programming in a nutshell u Concept of dominance u Harry Markowitz: the founder of portfolio theory 10
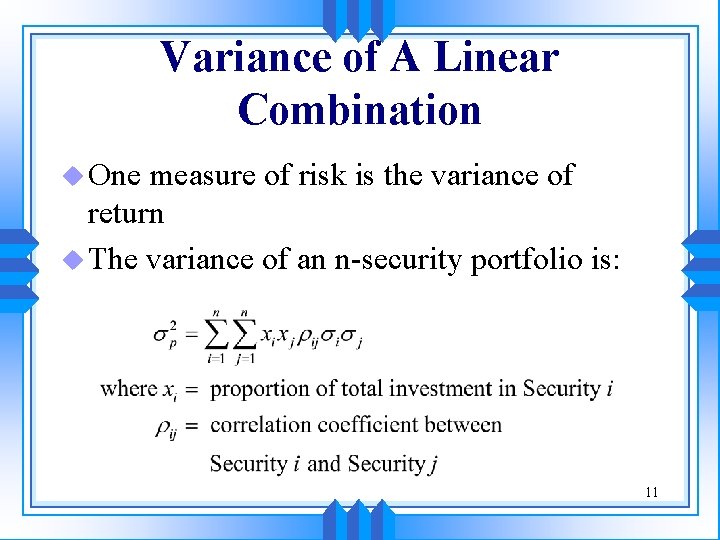
Variance of A Linear Combination u One measure of risk is the variance of return u The variance of an n-security portfolio is: 11
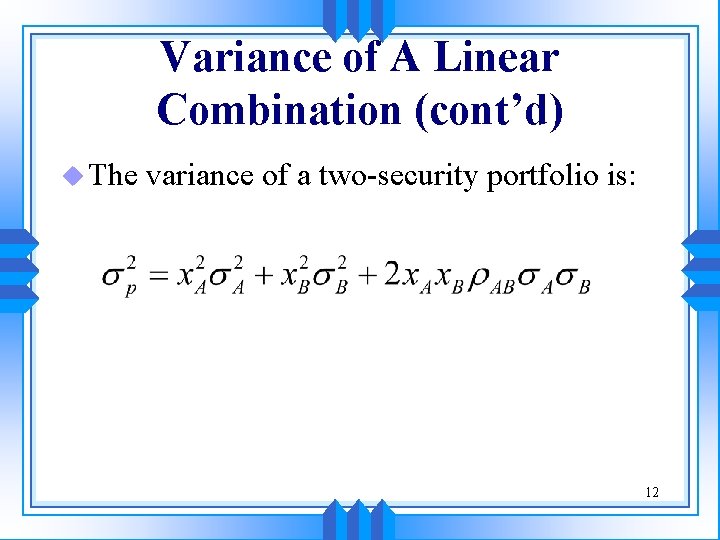
Variance of A Linear Combination (cont’d) u The variance of a two-security portfolio is: 12
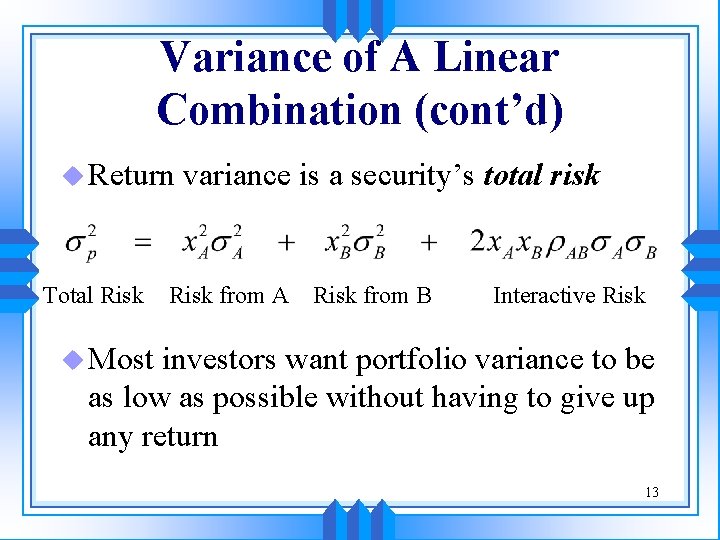
Variance of A Linear Combination (cont’d) u Return Total Risk variance is a security’s total risk Risk from A Risk from B Interactive Risk u Most investors want portfolio variance to be as low as possible without having to give up any return 13
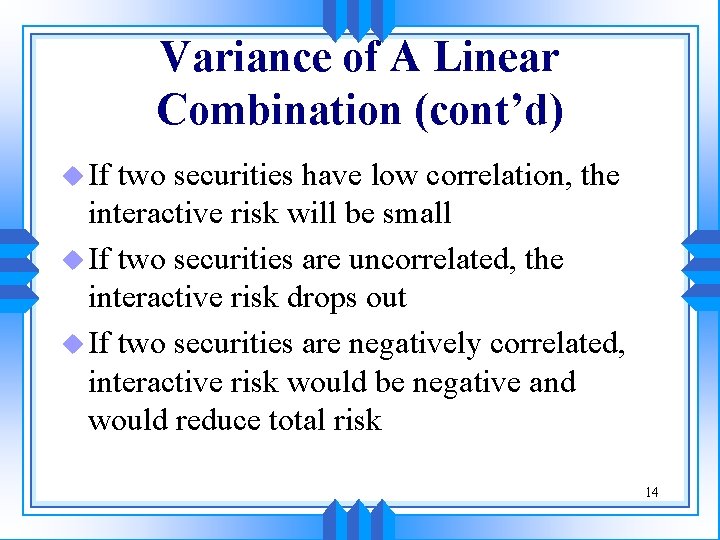
Variance of A Linear Combination (cont’d) u If two securities have low correlation, the interactive risk will be small u If two securities are uncorrelated, the interactive risk drops out u If two securities are negatively correlated, interactive risk would be negative and would reduce total risk 14
Portfolio Programming in A Nutshell u Various portfolio combinations may result in a given return u The investor wants to choose the portfolio combination that provides the least amount of variance 15
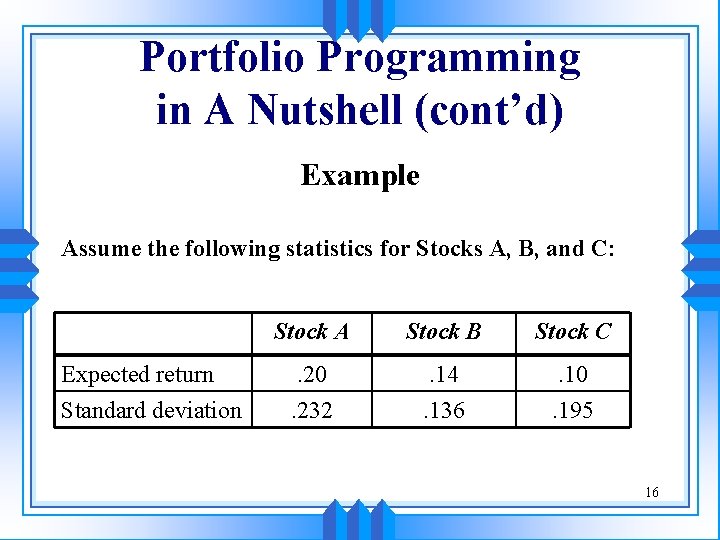
Portfolio Programming in A Nutshell (cont’d) Example Assume the following statistics for Stocks A, B, and C: Expected return Standard deviation Stock A Stock B Stock C . 20. 232 . 14. 136 . 10. 195 16
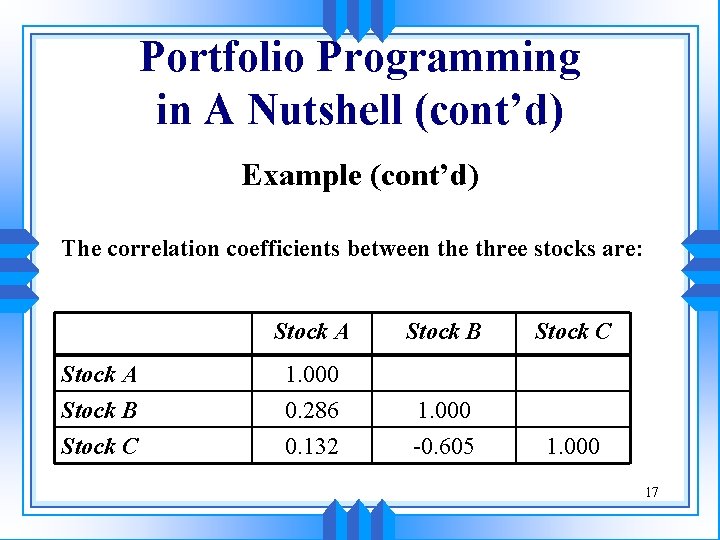
Portfolio Programming in A Nutshell (cont’d) Example (cont’d) The correlation coefficients between the three stocks are: Stock A Stock B Stock C 1. 000 0. 286 0. 132 1. 000 -0. 605 1. 000 17
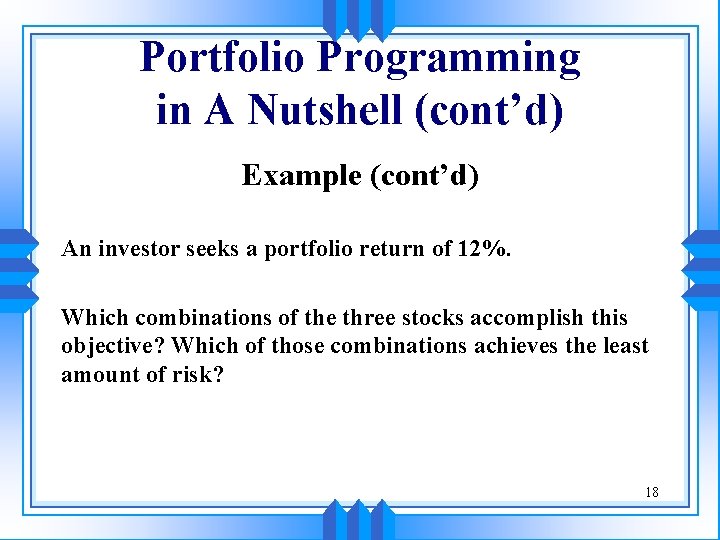
Portfolio Programming in A Nutshell (cont’d) Example (cont’d) An investor seeks a portfolio return of 12%. Which combinations of the three stocks accomplish this objective? Which of those combinations achieves the least amount of risk? 18
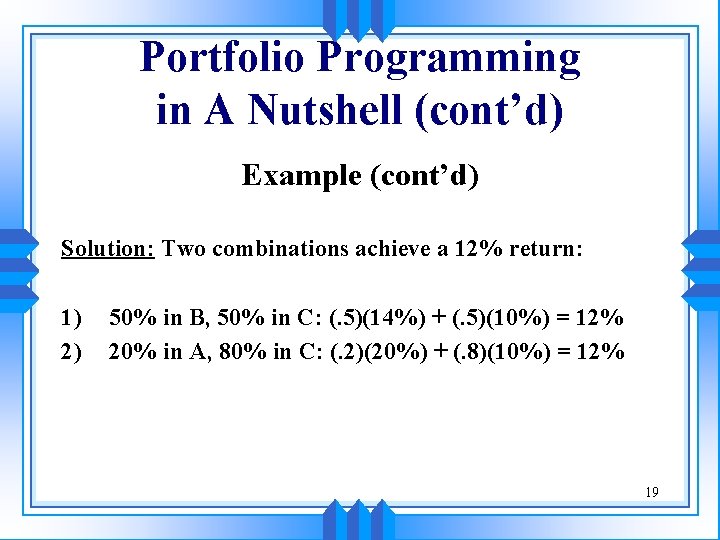
Portfolio Programming in A Nutshell (cont’d) Example (cont’d) Solution: Two combinations achieve a 12% return: 1) 2) 50% in B, 50% in C: (. 5)(14%) + (. 5)(10%) = 12% 20% in A, 80% in C: (. 2)(20%) + (. 8)(10%) = 12% 19
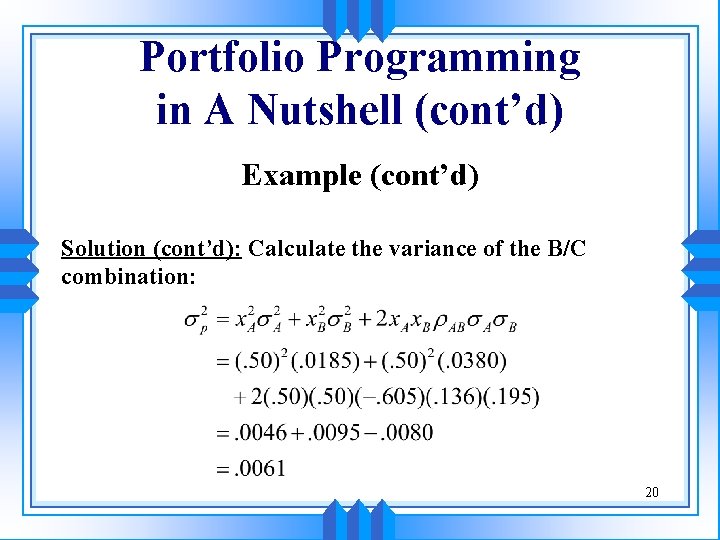
Portfolio Programming in A Nutshell (cont’d) Example (cont’d) Solution (cont’d): Calculate the variance of the B/C combination: 20
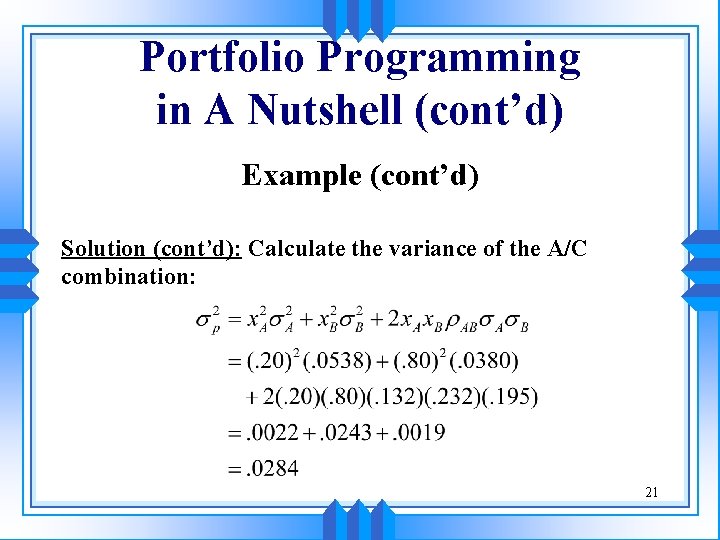
Portfolio Programming in A Nutshell (cont’d) Example (cont’d) Solution (cont’d): Calculate the variance of the A/C combination: 21
Portfolio Programming in A Nutshell (cont’d) Example (cont’d) Solution (cont’d): Investing 50% in Stock B and 50% in Stock C achieves an expected return of 12% with the lower portfolio variance. Thus, the investor will likely prefer this combination to the alternative of investing 20% in Stock A and 80% in Stock C. 22
Concept of Dominance u Dominance is a situation in which investors universally prefer one alternative over another • All rational investors will clearly prefer one alternative 23
Concept of Dominance (cont’d) u. A portfolio dominates all others if: • For its level of expected return, there is no other portfolio with less risk • For its level of risk, there is no other portfolio with a higher expected return 24
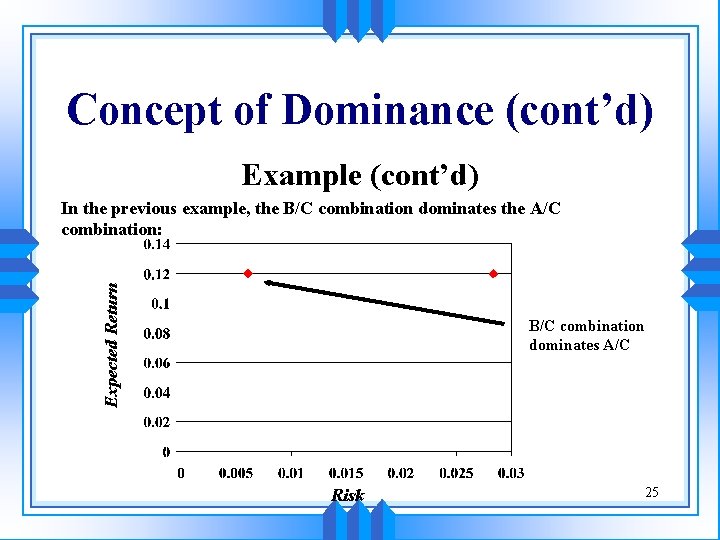
Concept of Dominance (cont’d) Example (cont’d) Expected Return In the previous example, the B/C combination dominates the A/C combination: B/C combination dominates A/C Risk 25
Harry Markowitz: Founder of Portfolio Theory u Introduction u Terminology u Quadratic programming 26
Introduction u Harry Markowitz’s “Portfolio Selection” Journal of Finance article (1952) set the stage for modern portfolio theory • The first major publication indicating the important of security return correlation in the construction of stock portfolios • Markowitz showed that for a given level of expected return and for a given security universe, knowledge of the covariance and correlation matrices are required 27
Terminology u Security Universe u Efficient frontier u Capital market line and the market portfolio u Security market line u Expansion of the SML to four quadrants u Corner portfolio 28
Security Universe u The security universe is the collection of all possible investments • For some institutions, only certain investments may be eligible – E. g. , the manager of a small cap stock mutual fund would not include large cap stocks 29
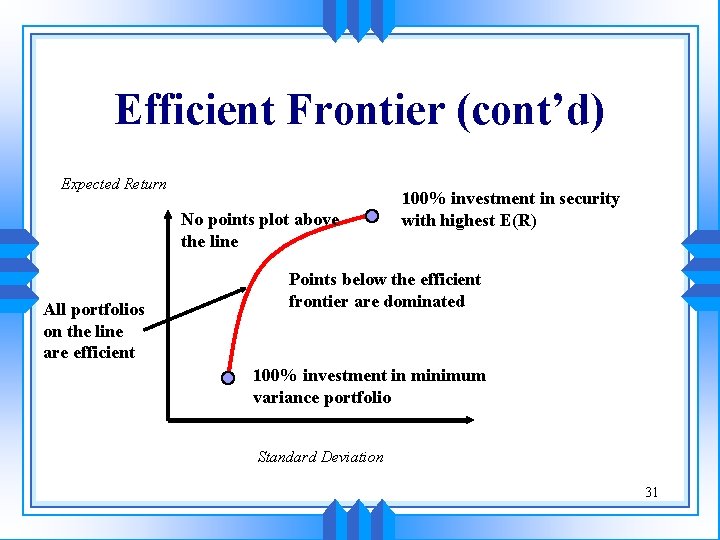
Efficient Frontier u Construct a risk/return plot of all possible portfolios • Those portfolios that are not dominated constitute the efficient frontier 30
Efficient Frontier (cont’d) Expected Return No points plot above the line All portfolios on the line are efficient 100% investment in security with highest E(R) Points below the efficient frontier are dominated 100% investment in minimum variance portfolio Standard Deviation 31
Efficient Frontier (cont’d) u The farther you move to the left on the efficient frontier, the greater the number of securities in the portfolio 32
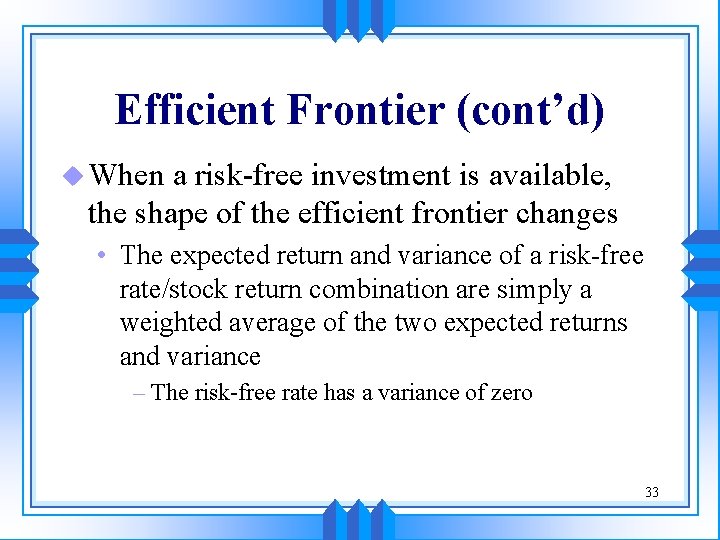
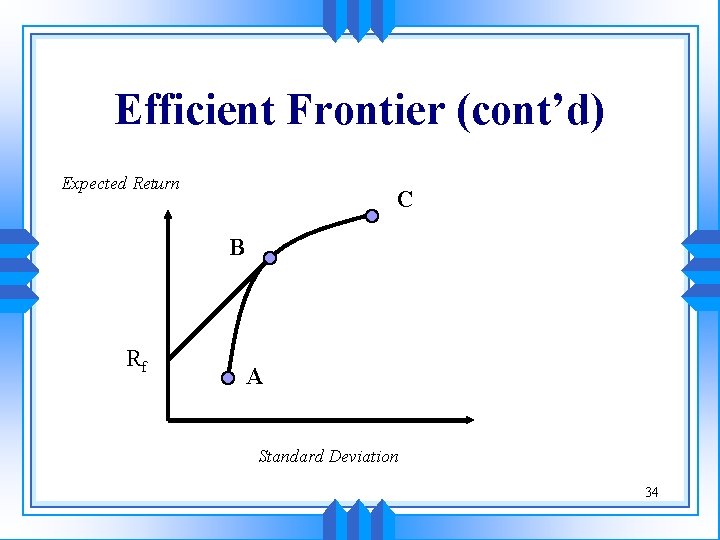
Efficient Frontier (cont’d) u When a risk-free investment is available, the shape of the efficient frontier changes • The expected return and variance of a risk-free rate/stock return combination are simply a weighted average of the two expected returns and variance – The risk-free rate has a variance of zero 33
Efficient Frontier (cont’d) Expected Return C B Rf A Standard Deviation 34
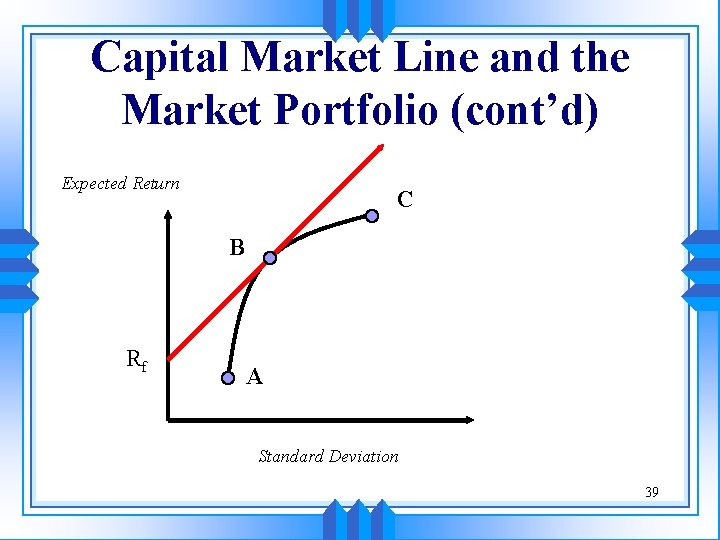
Efficient Frontier (cont’d) u The efficient frontier with a risk-free rate: • Extends from the risk-free rate to point B – The line is tangent to the risky securities efficient frontier • Follows the curve from point B to point C 35
Capital Market Line and the Market Portfolio u The tangent line passing from the risk-free rate through point B is the capital market line (CML) • When the security universe includes all possible investments, point B is the market portfolio – It contains every risky assets in the proportion of its market value to the aggregate market value of all assets – It is the only risky assets risk-averse investors will hold 36
Capital Market Line and the Market Portfolio (cont’d) u Implication for investors: • Regardless of the level of risk-aversion, all investors should hold only two securities: – The market portfolio – The risk-free rate • Conservative investors will choose a point near the lower left of the CML • Growth-oriented investors will stay near the market portfolio 37
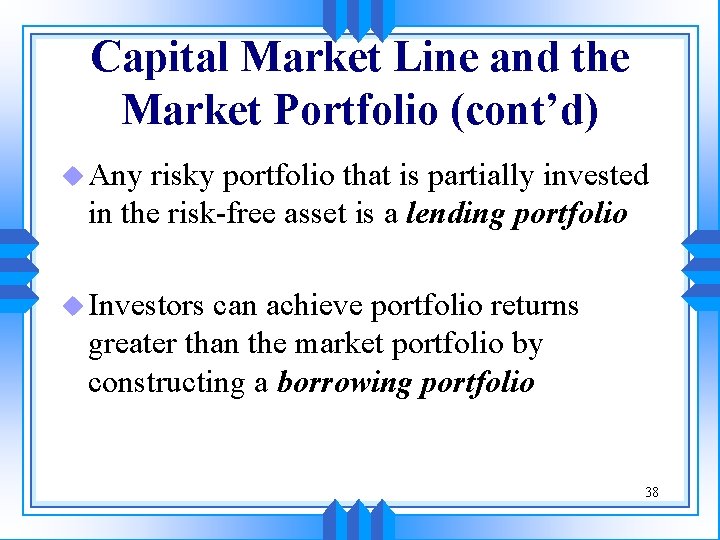
Capital Market Line and the Market Portfolio (cont’d) u Any risky portfolio that is partially invested in the risk-free asset is a lending portfolio u Investors can achieve portfolio returns greater than the market portfolio by constructing a borrowing portfolio 38
Capital Market Line and the Market Portfolio (cont’d) Expected Return C B Rf A Standard Deviation 39
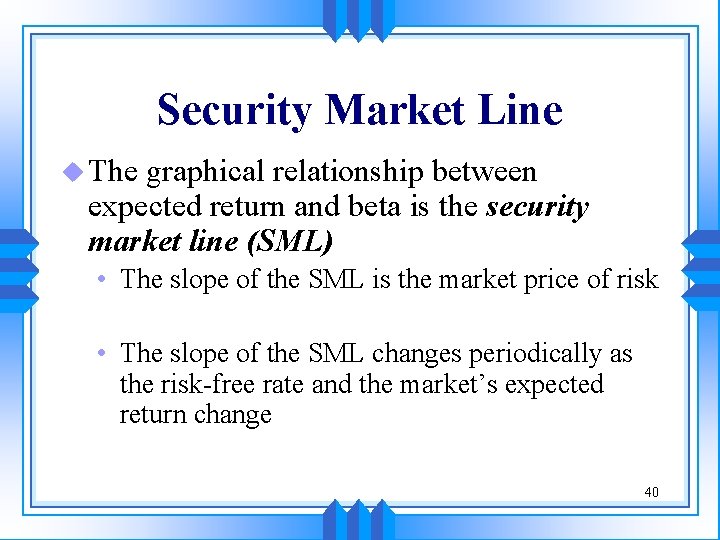
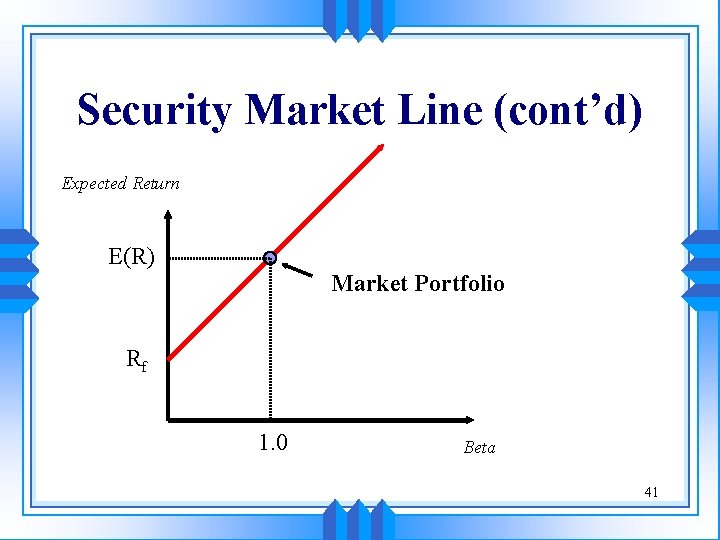
Security Market Line u The graphical relationship between expected return and beta is the security market line (SML) • The slope of the SML is the market price of risk • The slope of the SML changes periodically as the risk-free rate and the market’s expected return change 40
Security Market Line (cont’d) Expected Return E(R) Market Portfolio Rf 1. 0 Beta 41
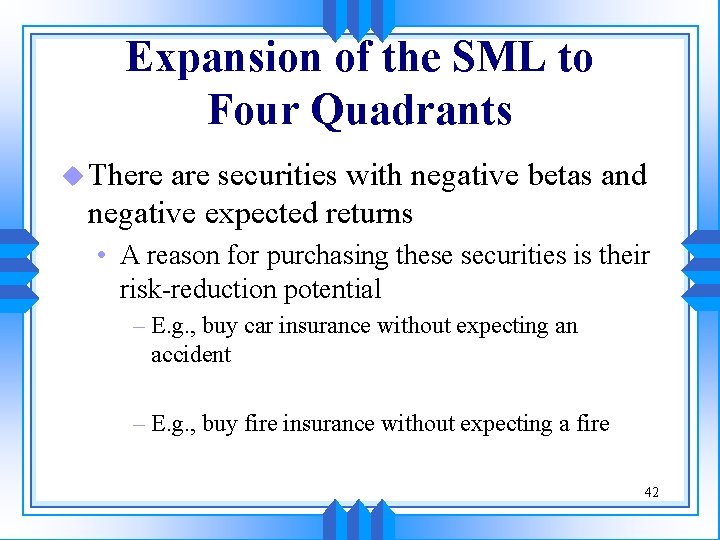
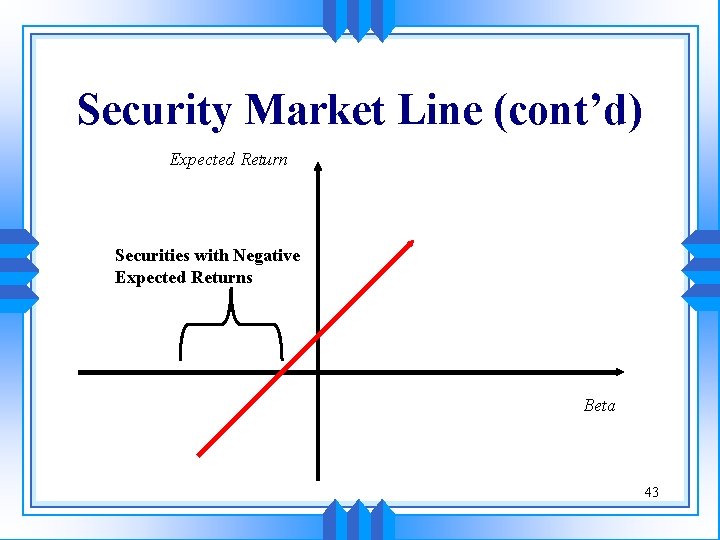
Expansion of the SML to Four Quadrants u There are securities with negative betas and negative expected returns • A reason for purchasing these securities is their risk-reduction potential – E. g. , buy car insurance without expecting an accident – E. g. , buy fire insurance without expecting a fire 42
Security Market Line (cont’d) Expected Return Securities with Negative Expected Returns Beta 43
Corner Portfolio u. A corner portfolio occurs every time a new security enters an efficient portfolio or an old security leaves • Moving along the risky efficient frontier from right to left, securities are added and deleted until you arrive at the minimum variance portfolio 44
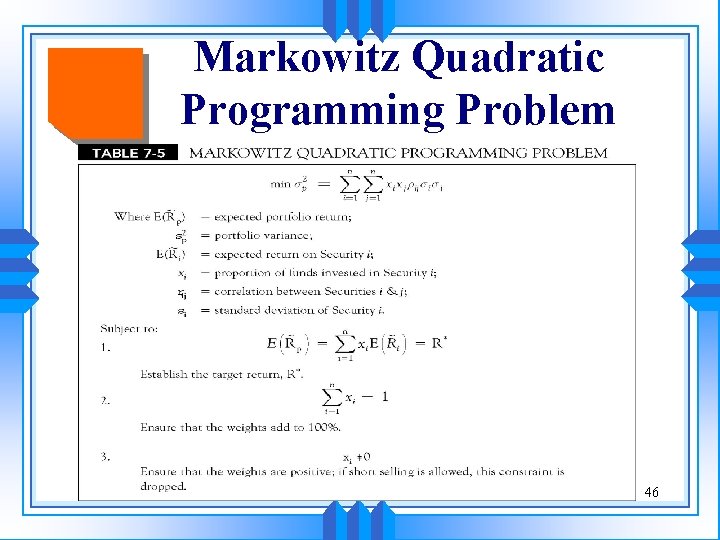
Quadratic Programming u The Markowitz algorithm is an application of quadratic programming • The objective function involves portfolio variance • Quadratic programming is very similar to linear programming 45
Markowitz Quadratic Programming Problem 46
Lessons from Evans and Archer u Introduction u Methodology u Results u Implications u Words of caution 47
Introduction u Evans and Archer’s 1968 Journal of Finance article • Very consequential research regarding portfolio construction • Shows how naïve diversification reduces the dispersion of returns in a stock portfolio – Naïve diversification refers to the selection of portfolio components randomly 48
Methodology u Used computer simulations: • Measured the average variance of portfolios of different sizes, up to portfolios with dozens of components • Purpose was to investigate the effects of portfolio size on portfolio risk when securities are randomly selected 49
Results u Definitions u General results u Strength in numbers u Biggest benefits come first u Superfluous diversification 50
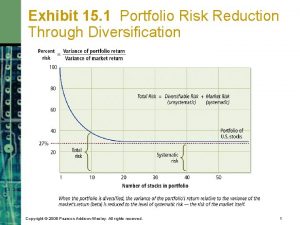
Definitions u Systematic risk is the risk that remains after no further diversification benefits can be achieved u Unsystematic risk is the part of total risk that is unrelated to overall market movements and can be diversified • Research indicates up to 75 percent of total risk is diversifiable 51
Definitions (cont’d) u Investors are rewarded only for systematic risk • Rational investors should always diversify • Explains why beta (a measure of systematic risk) is important – Securities are priced on the basis of their beta coefficients 52
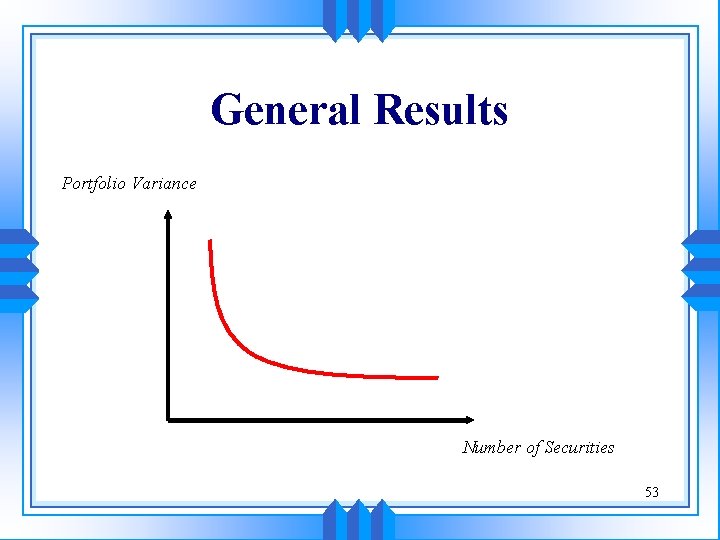
General Results Portfolio Variance Number of Securities 53
Strength in Numbers u Portfolio variance (total risk) declines as the number of securities included in the portfolio increases • On average, a randomly selected ten-security portfolio will have less risk than a randomly selected three-security portfolio • Risk-averse investors should always diversify to eliminate as much risk as possible 54
Biggest Benefits Come First u Increasing the number of portfolio components provides diminishing benefits as the number of components increases • Adding a security to a one-security portfolio provides substantial risk reduction • Adding a security to a twenty-security portfolio provides only modest additional benefits 55
Superfluous Diversification u Superfluous diversification refers to the addition of unnecessary components to an already well-diversified portfolio • Deals with the diminishing marginal benefits of additional portfolio components • The benefits of additional diversification in large portfolio may be outweighed by the transaction costs 56
Implications u Very effective diversification occurs when the investor owns only a small fraction of the total number of available securities • Institutional investors may not be able to avoid superfluous diversification due to the dollar size of their portfolios – Mutual funds are prohibited from holding more than 5 percent of a firm’s equity shares 57
Implications (cont’d) u Owning all possible securities would require high commission costs u It is difficult to follow every stock 58
Words of Caution u Selecting securities at random usually gives good diversification, but not always u Industry effects may prevent proper diversification u Although naïve diversification reduces risk, it can also reduce return • Unlike Markowitz’s efficient diversification 59
Diversification and Beta u Beta measures systematic risk • Diversification does not mean to reduce beta • Investors differ in the extent to which they will take risk, so they choose securities with different betas – E. g. , an aggressive investor could choose a portfolio with a beta of 2. 0 – E. g. , a conservative investor could choose a portfolio with a beta of 0. 5 60
Capital Asset Pricing Model u Introduction u Systematic and unsystematic risk u Fundamental risk/return relationship revisited 61
Introduction u The Capital Asset Pricing Model (CAPM) is a theoretical description of the way in which the market prices investment assets • The CAPM is a positive theory 62
Systematic and Unsystematic Risk u Unsystematic risk can be diversified and is irrelevant u Systematic risk cannot be diversified and is relevant • Measured by beta – Beta determines the level of expected return on a security or portfolio (SML) 63
Fundamental Risk/Return Relationship Revisited u CAPM u SML and CAPM u Market model versus CAPM u Note on the CAPM assumptions u Stationarity of beta 64
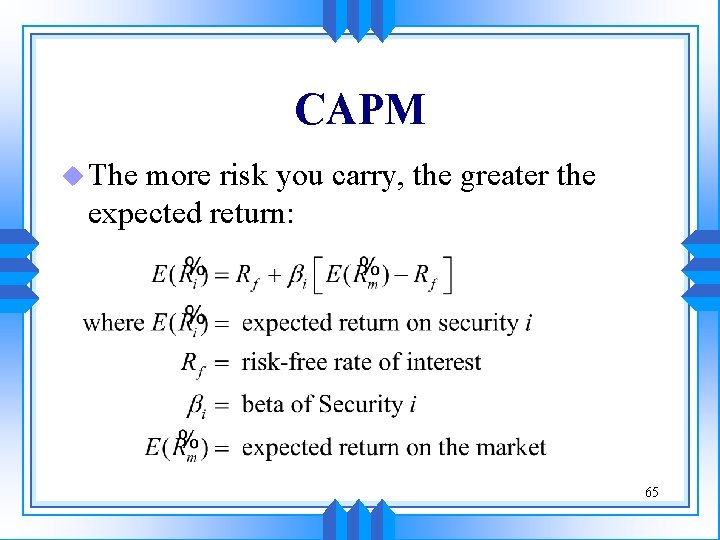
CAPM u The more risk you carry, the greater the expected return: 65
CAPM (cont’d) u The CAPM deals with expectations about the future u Excess returns on a particular stock are directly related to: • The beta of the stock • The expected excess return on the market 66
CAPM (cont’d) u CAPM assumptions: • Variance of return and mean return are all investors care about • Investors are price takers – They cannot influence the market individually • All investors have equal and costless access to information • There are no taxes or commission costs 67
CAPM (cont’d) u CAPM assumptions (cont’d): • Investors look only one period ahead • Everyone is equally adept at analyzing securities and interpreting the news 68
SML and CAPM u If you show the security market line with excess returns on the vertical axis, the equation of the SML is the CAPM • The intercept is zero • The slope of the line is beta 69
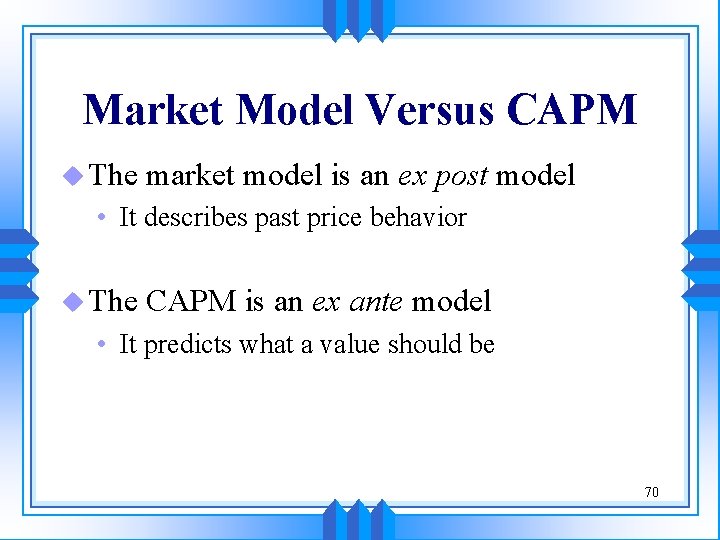
Market Model Versus CAPM u The market model is an ex post model • It describes past price behavior u The CAPM is an ex ante model • It predicts what a value should be 70
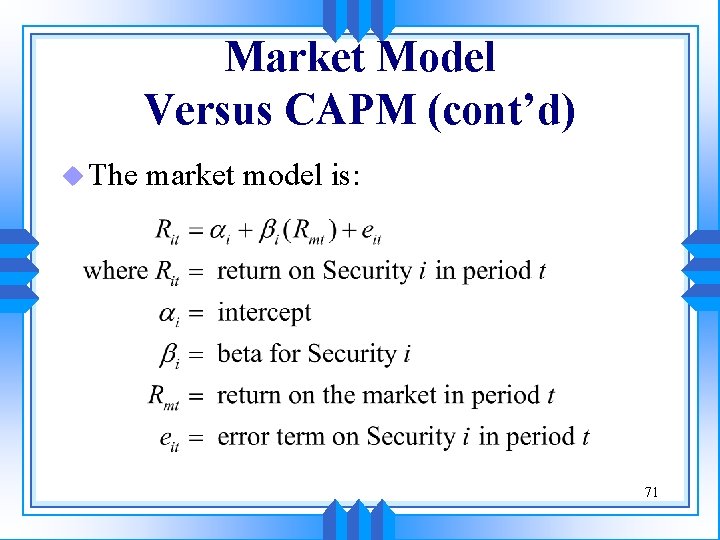
Market Model Versus CAPM (cont’d) u The market model is: 71
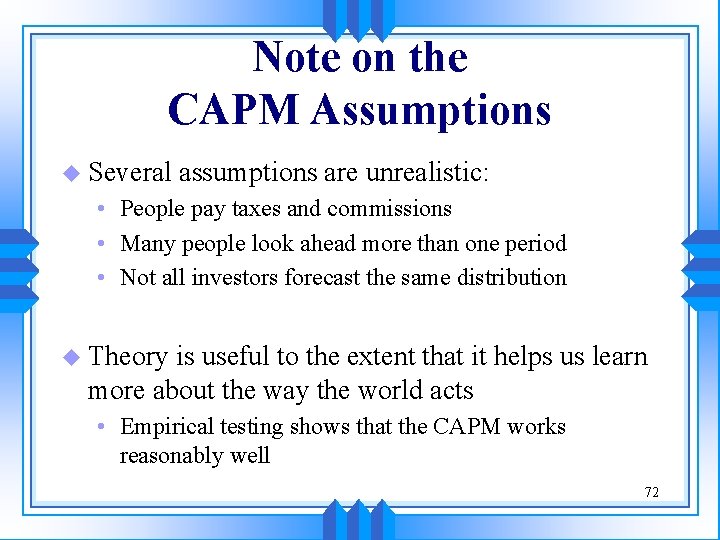
Note on the CAPM Assumptions u Several assumptions are unrealistic: • People pay taxes and commissions • Many people look ahead more than one period • Not all investors forecast the same distribution u Theory is useful to the extent that it helps us learn more about the way the world acts • Empirical testing shows that the CAPM works reasonably well 72
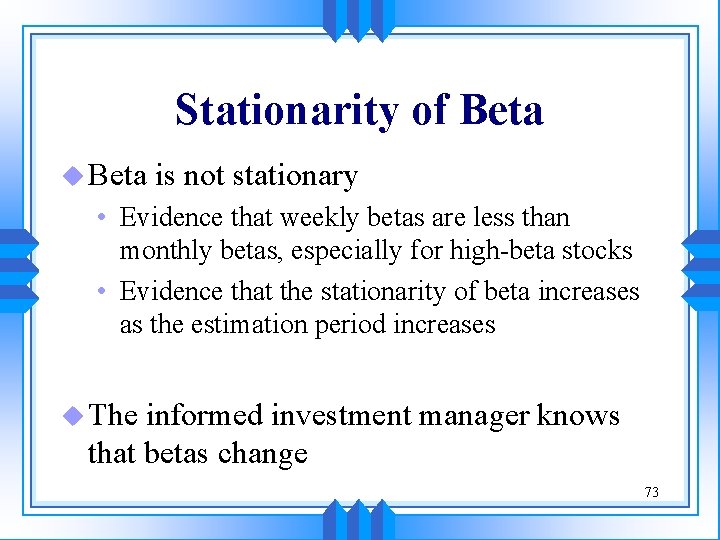
Stationarity of Beta u Beta is not stationary • Evidence that weekly betas are less than monthly betas, especially for high-beta stocks • Evidence that the stationarity of beta increases as the estimation period increases u The informed investment manager knows that betas change 73
Equity Risk Premium u Equity risk premium refers to the difference in the average return between stocks and some measure of the risk-free rate • The equity risk premium in the CAPM is the excess expected return on the market • Some researchers are proposing that the size of the equity risk premium is shrinking 74
Using A Scatter Diagram to Measure Beta u Correlation of returns u Linear regression and beta u Importance of logarithms u Statistical significance 75
Correlation of Returns u Much of the daily news is of a general economic nature and affects all securities • Stock prices often move as a group • Some stock routinely move more than the others regardless of whether the market advances or declines – Some stocks are more sensitive to changes in economic conditions 76
Linear Regression and Beta u To obtain beta with a linear regression: • Plot a stock’s return against the market return • Use Excel to run a linear regression and obtain the coefficients – The coefficient for the market return is the beta statistic – The intercept is the trend in the security price returns that is inexplicable by finance theory 77
Importance of Logarithms u Taking the logarithm of returns reduces the impact of outliers • Outliers distort the general relationship • Using logarithms will have more effect the more outliers there are 78
Statistical Significance u Published betas are not always useful numbers • Individual securities have substantial unsystematic risk and will behave differently than beta predicts • Portfolio betas are more useful since some unsystematic risk is diversified away 79
Arbitrage Pricing Theory u APT background u The APT model u Comparison of the CAPM and the APT 80
APT Background u Arbitrage pricing theory (APT) states that a number of distinct factors determine the market return • Roll and Ross state that a security’s long-run return is a function of changes in: – Inflation – Industrial production – Risk premiums – The slope of the term structure of interest rates 81
APT Background (cont’d) u Not all analysts are concerned with the same set of economic information • A single market measure such as beta does not capture all the information relevant to the price of a stock 82
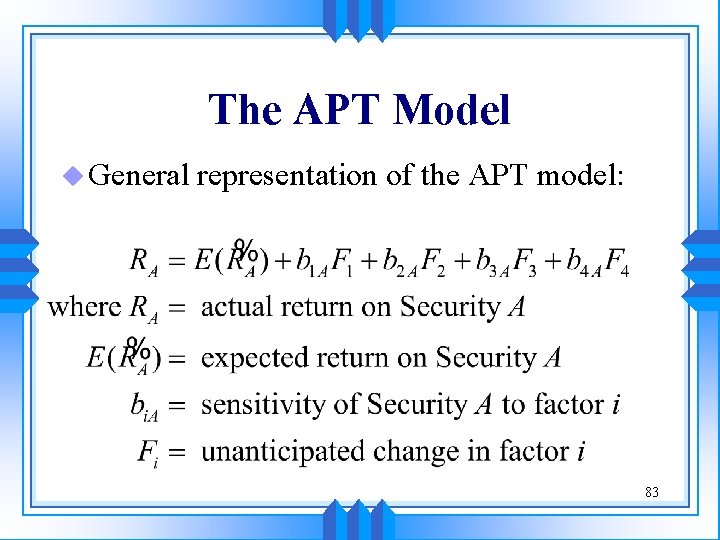
The APT Model u General representation of the APT model: 83
Comparison of the CAPM and the APT u The CAPM’s market portfolio is difficult to construct: • Theoretically all assets should be included (real estate, gold, etc. ) • Practically, a proxy like the S&P 500 index is used u APT requires specification of the relevant macroeconomic factors 84
Comparison of the CAPM and the APT (cont’d) u The CAPM and APT complement each other rather than compete • Both models predict that positive returns will result from factor sensitivities that move with the market and vice versa 85