Chapter 18 Our Expanding Universe Chapter 18 makes


 of Huchra and Geller.")


. Slope = Rise/Run = H 0")
")


.")

 Homogeneity. A term describing the similar appearance of the universe in")


?")


 developed a luminosity classification scheme for galaxies using members of")

 from UK Schmidt plates.")
 from UK Schmidt plates. An")


 contains only old low-mass stars and no")
.")
.")


 in the Coma cluster relative to spirals")


 and its companion (M 52).")
 as a")
, optical image.")
 as a collision between two")

 as a")


 c. D")
")
 and")

 quasars = quasi-stellar radio sources (i. e. , lots of radio")


. A spheroidal galaxy containing millions to billions of old")
 Anemic Spiral galaxy (A). A spiral galaxy with anemiclooking spiral arms,")
 Quasar. A star-like object superposed on a distant galaxy, discovered by")


- Slides: 106
Chapter 18 Our Expanding Universe Chapter 18 makes the “grand leap” to the universe as a whole, and introduces ideas about other galaxies that are less than a century old. The existence of other galaxies of stars was debated without resolution in 1920, but is now common fact. 1. The nature of the universe is revealed by galaxy redshifts and the 3 K microwave background. 2. At present the term “redshift” is synonymous with “distance, ” although there is still some debate in lesser quarters.
Until after the Great Debate of 1920 between Harlow Shapley and Heber Curtis into the nature of the spiral nebulae, it was not obvious that there were other galaxies beyond the Milky Way. Shapley, the “winner” of the debate, actually argued that spiral nebulae were part of our Galaxy. Curtis, the loser ultimately proven correct, argued that the spiral nebulae were other galaxies lying beyond the borders of the Milky Way. In 1920 the best views of “spiral nebulae” were ambiguous about whether or not they contained stars.
This is one of the best “pictures” of our Galaxy from the Sun’s location as sketched by Sergei Gaposhkin from Australia (1957), . The lower view is Sergei’s attempt to step outwards by 1000 parsecs from the Sun. Bulge Disk
Since the Sun is located just above the central line of the main disk of the Galaxy, only lines of sight upwards from the main disk give the best views of the surrounding universe of galaxies.
The rectangular area below lies upwards from the Galactic plane, thereby sampling the universe.
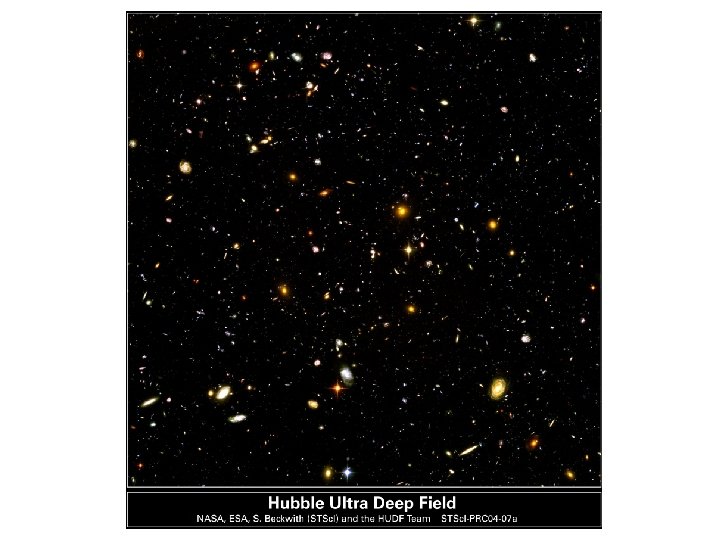
A close-up of the region of sky where the Hubble Space Telescope Ultra Deep Field image lies.
Every “fuzzy” object in this image is a distant galaxy. Foreground stars in our own Galaxy have associated diffraction spikes because they are pointlike images. Star
Schematics of the meanings for “homogeneous” and “isotropic. ”
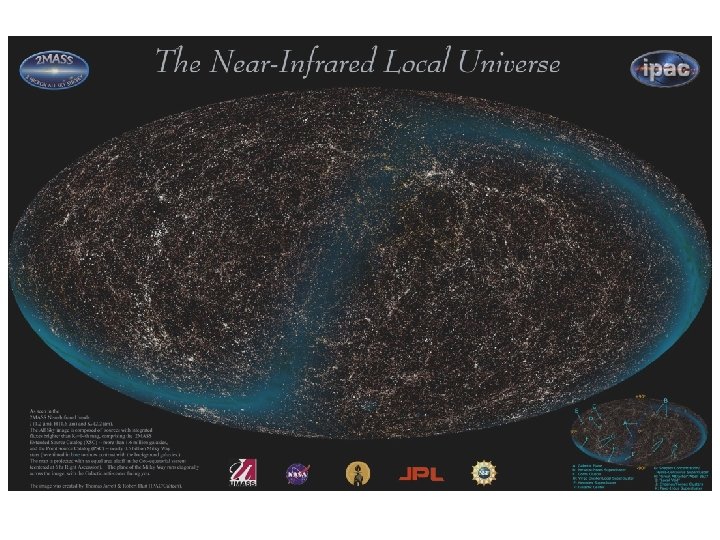
Bubbles, Voids, and Strands. Surveys of the spatial distribution of galaxies indicate that they are not as “homogeneous” as sometimes thought. The location and brightness of galaxies in this view indicate the patchy nature of their distribution.
Distance surveys in selected bands of sky further accentuate the patchy nature of the distribution of galaxies, which is marked by bubbles containing very few galaxies surrounded by denser strands rich in clusters and superclusters of galaxies.
The Cf. A survey (with “stickman”) of Huchra and Geller.
The Cf. A survey of Huchra and Geller.
The 2 d. F Galaxy Redshift Survey. The largest voids measure 100 Mpc across.
How are distances to galaxies determined? Distances to nearby solar system objects are measured by radar, nearby stars by parallax, then cluster main sequence fitting, the Cepheid PL relation, and finally Type Ia supernovae.
The standard candles used to measure distances to galaxies are: For “nearby” galaxies, Cepheid variables, since their periods of pulsation correlate with their intrinsic luminosities (period-luminosity relation). (similar to using the “watts” label on a light bulb to determine how bright it is) For distant galaxies, Type Ia supernovae, since their peak brightness is always the same. They are also the brightest class of supernovae. (similar to, say, all supernovae appearing as bright as a “ 150 watt” light bulb)
Determining distances to galaxies using Cepheid variables. Step 1. Identify a Cepheid from its changes in brightness with time. Step 2. Measure its mean brightness and period of variability. Step 3. Use the Cepheid period-luminosity relation to establish its intrinsic brightness and calculate its distance.
Lastly, there is a relationship between a galaxy’s redshift and its distance. Cluster elliptical galaxies of different redshift, and how they correlate with distance for an outdated Hubble constant of 50 km/s/Mpc.
Note how size and redward shift of the spectral lines correlate exactly for bright ellipticals.
Redshift-distance relation.
Conclusion: We live in an expanding universe.
A baking raisin bread analogy is often used to picture an expanding universe. It does not matter which raisin represents the Sun. From every raisin the nearest raisins all appear to increase their distances with time, at a rate proportional to the distance from the reference raisin.
The meaning of “redshift. ” Spectral features are shifted to longer wavelengths according to a simple formula: (λobserved – λrest)/λrest = velocity/c. The spectrum is “stretched” to the red, not simply shifted. There is no shift for λ = 0.
The Hubble Law is not a peculiarity of our local galactic neighbourhood, but reflects an actual expansion of space, much like the expanding raisin bread, referred to as the “Hubble flow. ” Velocities and distances are often found with the standard Doppler equation: and For large velocities (approaching c), the relativistic velocity and distance equations become: and For reference purposes only.
The simple formula z = v/c breaks down as speeds approach the velocity of light, and the relativistic version must be used.
How observed redshift z correlates with recession velocity v when the relativistic formula is used. Note that z = 5 does not mean a galaxy is moving at 5 times the speed of light. It is actually moving at 95% of the speed of light.
Redshift-distance relation (again). Slope = Rise/Run = H 0
The inverse of the Hubble constant (which is the slope of the Hubble relation) has units of time and is called the Hubble Time. It is an estimate of the age of the universe (backwards extrapolation), provided that the expansion began at some point in the past and has been continuing at the same rate ever since. For H 0 = 71 km/s/Mpc. The textbook uses H 0 = 22 km/s/Mly (the same). The Milky Way’s globular clusters are all less than 14 billion years old.
Penzias and Wilson with the radio horn used to discover the 3 K microwave background radiation.
The 3 K background revealed by the COBE satellite, displays a “Doppler shift” attributed to mass asymmetry in the early universe when matter separated from radiation.
The “Doppler effect” seen in COBE measurements of the 3 K background.
The 3 K microwave background with the Doppler shift removed, as recorded by WMAP.
The 3 K microwave background matches the radiation from a black body with T = 2. 728 K.
The 2. 728 K background is the constant faint glow from the universe when T = 3000 K, now redshifted by z ≈ 1000.
Conclusion: We live in an expanding universe that has a background glow.
Next Step? Big Bang cosmology?
Predicted versus Observed element abundances for a Big Bang Model
Origin of the 3 K microwave background
How the “scale factor” changes with time
The temporal development of the universe according to the Big Bang model (logarithmic units).
Astronomical Terminology Shapley-Curtis Debate. A 1920 debate in Washington about the nature of the spiral nebulae. Hubble Law. The relationship correlating increasing distance with larger recession velocity for galaxies. Hubble Constant. The slope of the Hubble relation: H 0 = 71 km/s/Mpc = 22 km/s/Mly. Hubble Time. The inverse slope of the Hubble relation, yielding an estimate of 13. 8 billion years for the age of the universe. Relativistic Doppler Shift. How redshift z = Δλ/λ is converted to recession speed v for velocities near c. 3 K Microwave Background. The faint glow from the entire sky (black body T = 2. 728 K) attributed to the recombination era following the Big Bang. Fred Hoyle’s derogative term for the supposed origin of the universe in an explosive fireball 14 billion years ago.
Astronomical Terminology (continued) Homogeneity. A term describing the similar appearance of the universe in all directions for all observers. Isotropy. A term describing how the universe appears to be roughly the same no matter in which direction one looks. Distance Ladder. A term describing the various methods by which astronomers determine distances to objects in space, beginning with the closest and ending with the most distant. Scale Factor. The constant of proportionality describing the expansion of the universe, namely the separation of galaxies in the past in terms of their present separations. Light Element Production. A model of the early universe describing the production of various isotopes of hydrogen (1 H and 2 H, deuterium), helium (3 He and 4 He), and lithium (7 Li) in the Big Bang.
Sample Questions 13. What are peculiar velocities, and how do they affect our ability to measure H 0?
Answer. Peculiar velocities are speeds that galaxies exhibit in addition to those expected from the general expansion of the universe. They result from the gravitational attraction of galaxies to each other over large scales, and need to be taken into account when determining how a galaxy is moving relative to us in the absence of local gravitational effects.
21. What is the origin of the cosmic background radiation (CBR)?
Answer. It is the leftover energy from the early universe. At early times the universe is assumed to have been very hot, but a few hundred thousand years after the Big Bang the fireball had cooled considerably, although still at high temperatures. When the fireball had cooled to T ≈ 3000 K it became transparent to energy. The thermal energy of the hot universe then escaped into space as black body radiation and is seen now as the highly-redshifted light from that early epoch.
Sun: March 9, 2011 from Atrium
Chapter 19 Galaxies Now that the grand nature of the universe has been described, Chapter 19 steps backwards to look into the nature of individual galaxies and their environs. 1. The main galaxy types are described, pointing out how they differ in terms of the relative frequency of old and young stars, and interstellar gas, within them. 2. Imaging of galaxies and galaxy clusters reveals that it is a “violent” universe. Evidence for collisions between galaxies is everywhere, although keep in mind that by “collisions” we are talking about events that take place over billions of years, not mere seconds or minutes.
The Hubble Sequence: The familiar “tuning fork” diagram developed by Edwin Hubble is an attempt to link the main galaxy types of elliptical (E), spiral (S), barred spiral (SB), and irregular (Ir) classes. The lenticular galaxies (S 0, SB 0), added later, were a supposed link between spheroidal E galaxies and flattened S and SB galaxies, but unfortunately the diagram was also pictured as an evolutionary sequence. Thus, elliptical galaxies are often referred to as “earlytype” galaxies, much like “early-type” OB stars.
Elliptical galaxies contain old low-mass stars/no gas or dust and are denoted E 0, = circular to E 6 = elongated. Sample: IC 4296, E 0, NGC 777, E 1, NGC 1549, E 2, NGC 4365, E 3, NGC 4564, E 6, NGC 4623, E 7. Some are actually lenticulars, S 0.
Ellipticals are not all the same shape galaxy seen at various angles of projection. Many seem to be oblate (top) or prolate (bottom) spheroids viewed at various angles.
Early examples of lenticular = lens-like galaxies. List: NGC 3245, S 0, NGC 4251, S 0, NGC 4179, S 0: , NGC 5422, S 0: , NGC 3203, S 0: , NGC 4429, S 0/Sa.
Lenticular galaxies get their name because they are “lenslike, ” but are more like spiral and barred spiral galaxies in possessing a flattened disk, rather than like elliptical galaxies which mostly possess an ellipsoidal symmetry. The distinguishing feature of lenticulars relative to spiral galaxies is that they do not have spiral arms or dust. For example, lenticular galaxies seen edge-on do not have dust lanes. van den Bergh suggested a possible origin for lenticular galaxies (S 0 s) via collisions between spirals. That results in the dust and gas being swept out of the galaxies by ram pressure. Because they have been swept clean of material for making new stars, lenticular galaxies contain only old stars, like elliptical galaxies, and lack the distinguishing features of spirals. The fact that most lenticulars are found in rich clusters of galaxies supports the idea.
Hubble Atlas examples of “early-type” spiral galaxies. NGC 3269, Sa, NGC 7096, Sa, NGC 1350, Sa, NGC 1371, Sa, NGC 488, Sab, NGC 2460, Sab.
Hubble Atlas examples of “late-type” spiral galaxies. NGC 1566, Sbc, NGC 5247, Sc, NGC 2997, Sc, NGC 3184, Sc, NGC 3938, Sc, NGC 5055, Sbc.
The effect of inclination to the line of sight on the appearance of spiral galaxies. Note how dust lanes show up for edge-on spirals.
How to get trailing spiral arms from any elongated structure in a disk-dominated galaxy: differential rotation in the disk naturally stretches such features into spiral arms. Note that 2 -armed spirals appear to be most common.
The rotation of stars in the disks of spiral galaxies is expected to follow standard orbital speeds for gravitational influences, namely declining speeds with distance from the galactic centre, but all spirals display “flat” rotation curves instead.
Spiral galaxies are sometimes classified on the basis of the length of the spiral arms and their degree of “tightness. ” However, a more universal criterion is the relative size of the central bulge, which is always largest in the Sa galaxies and smallest at Sc. van den Bergh suggested using disk to bulge ratio, D/B, as a good indicator, with Sa galaxies characterized by D/B ≤ 3, Sb galaxies by 3 ≤ D/B ≤ 10, and Sc galaxies by D/B ≥ 10. Certainly, the dimensions of the bulge are the important characteristic of spiral galaxies, and bulges containing old low-mass stars account for much of their mass. The length of the spiral arms, where young stars and gas/dust are found, is another feature that appears to depend upon the dimensions of the disk. Again, van den Bergh suggests that this characteristic can be used as a luminosity indicator for spirals. See van den Bergh 1960, Ap. J, 131, 215 & 558.
Early examples of barred lenticular galaxies. Here a central bar of old stars replaces the central bulge. NGC 3384, SB 0: , NGC 5473, SB 0: , NGC 1574, SB 0, NGC 4340, RSB 0, NGC 2859, RSB 0, NGC 3945, RSB 0.
van den Bergh (1960) developed a luminosity classification scheme for galaxies using members of clusters of galaxies, a scheme that distinguishes galaxies in the same fashion as stars: i. e. , I, III, IV, V, corresponding to supergiant galaxies, bright giant galaxies, subgiant galaxies, and dwarf galaxies. van den Bergh applied the scheme to late-type spirals and barred spirals, as well as irregular galaxies, but could not apply it to elliptical galaxies. The types applying to well-known objects: M 31 (Sb I-II), LMC (SBm III), SMC (Im IV-V), M 33 (Sc II-III), are listed in the Observer’s Handbook. The Milky Way is a supergiant galaxy by this criterion.
Some of van den Bergh’s classifications for Sc and SBb galaxies.
The Large Magellanic Cloud (SBm III = giant barred spiral) from UK Schmidt plates. An irregular galaxy that is an incipient barred spiral in the making?
The Small Magellanic Cloud (Im IV-V = irregular dwarf) from UK Schmidt plates. An “inverse C” shape.
The Andromeda Galaxy NGC 224 (M 31, Sb I-II = supergiant spiral with large bulge). The companions are NGC 205 (M 110, S 0/E 5 pec) and NGC 221 (M 32, E 2). M 32 M 110
The Triangulum Galaxy NGC 598 (M 33, Sc II-III = giant spiral with small bulge). Note the small bulge and restricted length of the spiral arms.
The Sculptor dwarf spheroidal galaxy (d. E) contains only old low-mass stars and no gas or dust.
The Leo II dwarf spheroidal galaxy (d. E or d. Sph).
van den Bergh’s classification scheme for galaxies (1976).
An alternate schematic for van den Bergh’s scheme linking the a, b, c types to Disk/Bulge ratio.
NGC 4921 in the Coma cluster is an example of what van den Bergh refers to as an anemic spiral galaxy, since it is depleted in young high-mass stars, i. e. “anemic” looking.
Luminosity Differences Among E Galaxies. The luminosity differences between elliptical galaxies is tied to overall dimensions: c. D galaxies. Huge elliptical galaxies dominating some clusters of galaxies. “c. D” stands for “cluster dominating” galaxy. Some are incredibly large, massive, and luminous. Normal ellipticals. Standard E galaxies comparable in luminosity to supergiant spiral galaxies. Dwarf ellipticals, d. E. Lower luminosity elliptical galaxies comparable in absolute magnitude to giant and subgiant spiral galaxies. Dwarf spheroidal galaxies, d. Sph. Very low luminosity elliptical galaxies, like rich globular clusters, found in nearby regions of the Local Group. Blue compact dwarf galaxies, BCD. Compact elliptical galaxies that contain lots of gas and massive blue stars.
Gas and Dust Properties of Galaxies. Gas and dust content increases towards “later-type” galaxies. Likewise, the content of young stars also increases monotonically towards “later” types of galaxies. The exceptions are interesting objects in their own right.
Hickson Compact Group 87. How would you classify the galaxies?
Examples of interactions between galaxies.
Evidence for Interactions of Galaxies: The centre of the Coma cluster of galaxies, a rich cluster.
The distribution of elliptical galaxies (filled circles) in the Coma cluster relative to spirals (open circles) peaks towards the centre of the cluster, i. e. galaxy collisions produce elliptical, lenticular, or anemic spiral galaxies.
The Coma cluster of galaxies as viewed in X-rays, i. e. gas has been swept out of the galaxies through collisions.
The lower density Hercules cluster, on the other hand, appears to be more heavily populated by spiral galaxies in its central regions, i. e. few collisions.
The Hercules cluster of galaxies, in X-rays, has less gas.
The Whirlpool Galaxy (M 51) and its companion (M 52).
The Whirlpool Galaxy and its companion modeled by Toomre & Toomre (1972) as a collision between galaxies.
The Antennae (NGC 4038/39), optical image.
The Antennae as modeled by Toomre & Toomre (1972) as a collision between two galaxies.
The ring galaxy II Hz 4, optical images.
The ring galaxy II Hz 4 modeled by Lynds & Toomre (1976) as a head-on collision between galaxies.
The polar ring galaxy NGC 4650 A. Is it a collision in progress between two galaxies?
Centaurus A. Dust lanes do not belong in ellipticals.
Starburst Galaxies. These are a group of strongly interacting galaxies that are bluer in colour than isolated galaxies, presumably because of the presence of recently-created hot young stars. It is believed that a tidal interaction with another galaxy has induced star formation, although the resulting excess luminosity is hidden behind obscuring clouds of gas and dust. Such galaxies are bright at infrared wavelengths, however. Although starburst activity was initially discovered in galaxy nuclei, some spiral galaxies also exhibit disk-wide starburst activity. The star formation is assumed to have been induced by shock waves generated by a gravitational interaction. Starburst galaxies often exhibit strong X-ray emission. Does it originate from gas falling into a deep potential well at the centre of the galaxy, perhaps a “black hole”?
The starburst galaxy M 82, which interacts with M 81. Star formation appears to have been induced in M 82 as a result of its near encounter with M 81. The gas and dust clouds in the galaxy must have been induced to contract and form stars by the gravitational interaction with M 81.
The rich galaxy cluster Abell 2199 and the multiple nucleus (cannibalistic? ) c. D galaxy near its centre.
The curious elliptical galaxy NGC 3923 and the multiple concentric rings (left, gas? ) that surround it.
The butterfly galaxy NGC 6240 as viewed by the Hubble Space Telescope (left) and by the Chandra Orbiting XRay Observatory (right). What are the multiple strong sources of X-rays near the galaxy’s centre? How were the surrounding streams of gas produced?
There is an entire class of galaxies that appears to have something peculiar about their nuclei. Some are called Seyfert galaxies, after their discoverer, others are referred to as AGN = Active Galactic Nuclei, others still display oppositely-directed radio jets. Quasars are considered to be extreme examples of the phenomenon: star-like objects with very large redshifts representing distant galaxies with their jets directed towards us, so that the light from the object is dominated by material in the jet. Yet even nearby galaxies, including our own Milky Way, display peculiarities. Most massive galaxies appear to contain a supermassive “black hole” at their centre, a place where hundreds of thousands to millions of solar masses (M ) of matter is squeezed into a volume of space only a few parsecs or light years across.
Examples of (left) quasars = quasi-stellar radio sources (i. e. , lots of radio noise) and (right) QSOs = quasi-stellar objects (very little radio noise, if any). Double QSO 0957+561
Many radio galaxies have jets of high-speed gas ejected symmetrically about the centre of the galaxy, well away from the optical galaxy. Many such galaxies are referred to as having active galactic nuclei, and are termed AGN galaxies.
Apparent motion of some galactic jets at speeds exceeding the speed of light are projection effects only. The jets also have motion in the line of sight that produces such an anomaly.
Can you now see the evidence for galaxy collisions?
Astronomical Terminology Elliptical galaxy (E). A spheroidal galaxy containing millions to billions of old low-mass stars and no gas or dust. Spiral Galaxy (S). A galaxy with a spheroidal bulge of several million old low-mass stars and a flattened pancake-like disk of billions of old low-mass and young high-mass stars, along with gas or dust, dominated by two (or more) spiral arms. Irregular galaxy (Ir). A galaxy containing millions to billions of young and old high-mass and low-mass stars and lots of gas and dust. Lenticular galaxy (S 0). A disk galaxy of billions of old low-mass stars and no gas or dust with the appearance of a lens when viewed edge-on. Barred spiral galaxy (SB). A spiral galaxy where the central bulge is an elongated bar structure, from the ends of which the spiral arms originate.
Astronomical Terminology (continued) Anemic Spiral galaxy (A). A spiral galaxy with anemiclooking spiral arms, as if much of the gas and dust in the disk used to create new stars has been swept out of the galaxy. Ring galaxy. An unusual galaxy with a ring-like appearance that appears to be the dynamical consequence of a head-on collision between two normal galaxies. Tidal tails. Elongated streamers of stars and gas from normal galaxies that appear to have been generated through gravitational encounters between galaxies. Starburst galaxy. A galaxy that is dominated by lots of recently-formed young blue stars. Rich galaxy cluster. A cluster of thousands of galaxies dominated by ellipticals (E) and lenticular (S 0) galaxies, i. e. galaxies devoid of interstellar matter.
Astronomical Terminology (continued) Quasar. A star-like object superposed on a distant galaxy, discovered by its strong radio emission, blue colour, and high redshift emission lines. QSO = quasi-stellar object. A quasar, i. e. high redshift star-like galaxy of blue colour, lacking detectable radio emission. Galaxy jets. Streams of oppositely directed high-speed gas from active galaxies ejected from the accretion disks surrounding supermassive black holes at their centres. Supermassive black hole. The term used to describe the central regions of most large galaxies, where millions of solar masses of matter occupy a very small volume only a few parsecs across. Superluminal motion. A term used to describe the apparent outwards motion of matter in galaxy jets in excess of the speed of light.
Sample Questions 8. Some galaxies have regions that are relatively blue in colour, while other regions appear redder. Aside from colour, what can you say about the differences between these regions?
Answer. The luminosity of the blue regions is dominated by young blue stars, which implies that they are regions of active star formation that must contain significant amounts of gas and dust. The luminosity of the red regions, on the other hand, is dominated by cool red giant stars, which implies that they are regions of old stars lacking active star formation, although gas and dust may or may not be present.
20. The nearest quasar is almost a billion light years distant according to its redshift. Why do we not see any closer quasars?
Answer. If their redshifts are representative of Hubble flow in the universe, then quasars must be associated with the early stages of galaxy formation. Since far-away galaxies represent an earlier epoch in the universe than nearby galaxies, we need to look at very distant galaxies to find objects representing earlier stages of galaxy evolution.