CH 2 RISK RETURN Copyright 2003 Pearson Education


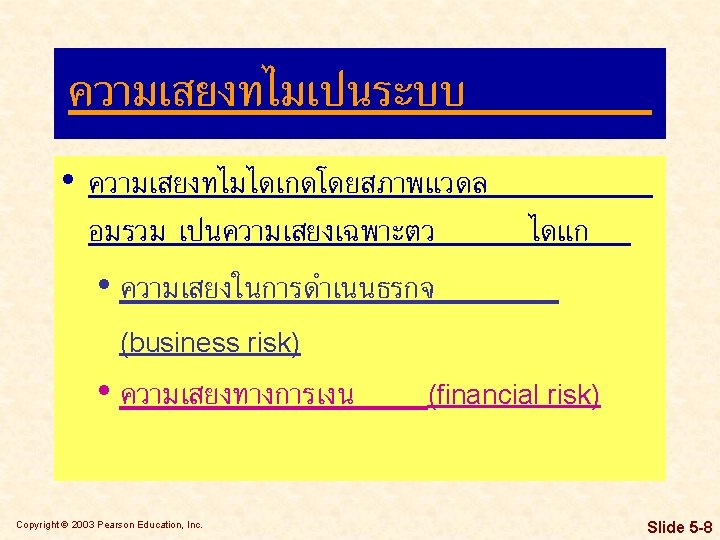
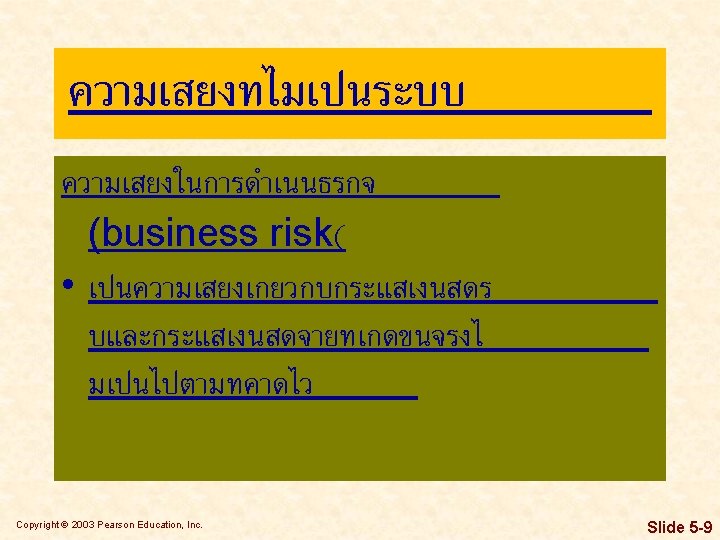
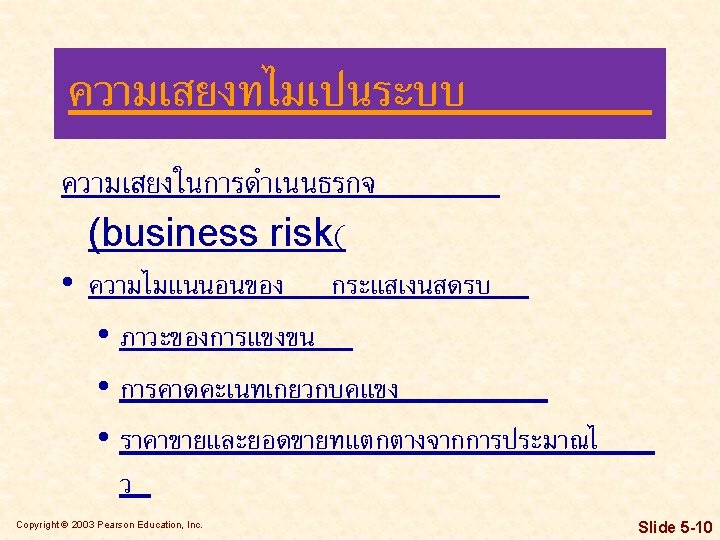
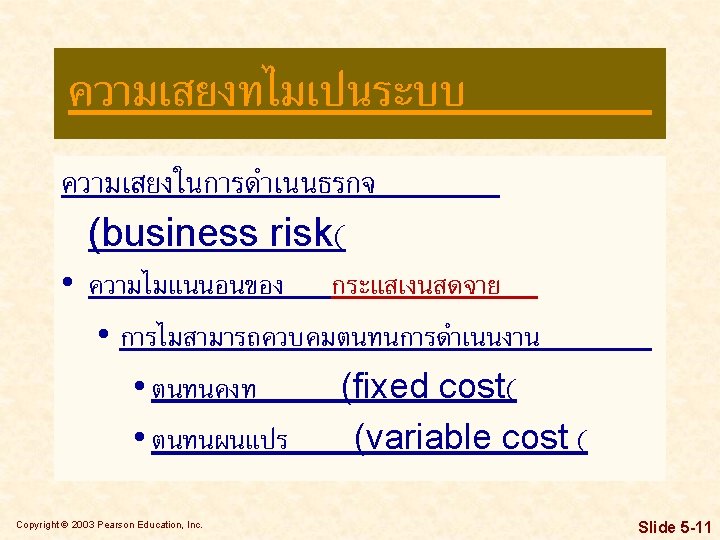
 • ความเสยงทไมเปนระบบ (unsystematic")


 and")
- Slides: 34
CH. 2 RISK & RETURN Copyright © 2003 Pearson Education, Inc. Slide 5 -0
Learning Goals 1. Understand the meaning and fundamentals of risk, return, and risk aversion. 2. Describe procedures for assessing and measuring the risk of a single asset. 3. Discuss the measurement of return and standard deviation. Copyright © 2003 Pearson Education, Inc. Slide 5 -1
Risk and Return Fundamentals • If everyone knew ahead of time how much a stock would sell for some time in the future, investing would be simple endeavor. • Unfortunately, it is difficult -- if not impossible -- to make such predictions with any degree of certainty. • As a result, investors often use history as a basis for predicting the future. • We will begin this chapter by evaluating the risk and return characteristics of individual assets, and end by looking at portfolios of assets. Copyright © 2003 Pearson Education, Inc. Slide 5 -2
Risk Defined • In the context of business and finance, risk is defined as the chance of suffering a financial loss. • Assets (real or financial) which have a greater chance of loss are considered more risky than those with a lower chance of loss. • Risk may be used interchangeably with the term uncertainty to refer to the variability of returns associated with a given asset. • Other sources of risk are listed on the following slide. Copyright © 2003 Pearson Education, Inc. Slide 5 -3
Table 2. 1 Copyright © 2003 Pearson Education, Inc. Slide 5 -4
ประเภทของความเสยง • ความเสยงทเปนระบบ (systematic risk, undiversifiable risk, market risk, macro risk) • ความเสยงทไมเปนระบบ (unsystematic risk, diversifiable risk, specific risk, micro risk) ความเสยงทงสองประเภทตางกนอยางไร Copyright © 2003 Pearson Education, Inc. ? ? ? Slide 5 -7
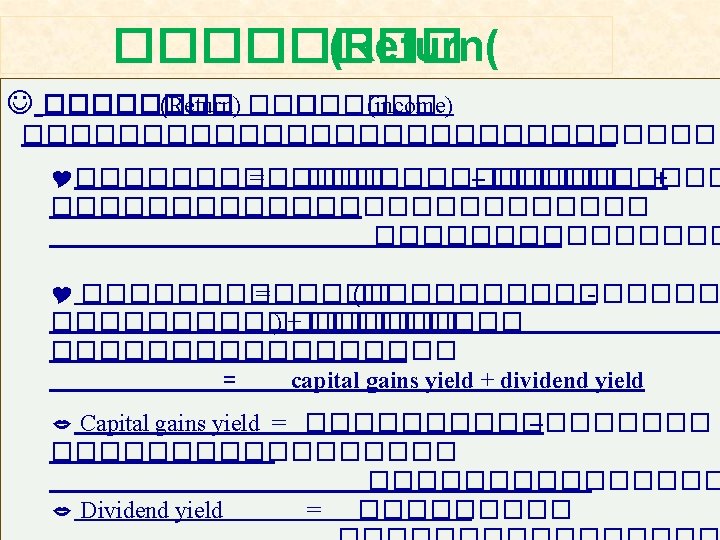
Return Defined • Return represents the total gain or loss on an investment. • The most basic way to calculate return is as follows: kt = Pt - Pt-1 + Ct Pt-1 • Where kt is the actual, required or expected return during period t, Pt is the current price, Pt-1 is the price during the previous time period, and Ct is any cash flow accruing from the investment Copyright © 2003 Pearson Education, Inc. Slide 5 -19
Return Defined Table 2. 2 Copyright © 2003 Pearson Education, Inc. Slide 5 -20
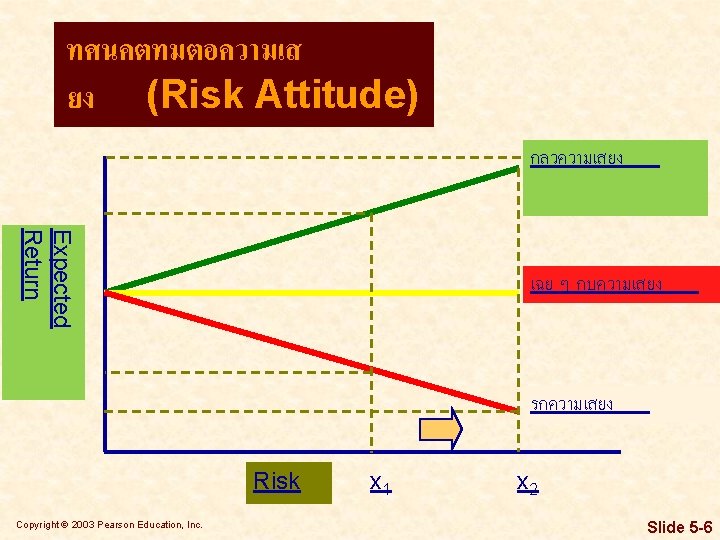
Risk Preferences Copyright © 2003 Pearson Education, Inc. Slide 5 -21
Example Norman Company, a custom golf equipment manufacturer, wants to choose the better of two investments, A and B. Each requires an initial outlay of $10, 000 and each has a most likely annual rate of return of 15%. Management has made pessimistic and optimistic estimates of the returns associated with each. The three estimates for each assets, along with its range, is given in Table 2. 3 Asset A appears to be less risky than asset B. The risk averse decision maker would prefer asset A over asset B, because A offers the same most likely return with a lower range (risk). Copyright © 2003 Pearson Education, Inc. Slide 5 -22
Example Copyright © 2003 Pearson Education, Inc. Slide 5 -23
Example Discrete Probability Distributions Copyright © 2003 Pearson Education, Inc. Slide 5 -24
Example Continuous Probability Distributions Copyright © 2003 Pearson Education, Inc. Slide 5 -25
Risk Measurement Standard Deviation • The most common statistical indicator of an asset’s risk is the standard deviation, σk, which measures the dispersion around the expected value. • The expected value of a return, k-bar, is the most likely return of an asset. Copyright © 2003 Pearson Education, Inc. Slide 5 -26
Risk Measurement Standard Deviation Copyright © 2003 Pearson Education, Inc. Slide 5 -27
Risk Measurement Standard Deviation • The expression for the standard deviation of returns, σk, is given in Equation 5. 3 below. Copyright © 2003 Pearson Education, Inc. Slide 5 -28
Risk Measurement Standard Deviation Copyright © 2003 Pearson Education, Inc. Slide 5 -29
Risk Measurement Standard Deviation Copyright © 2003 Pearson Education, Inc. Slide 5 -30
Risk Measurement Standard Deviation Copyright © 2003 Pearson Education, Inc. Slide 5 -31
Risk Measurement Coefficient of Variation • The coefficient of variation, CV, is a measure of relative dispersion that is useful in comparing risks of assets with differing expected returns. • Equation 5. 4 gives the expression of the coefficient of variation. Copyright © 2003 Pearson Education, Inc. Slide 5 -32
Risk Measurement Coefficient of Variation When the standard deviation (from Table 5. 5) and the expected returns (from Table 5. 4) are substituted into Equation 5. 4, the coefficients of variation may be calculated resulting in the values below. Copyright © 2003 Pearson Education, Inc. Slide 5 -33