Cash Management Prof T Joseph Definition Cash management


 �")

 It is also known as re-order point.")


*300=")
) = 264600")


- Slides: 57
Cash Management Prof. T. Joseph
Definition Cash management is basically concerned with handling cash. Management of cash and marketable securities both terms for holding cash.
Motives Transactions motive: To meet routine transactions claiming not perfectly match. The major part of such is liquid from and marketable securities which is maturity conforms at the time of un expected terms such as tax and dividends. Precautionary Motive: Cash Balance held to take advantage of potential profit making situation which is outside the named course of business. Example: Purchase of raw materials at a reduced price on payment of ready cash or buying securities when interest rates are set to decline.
Compensatory Motive: Holding bank balance to compensate banks for providing certain sources in order to avail convenience of the correct asset. Minimum bank balance must be maintained by the firm and this provides the compensating motive for holding cash.
CASH BUDGETING In the statement projecting cash inflows and outflows of the firm over various internal periods of the budget period. For each period (one month, quarterly or half yearly) there is opening balance and expected inflow and expected outflow during the period and closing balance at the end of the period. Objectives: To provide cash needed to meet the obligation of the firm. To minimize ideal cash held by the firm.
v Keeping large amounts of cash prevents insolvency, improves credit worthiness enables taking advantage of cash discount and favorable business opportunities. v However large cash balance involves an opportunity cost and also may lead to meet payments. The finance manager can structure a balance between holding too much cash high liquidity and holding too little cash. v In other words, a need for balance to maintain optimum cash balance.
Merits It helps to identify cash surplus or deficiency at the end of the period. Helps to arrange needed funds on the most favorable terms in advance and prevent accumulation of cash. Enables a firm which has excess cash to take advantage of cash discount on its payable to party already to formulate dividend policy to plan financing of capital expenditure.
Cash Management Strategies Broad cash management strategy is related to in cash turnover process by which turn it is determined the cash cycle. Cash cycle refers to the process by which cash is used to purchase materials from which goods are produced and sold to customer to later pay the bills. The firm received cash from customers the cycle repeats itself. Cash management strategies are designed to reduce the cash balance and thereby interest cost, such strategies are Structuring accounts payable Speeding of receivables collection.
Speeding of Receivables collections There is a time lag from the time the cheque is return in favor of the firm and mainly at the time. The funds are credited by the bankers. This time lag comprises of: Transit of mailing time Processing time and Collection time. These three periods should be reduced that the company wants to speed up collection. The techniques which can be adopting are concentration banking lock box system
Concentration Banking Instead of all the payments being sent by customers to the Head office of the firm specified collection centres are opened in areas where the billing is substantial, customers in and around that area and directly send the cheques to direct collection centres. These cheques after many process at the collection centre are deposited in a bank account opening of the firm’s name at that centre. Funds beyond predetermined minimum amount are transferred from the bank to the central bank account of the firm from where the firm makes all its payments. This method reduces the mailing time and collection time.
Lock Box system The firm hires the post box number and important collection centres. The customers are required to send cheques to the PB Number and the banker will collect the cheques post box. The local firm arranges to collect and deposit the cheques in the firms account. Periodic statements of amount collected are sent to the firms (head office) This system eliminates processing time and also saves mailing time, as the cheques are directly picked up by the bank and not delivered by post office to the collection centre and from the collection center to the Bank. However the above two methods involves the cost – cost to the P. B. compensation to the banking services. The introduction of these techniques will reduce the funds locked in Debtors, thereby certain savings in interest. This system should be adopted only if the savings exceed the additional cost.
Storing disposal of payments The operational cash requirement will be reduced by slowing down on the payment of accounts payable basically creditors. The techniques are: Avoidance of early payments Centralized payments Accruals or outstandings.
Avoidance of early payments It takes full advantage of the credit period. However, payment should not be late beyond the due date. Since the credit standing of the firm will be affected. Centralised payments All payments must be made by the head office to the centralized deposal account. This increases the transit and collection time of the cheque issued and also reduces the operating cash required (lot of Bank account s means more cash to be maintained as minimum balance) Accurals or outstandings These are current liabilities represent the of goods received by the firm but not yet paid for. For example employees salaries are paid in advance payments are made later. The longer the period after which the payments are made the greater he amount of full financing and smaller the amount of cash balance required. For example wages paid monthly reduces cash that wages are paid daily.
Marketable Securities Cash in excess of optimum balance is invested in marketable securities. Such securities should be easily marketable and safe. At the same some return should be available. Example , such investments are Treasury Bills, inter company deposits , UTI units etc. ,
PROBLEMS
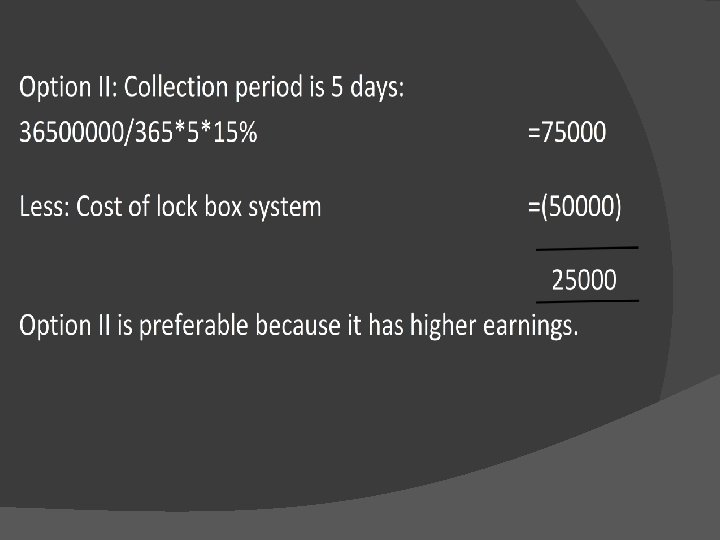
Problem 1: A Limited company believes a lock Box system can be started which reduces Debtors collection period by 3 days. Credit sales are estimated that Rs. 3, 65, 000 annum. The firm’s cost of capital is 15%. The cost of this lock box system is RS. 50, 000 per annum. Should the company introduce the lock box system what would your advice if the collection period is reduced by 5 days.
Solution:
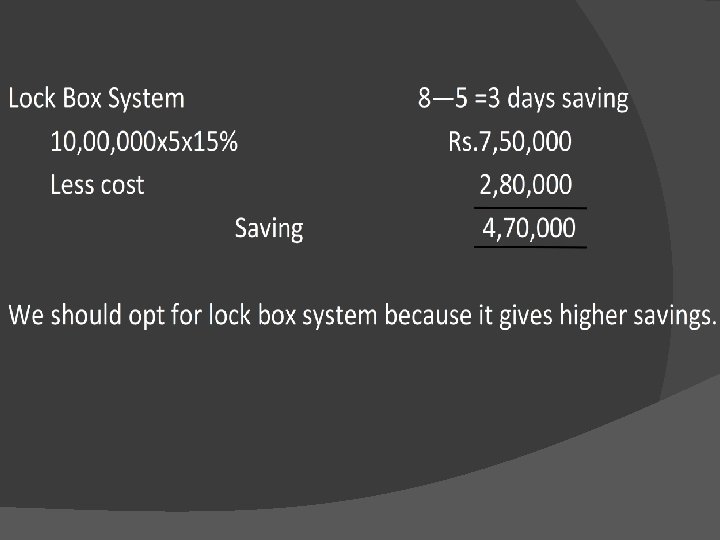
Problem 2: A firm contemplating introducing concentration banking to reduce its collection period from existing 8 days to 5 days. The daily cheques received currently average of Rs. 10, 000. The concentration banking system would cost Rs. 1. 50, 000 per annum and the cost of funds is 15% � Should the company go for concentration banking If the company introduces lock box system the cost is Rs. 2, 80, 000 and reduces the collection time to three days. Would you advice concentration banking or lock box. �
Solution: � Option I:
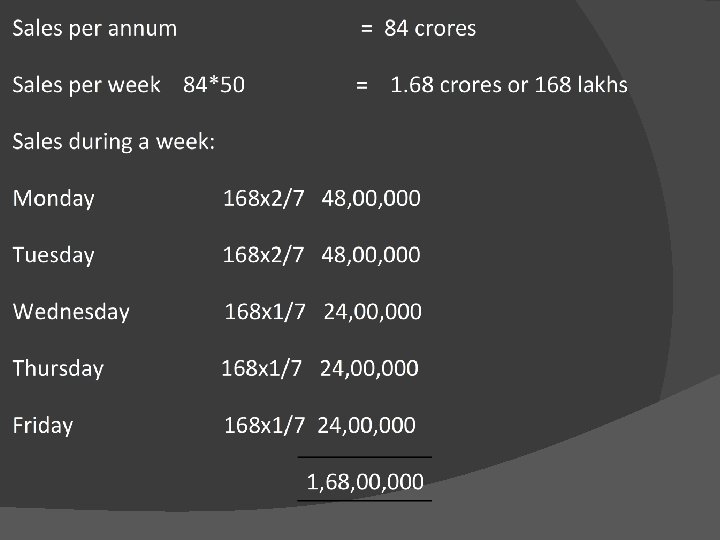
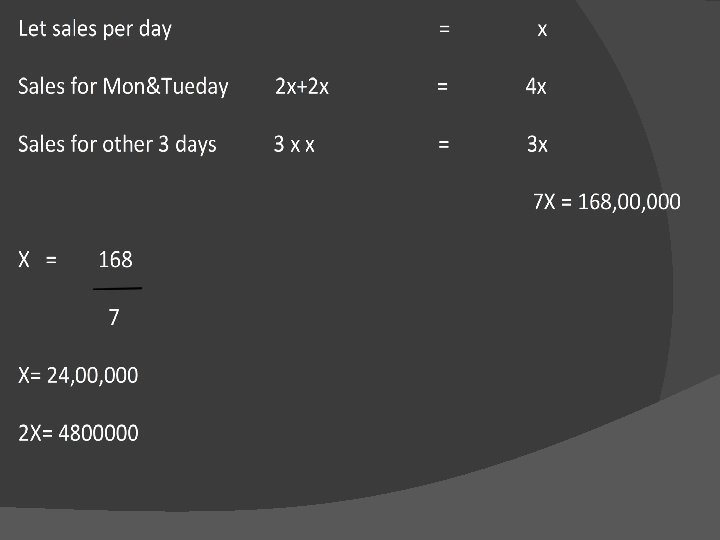
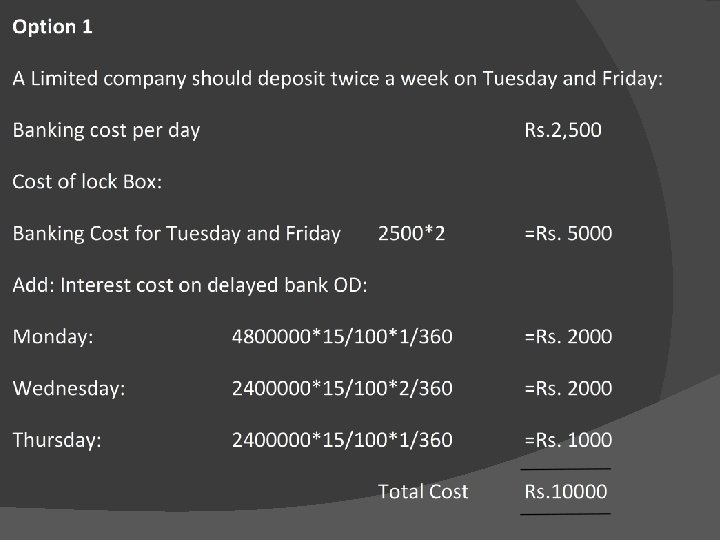
Problem 3 A Ltd company has an annual turnover of Rs. 84 crores. The sales is spread evenly over 50 weeks of the year. However the receipts on Monday and Tuesday is twice that of each of the other 3 days of the week. The cost of banking per day is Rs. 2, 500. It is suggested to be deposited twice a week on Tuesday and Friday as compared to the current practice of banking only on Friday. � A Ltd company has a Bank OD on 15% p. a. Interest being charged on a daily basis. � Advise a Ltd Company the best course of Banking assuming 360 days a year. �
The company should choose option I because the cost is lower than in option II.
Inventory = Raw materials + WIP +Finished goods
Objectives of Inventory Management To minimize investment in inventory. That is to have an optimum inventory level. � To meet demand for the product for effectively organizing production and sales operations. � These are conflicting objectives. It can be expressed in terms of the cost benefits of holding inventory small level of inventory is lowering the cost or larger inventory facilitates smooth Production and regular sales. The optimum level of inventory will be determined on the basis. -Of terms offered the cost and benefits involved and associated with the levels of inventory. �
Cost of holding Inventory Basically there are two types of costs: � Ordering Costs: Such costs are cost of preparing the purchase order , receiving and inspecting the goods received and recording the goods received in the store records. The larger the number of orders placed increases the costs. � Carrying costs: It involves loss of interest and funds locked up in the inventory. The cost of ordering and carrying costs represents the total cost of the inventory.
Benefits of Holding Inventory: Finished Stock : Finished stock serves the gap between current production and actual sales. Finished goods inventory helps the firm to improve the sales and production function. In case of firms with seasonal demand it will have the necessary stcks throughout the ear. � Work-in-progress: Work-in-progress arises because of the time lag involved in the production process. The longer the time involved in production process the larger the WIP stock and vice versa. � Raw Material: Raw material are required in stock to help. Since it is a time consuming process of ordering and receiving the materials . Raw materials stock ensures uninterrupted production . Materials of such stocks enables a firm to re-compete its purchasing and production activities. �
Techniques of Inventory Management ABC Analysis: This technique is based on the assumption that firms shold not exercise the same degree of control over all items of inventory. According to this system items are classified in three groups. � Group A : It consists of costly items which quantity may be very small – control should be vigorous and intensive. � Group B : Items are less value from A but more value than C – less attention in a and more attention in C � Group C : It consists of cheap items whose quantity is large –minimum control is required. �
A classification of inventory based on the above would be approximately as follows:
Economic Order Quantity (EOQ) �
Assumption of EOQ � 1. The total annual usuage is known with certainity and the useage is evenly spread throughout the year. � 2. cost per order is constant nad the carrying cost percentage is also fixed. � 3. Price per unit of the product remains the same irrespective of the quantity. � 4. Orders placed to replace the stock reach the godown exactly at the point when the existing stock level reaches zero.
Re-Order Level: ( When time is fixed) It is also known as re-order point. It tells us when orders are to be replenish the current stock. In the lead time and consumption rate of material. Once know for certain the re-order level will be = � ROL = Lead time(in days)x Average consumption. OR Where the lead time and daily consumption are not certain the re-order point should be fixed as follows: � (Lead time (delivery time)x. Normal consumption) + safety stock �
The quantum of safety stock to be kept depends upon the two costs which such stock involves � Stock out cost (in this the opportunity cost comprises of loss of profits , loss of sales loss of good will production stoppage and certain idle time cost) � Carrying cost (cost of holding stock) � These two costs are conflicted the larger the quantity of safety stock will lesser the stock out costs and the higher in the carrying costs and vice versa. In fixing the level of safety stock the Finance Manager should attempt the trade off between the stock out cost and carrying cost. � The safety stock will be fixed at that level where the total cost of carrying and stock out is the least. �
Problems
Problem 1
Solution �
Problem 2 Annual requirements = 10000 units Cost per unit = Rs 5 Ordering Cost = Rs 100 per order Rent, insurance, etc. per unit per annum Rs. . Return on Investment= 20%. Calculate EOQ.
Solution �
Problem 3 A Ltd. required 90000 units of a certain item annually. The cost per unit is Rs. 3, ordering cost is Rs. 300 per order and carrying cost Rs. 6, per year. i. iii. EOQ How many orders are placed in a year? What should the firm do if the supplier offer the following discounts: ORDERS x Discount 4500 – 5999 2% 6000 and above 3%
Solution �
Total Cost if EOQ is ordered: Rs. �Purchase cost= 90000*3 = 270000 �Ordering Cost=(90000/3000)*300= 9000 �Carrying Cost =(3000/2)*6 = 9000 �Total Cost = 288000
Total Cost when 4500 units are ordered: �Purchase Cost = 90000*(3 -(3*2%)) = 264600 �Ordering Cost = (90000/4500)*300 = 6000 �Carrying Cost = (4500/2) * 6 = 13500 �Total Cost = 284100
Total Cost when 6000 units are ordered: �Purchase Cost �Ordering Cost �Carrying Cost = 90000*(3 -(3*3%)) = (90000/6000)*300 = (6000/2) * 6 = 261900 = 4500 = 18000 Total Cost = 284400
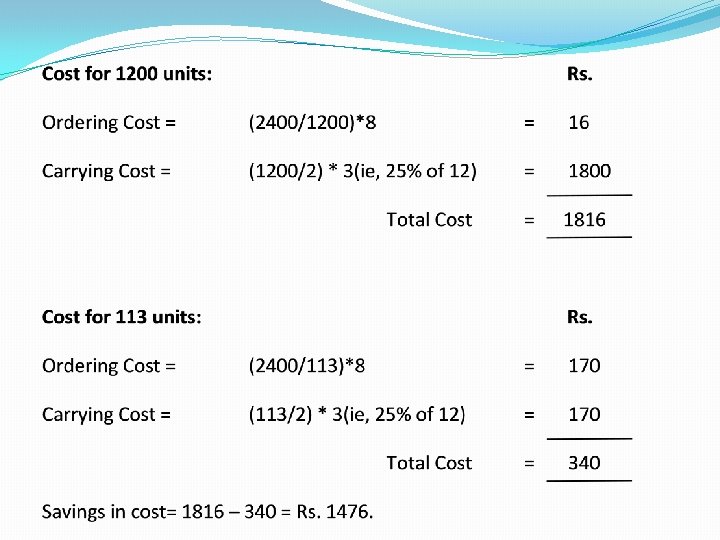
Problem 4 �A Ltd. Has been buying items in lots of 1200 units quantity units which is 6 months requirements. Cost per unit is Rs. 12, ordering cost Rs 8 per order and carrying cost is 25%. �Calculate the savings per year by buying in economic lot quantity.
Solution �
Problem 5 A firm has 5 different items in its inventory. Suggest an ABC classification of these items. Item No. Average No. of Units in Stock Average Cost per unit 1 20000 60 2 10000 100 3 32000 11 4 28000 10 5 60000 3. 4
Solution Item No. Units Total Cost % of Total Cost 1200000 39. 53% Classifi cation 20000 % of Unit units to cost Total 13. 33% 60 1 2 10000 6. 67% 1000000 32. 94% A 3 32000 21. 33% 11 352000 11. 59% B 4 28000 18. 67% 10 280000 9. 22% B 5 60000 40% 3. 4 204000 6. 72% C 100% - 3036000 100% - TOTAL 150000 A
Conclusion �Group A: Consists of items 1 and 2 which is 20% of total quantity and 72. 47% of total value. �Group B: Consists of items 1 and 2 which is 40% of total quantity and 20. 81% of total value. �Group C: Consists of items 1 and 2 which is 40% of total quantity and 6. 72% of total value.
Problem 6 �The following data is the details of the annual usage in units and price per unit of 15 items used by a firm.
Item No. 1 2 3 4 5 6 7 8 9 10 11 12 13 14 15 Annual Usage 400 15 6000 750 1200 25 300 450 1500 1300 900 1600 30 45 Price per unit Rs. 20 150 2 18 25 160 2 1 4 20 2 15 7. 5 40 20
Item No. 1 2 3 4 5 6 7 8 9 10 11 12 13 14 Annual Usage Value (Quantity* Price) 8, 000 2, 250 12, 000 13, 500 30, 000 4, 000 600 450 6, 000 26, 000 1, 800 24, 000 4, 500 1, 200 Rank 6 10 5 4 1 9 14 15 7 2 11 3 8 12
Rank Item No. 1 2 3 4 5 6 7 8 9 10 11 12 13 14 15 5 10 12 4 3 1 9 13 6 2 11 14 15 7 8 Annual % to Cumulati Usage Total ve ve % of Annual annual Usage usage 30000 22. 2 26000 19. 23 56000 41. 4 24000 17. 75 80000 59. 2 13500 10 93500 69. 2 12000 8. 8 105500 78 8000 5. 9 113500 83. 9 6000 4. 5 119500 88. 4 4500 3. 3 124000 91. 7 4000 3. 0 128000 94. 7 2250 1. 6 130250 96. 3 1800 1. 4 132050 97. 7 1200 0. 9 133250 98. 6 900 0. 6 134150 99. 2 600 0. 5 134750 99. 7 450 0. 3 135200 100 Cumuati Classificat ve % of ion items 6. 7 13. 3 20 26. 7 33. 3 40 46. 7 43. 3 60 66. 7 73. 3 80 86. 7 93. 3 100 A A B B B C C C C
Thank You.