C 5 Population ecology AHL Essential idea Dynamic
 Essential idea: Dynamic biological processes impact population density and")


")


 – (mortality + emigration)")
 Populations tend to grow in size for the simple")


 3 Phases: 1. Exponential growth Phase 2. Transitional Phase")


 overshoot K N oscillations Time")


- Slides: 72
C. 5 Population ecology (AHL) Essential idea: Dynamic biological processes impact population density and population growth. Fish populations, such as the schooling Anchovies (left) being hunted by the Bluefin Trevally (right) are an excellent example of how dynamic populations are. The process affecting population density here is mortality caused by predation. https: //commons. wikimedia. org/wiki/File: Moofushi_Kandu_fish. jpg
Populations • Groups of organisms of the same species that live within a given area
Population Characteristics We can characterize individual populations in terms of … ØVariation ØPatterns of Dispersion ØDemographics ØSize and Density ØLimits on population growth ØHuman population growth
• Members of a population show similarities because they belong to the same species.
Members of a population also show variation. Most variation falls in a “normal” distribution (bell-shaped frequency). •
Population Characteristics We can characterize individual populations in terms of … ØVariation ØPatterns of Dispersion ØDemographics ØSize and Density ØLimits on population growth ØHuman population growth
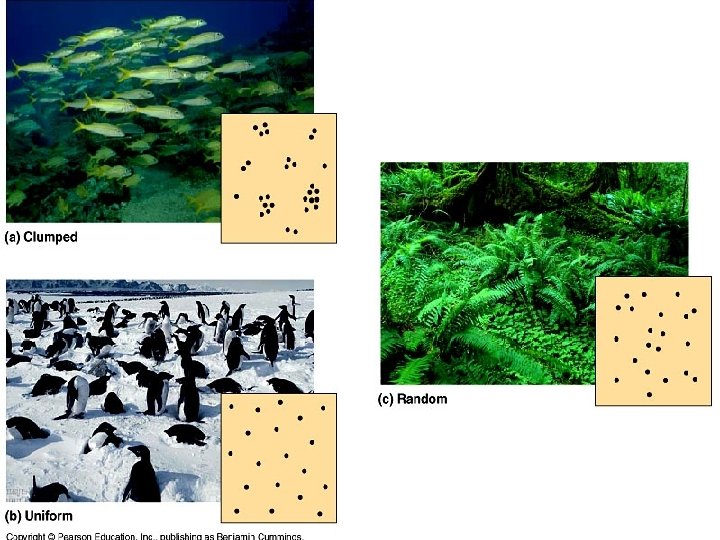
There are three common patterns of population distribution: Uniform
Why Different Types?
Population Characteristics We can characterize individual populations in terms of … ØVariation ØPatterns of Dispersion ØDemographics ØSize and Density ØLimits on population growth ØHuman population growth
Demographics • Characteristics of a population • Examples: – Average size – Average number of offspring • http: //quickfacts. census. gov/qfd/states/53000. html
Population Characteristics We can characterize individual populations in terms of … ØVariation ØPatterns of Dispersion ØDemographics ØSize and Density ØLimits on population growth ØHuman population growth
Four Factors Influence the Size of a Population: • Natality: Birth Rate (offspring produced and added to population)
Mortality: Death Rate (individuals that die)
• Immigration: Movement of members of the species into the area
• Emigration: Movement of members of the species out of area to live elsewhere.
Population Change = (natality + immigration) – (mortality + emigration)
Exponential Curve Unlimited Growth (J-Shaped) Populations tend to grow in size for the simple reason that individuals tend to have more than one offspring.
Can this happen in nature? • Yes: Bacteria – If there are no factors limiting the growth, their number will increase rapidly.
Exponential growth of bacteria
Can this happen in nature? • Yes: Invasive species Rabbits in Australia – Uniform habitat – No predators – No disease – Unlimited area – Abundant food
Crown of thorns starfish
Logistic Curve Limited Growth (S-Shaped) 3 Phases: 1. Exponential growth Phase 2. Transitional Phase 3. Plateau Phase
Exponential Growth Phase • Population increases exponentially. • Resources are abundant. • Predators and disease are rare. •
Transitional Phase • As a result of intra-specific competition – for food, shelter, nesting space, etc. , – and the build up of waste. • The growth rate slows down. – Birth rates decline and death rate increases
Plateau Phase • Natality and mortality are equal so population size is constant. • When the number of individuals in the population have reached the maximum which can be supported by the environment. The number is called the CARRYING CAPACITY
Growth of a population of fur seals
Population size oscillates around the carrying capacity (K) overshoot K N oscillations Time
Population Characteristics We can characterize individual populations in terms of … ØVariation ØPatterns of Dispersion ØDemographics ØSize and Density ØLimits on population growth ØHuman population growth
Limits on Population Growth Water and shelter are critical limiting factors in the desert. • Density Dependent Limits – Food – Water – Shelter – Disease • Density Independent Limits – Natural Disasters – Humans (logging, mining, farming) Fire is an example of a Density independent Limiting factor.
Population Characteristics We can characterize individual populations in terms of … ØVariation ØPatterns of Dispersion ØDemographics ØSize and Density ØLimits on population growth ØHuman population growth
What’s Behind Population Growth • Three Factors – Fertility – Infant Mortality – Longevity • Animal Domestication and Agriculture – Provided for a few to feed many • Industrial Revolution – Growth of Cities and Infrastructure • Water • Energy • Transportation – – Increased Productivity Nutrition Sanitation Medicine
Age structures of three nations Shrinking Growing Stable Are these growing, shrinking or stable populations?
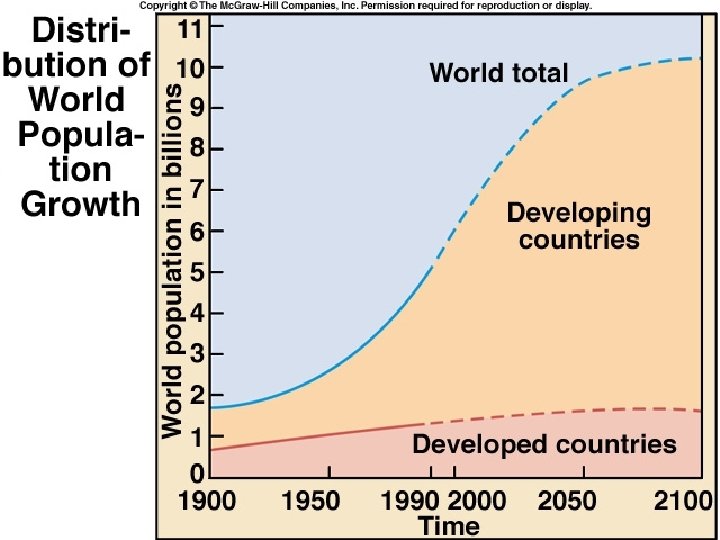
Exponential growth of the human population Human population growth Limited resources eventually will does not currently show cause human population density effects that typically growth to slow, characterize natural populations. but global human carrying capacity is not known.
Population Predictions Most predictions: 9 -12 B by 2050 10 -15 B by 2100 • Large uncertainties
Resource Limits • Land – Deforesting to acquire more arable land – Would run out in next century at current yields • Water – – In 1950 people used half of accessible water Are now dependent on dams Pollution loses 33% of potential water Getting close to limits • Energy – – growth very high last fifty years Mostly hydrocarbon fuels Nonrenewable resource consumption Climate change issues
C. 5. U 2 The exponential growth pattern occurs in an ideal, unlimited environment. Exponential population growth Changes in a population of Paramecium over a six day period Conditions needed in nature: • The population is very small • The organism has just colonised a new environment Use the tutorial link to go learnmore and attempt problem questions For exponential growth to occur it requires an ideal environment: • All individuals survive to reproduce successfully • Resources are unlimited … …therefore there is no competition and no limit to the population J-shaped growth curve http: //www. biology. arizona. edu/biomath/tutorials/App lications/Population. html http: //www. nature. com/scitable/content/ne 0000/ne 0000/13309363/vandermeer_figure 1_ksm. jpg
C. 5. U 2 The exponential growth pattern occurs in an ideal, unlimited environment. Examples of exponential population growth Throughout the 1800's, hunters decimated the American Plains bison populations, and by 1889, only about one thousand bison remained. The US government, along with private landowners, established protected herds in the late 1800's and early 1900's. The herds started small, but with plentiful resources and few predators, they grew quickly. The bison population in northern Yellowstone National Park increased from 21 bison in 1902 to 250 in only 13 years. http: //www. nature. com/scitable/knowledge/library/an-introduction-to-population-growth-84225544
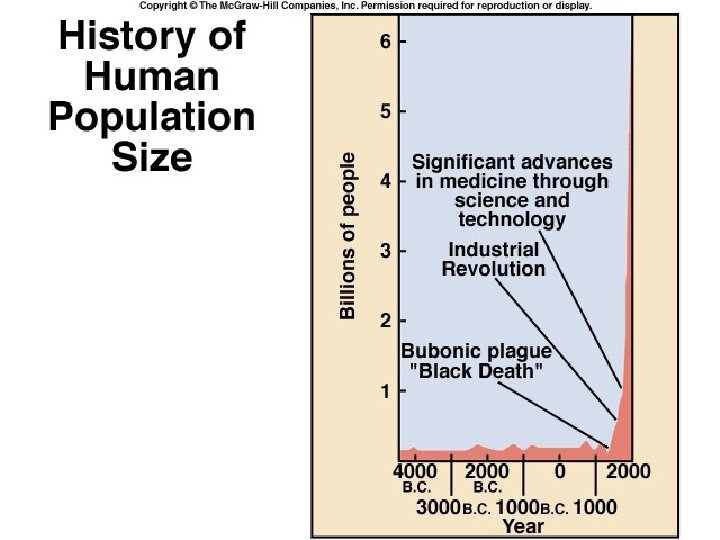
C. 5. U 2 The exponential growth pattern occurs in an ideal, unlimited environment. Examples of exponential population growth Does it surprise you that human population size is growing exponentially? This graph shows the explosion of human population over the last 10, 000 years along with some relevant historical events. http: //www. nature. com/scitable/knowledge/library/an-introduction-to-population-growth-84225544
C. 5. U 4 The phases shown in the sigmoid curve can be explained by relative rates of natality, mortality, immigration and emigration. Limiting factors are environmental factors that controls the maximum rate at which a process, e. g. population growth, can occur • build-up of toxic by products of metabolism • Injury • Senescence (death from age related illness)
C. 5. U 4 The phases shown in the sigmoid curve can be explained by relative rates of natality, mortality, immigration and emigration. All examples of competition for resources • build-up of toxic by products of metabolism • Injury • Senescence (death from age related illness)
C. 5. U 4 The phases shown in the sigmoid curve can be explained by relative rates of natality, mortality, immigration and emigration. The effect of these limiting factors increases as the population increases. These factors are described as being density dependent limiting factors. • build-up of toxic by products of metabolism • Injury • Senescence (death from age related illness)
C. 5. U 4 The phases shown in the sigmoid curve can be explained by relative rates of natality, mortality, immigration and emigration. The this limiting factor does not increases as the population increases. This factor is described as being a density independent limiting factor. • build-up of toxic by products of metabolism • Injury Examples include: • Senescence (death fro m age • Climate / weather • Availability of light (for plants) related illness) • Natural disasters such as volcanic eruptions and fire
C. 5. U 4 The phases shown in the sigmoid curve can be explained by relative rates of natality, mortality, immigration and emigration. Increases to population size from external populations Increases to population size through reproduction (i. e. births) Decreases to population size as a result of death (e. g. predation, senescence) Decreases to size as a result external populations population of loss to Population Size = ( Natality + Immigration ) - ( Mortality + Emmigration ) http: //www. slideshare. net/gurustip/populations-2174193
C. 5. U 4 The phases shown in the sigmoid curve can be explained by relative rates of natality, mortality, immigration and emigration.
C. 5. A 3 Discussion of the effect of natality, mortality, immigration and emigration on population size. The effect of natality, immigration, emigration and mortality on population size: Most important factor – without birth the population cannot grow density independent limiting factors such environmental change affect the very young, the old and the weak individuals affected the most. Minimal impact on population growth as individuals of reproductive age affected the least. If individuals die before reproducing the population size of the next generation will be reduced / population growth is negatively affected. The more genetically diverse a population is the more likely individuals are to survive (e. g. disease) to reproduce. Increasing population density and the associated competition promotes emigration from a population (and therefore immigration to other populations)h. ttp: //www. slideshare. net/gurustip/populations-2174193
C. 5. U 4 The phases shown in the sigmoid curve can be explained by relative rates of natality, mortality, immigration and emigration.
C. 5. U 3 Population growth slows as a population reaches the carrying capacity of the environment. A summary of population growth described by the sigmoidal curve • • As the population continues to grow, eventually competition increases as availability of resources are reduced. Natality starts to fall and mortality starts to rise, leading to a slower rate of population increase Eventually the increasing mortality rate equals the natality rate and population size becomes constant. The population has reached the carrying capacity (K) of the environment Limited resources, predation and disease all contribute to keeping the population size balanced While the population size at this point may not be static, it will oscillate around the carrying capacity to remain relatively even (no net growth) • There is a rapid increase in population size / growth as the natality rate exceeds the mortality rate • This is because there is abundant resources (e. g. food, shelter and water) and limited environmental resistance (disease and predation uncommon)
C. 5. U 5 Limiting factors can be top down or bottom up. A limiting factor is an environmental selection pressure that limits population growth. There are two categories of limiting factor: Top-down factors are pressures applied by other organisms at higher trophic levels. Bottom-up factors are those that involve resources or lower tropic levels. A keystone species exerts top-down influence on its community by preventing species at lower trophic levels from monopolizing critical resources, such as competition for space or http: //commons. wikimedia. org/wiki/File: Green_Sea_Turtle_grazing_seagrass. jpg food sources. http: //commons. wikimedia. org/wiki/File: Tierpark_Sababurg_Wolf. jpg
C. 5. A 5 Bottom-up control of algal blooms by shortage of nutrients and top-down control by herbivory. An algal bloom is a rapid increase or accumulation in the population of algae (typically microscopic) in a water system. Free-living algae blooms can disrupt coral reef communities by blocking sunlight and preventing photosynthesis in the symbiotic zooxanthellae. This can cause coral bleaching (the corals eject the no longer useful zooxanthellae) which leads to the death of the corals. http: //commons. wikimedia. org/wiki/File: Algal_bloom_20040615. jpg http: //commons. wikimedia. org/wiki/File: Mar%C 3%A 9_vermelha. JPG
C. 5. A 5 Bottom-up control of algal blooms by shortage of nutrients and top-down control by herbivory. The water around coral-reef ecosystems is generally nutrient-poor. Nutrients though only needed in small amounts are essential for the synthesis of key proteins and other compounds, e. g. magnesium is needed to make chlorophyll Algae depend on photosynthesis for nutrition. With key proteins such as chlorophyll in short supply the rate of photosynthesis and hence algal growth is limited. Nutrients are therefore a bottom-up limiting factor. Nutrient enrichment through human activity (fish farming, fertiliser or sewage outflows directly or from nearby rivers) can cause known as eutrophication – algal populations increase rapidly (blooms) due to the removal of nutrients as a limiting factor. http: //resources 3. news. com. au/images/2011/04/28/1226046/589887 -raw-sewerage. jpg http: //commons. wikimedia. org/wiki/File: Algal_bloom_20040615. jpg
C. 5. A 5 Bottom-up control of algal blooms by shortage of nutrients and top-down control by herbivory. Parrotfish are herbivores that graze on free-living algae at a lower trophic level. This is an example of top- down control of algae. Fishing practices which remove herbivorous fish from coral reefs can lessen the predation of algae. If herbivorous fish numbers decline this can lead to algal blooms http: //www. arkive. org/stoplight-parrotfish/sparisoma-viride/image-G 84654. html
C. 5. S 1 Modelling the growth curve using a simple organism such as yeast or species of Lemna. Duckweed (Lemna sp. ) is a good model organism for measuring sigmoidal population growth • Place a small number of plants in a container, e. g. a plastic cup • Count the number of fronds (leaves) every day until the surface of the container is covered, i. e. the population has ceased to increase. • Plot your results – you should obtain a sigmoidal curve • Your investigation can be extended by considering different independent variables e. g. nutrient availability and the surface area of the container. In the absent of equipment using one or more of the following resources to model population growth: • Yeast Population Growth lab and simulation by i-Biology (http: //www. slideshare. net/gurustip/population-growth-9457952) • Bunny population growth by Ph. ET (http: //phet. colorado. edu/files/activities/3896/04. 02 - CW- bunny simulation - 2014 - 07 -30 - vdefinis. docx) http: //commons. wikimedia. org/wiki/File: Lemna_minor_Prague_2012_1. jpg
C. 5. U 1 Sampling techniques are used to estimate population size. A population is a group of organisms of the same species who live in the same area at the same time. http: //commons. wikimedia. org/wiki/File: Large_number_of_flamingos_at_Lake_Nakuru. jpg
C. 5. U 1 Sampling techniques are used to estimate population size. A population is a group of organisms of the same species who live in the same area at the same time. It is not practical to count most populations directly. It is only feasible if: • Individuals are large • The area is small This is rarely the case therefore researchers need to use sampling techniques to estimate the population by measuring population density in small parts of the study area. n. b. researchers need to remove bias in the selection of areas, e. g. selecting areas might result in a population estimate being too high or low. Therefore the sampled areas are selected randomly. http: //commons. wikimedia. org/wiki/File: Large_number_of_flamingos_at_Lake_Nakuru. jpg
C. 5. A 2 Use of the capture-mark-release-recapture method to estimate the population size of an animal species. More information and guidance: http: //www. offwell. free-online. co. uk/lincoln. htm
C. 5. A 2 Use of the capture-mark-release-recapture method to estimate the population size of an animal species.
C. 5. A 2 Use of the capture-mark-release-recapture method to estimate the population size of an animal species.
C. 5. A 2 Use of the capture-mark-release-recapture method to estimate the population size of an animal species.
C. 5. A 2 Use of the capture-mark-release-recapture method to estimate the population size of an animal species. More information and guidance: http: //www. offwell. free-online. co. uk/lincoln. htm
C. 5. A 1 Evaluating the methods used to estimate the size of commercial stock of marine resources. http: //youtu. be/s 3 u 2 Zx. Kh. Po. A http: //youtu. be/m 2 y_M 40 tmvg http: //youtu. be/B 2 E 0 QQG 4 Kk 4
C. 5. A 1 Evaluating the methods used to estimate the size of commercial stock of marine resources. http: //youtu. be/Tf 1 Ege. HDxp. A http: //youtu. be/bedirwk 95 Oc
C. 5. A 4 Analysis of the effect of population size, age and reproductive status on sustainable fishing practices.
C. 5. A 4 Analysis of the effect of population size, age and reproductive status on sustainable fishing practices. Population size and sustainable fishing If the fish population is very small then there will be plenty of resources , e. g. food for all (environmental resistance, e. g. competition is minimal). The population will growth quickly, it will show exponential growth. http: //www. nature. com/scitable/content/ne 0000/ne 0000/50938330/figure 1 -626_1_2. jpg
C. 5. A 4 Analysis of the effect of population size, age and reproductive status on sustainable fishing practices. Population size and sustainable fishing If fish are harvested only (down) to this level then fishing can be continued indefinitely and the population will quickly recover. If greater numbers are taken the population will decline Steepest part of the slope = highest rate of population growth http: //www. nature. com/scitable/content/ne 0000/ne 0000/50938330/figure 1 -626_1_2. jpg
C. 5. A 4 Analysis of the effect of population size, age and reproductive status on sustainable fishing practices. Age and sustainable fishing The otolith (ear bone) contains rings, similar to the rings of a tree, that can be used to determine the age of the fish. Sectioned cod otolith showing annular growth increments (annuli) If a population is growing, then the relative number of younger fish will be higher (there are many potential breeding fish for the future). If a population is in decline, then the proportion of older fish will be higher (older fish have a higher mortality and are unlikely to be as productive in breeding). http: //www. bio. gc. ca/otoliths/scientists-scientifiques/images/annuli-2 -eng. jpg http: //oceanexplorer. noaa. gov/explorations/04 etta/background/barrelfish/media/barrelfish_otolith_600. jpg
C. 5. A 4 Analysis of the effect of population size, age and reproductive status on sustainable fishing practices. Reproductive status and sustainable fishing Quotas are agreed upon for species with low stocks and moratoria declared on the fishing of all endangered species. Restrictions to ensure fish can breed before being caught: • Regulations or international agreements often restrict the net mesh size allowing younger fish to escape. • Closed seasons are often declared to allow undisturbed breeding and exclusion zones are agreed upon in which all fishing is banned. Increase the number of younger fish to encourage a growing population. If young fish are removed the population enters decline as the fish need to live long enough to reproduce successfully. If not enough fish are reproducing the next generation will be smaller. http: //www. thesundaytimes. co. uk/sto/multimedia/dynamic/00288/SPA_288355 k. jpg
C. 5. A 1 Evaluating the methods used to estimate the size of commercial stock of marine resources.
C. 5. A 1 Evaluating the methods used to estimate the size of commercial stock of marine resources.
C. 5. A 1 Evaluating the methods used to estimate the size of commercial stock of marine resources. Summary of the sampling methods used for marineresources: Sampling method Situation in which the method is used Usageand limitations Random sampling Not used. Ineffective as fish are too mobile. Capture-markrelease-recapture Fish are temporarily stunned with electric shocks and then counted Can be used to estimate the size of fish shoals Age structure of landed fish can be used to estimate population size. Used in lakes and rivers, but recapture numbers are too small to be useful in open waters such as oceans. Only useful for schooling fish species Echo sounders Fish catches Violators of fishing regulations designed to control the age of fish landed often do not report what they land or they dump the restricted fish causing a bias in the estimates.