Population Ecology Def Study of the interactions of


 4. Survivorship Curve (Mortality Curve) -- Show the size &")

 5. Age Structure Diagrams -- Shows relative number of individuals")


.")


- Slides: 29
Population Ecology Def – Study of the interactions of organisms with their physical environment & with each other • Organism - Individual of a particular species • Population – Group of individuals of one species living in one area who are able to • • interbreed and interact with each other Community – All populations living in one area Ecosystem – all the organisms in a given area & the abiotic (non-living) factors with which they interact • Biome – large geographical area with unique climate defined by distinctive communities of plants & animals i. e. desert, tundra, rainforest • Biosphere – global ecosystem…the Earth “BBECPO”
Population Properties • 5 Properties 1. Size – Total number of individuals in a population -- Typically represented by N 2. Density – The number of individuals per unit area/volume -- Here we are measuring not population size but how closely packed they are into an area -- For example: which population is more dense: Manhattan’s or Weston’s? -- Sampling techniques used to estimate the number of organisms living in an area -- One sampling technique is called mark & recapture
Mark & Recapture Method • Sampling technique used to estimate population size • Organisms are captured, tagged, then released • Then at some future time, the process is repeated • Example: 1 st catch: 50 whippets tagged 2 nd catch: 100 whippets captured, but only 10 tagged Population Estimate = 500 whippets
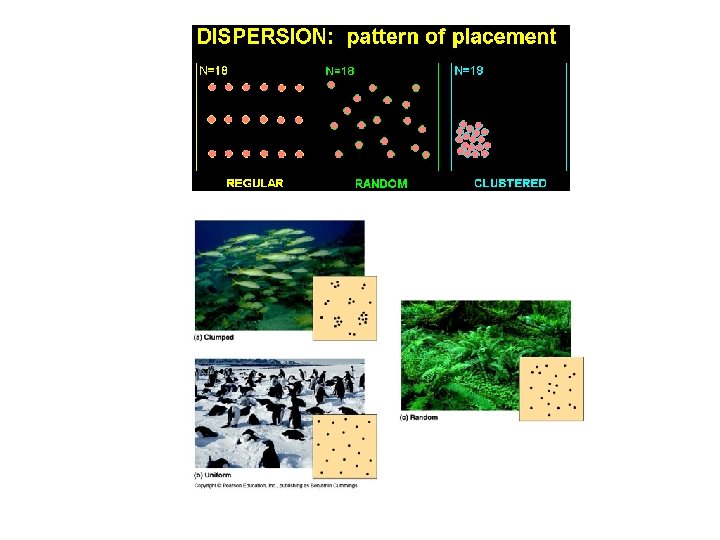
Population Properties cont’d 3. Dispersion – Pattern of spacing of individuals within the area the population inhabits a) Clumped -- Most common pattern of dispersion -- Pack animals b) Uniform -- Animals that defend their territories -- Certain plants which secrete toxins that keep away plants that compete for the same resources c) Random -- Spacing occurs in absence of any spatial factors -- Uncommon pattern in nature -- Tree spacing in a forest other
Population Properties (Page 3) 4. Survivorship Curve (Mortality Curve) -- Show the size & composition of a population -- 3 basic types a) Type I -- Low death rates in young & middle age -- High mortality in old age -- Humans b) Type II -- Constant death rate over entire life span -- Hydra, reptiles, & rodents c) Type III -- High death rate among young, but then slows -- Fish & Invertebrates (external fertilization)
Survivorship Curves
Population Properties (Page 4) 5. Age Structure Diagrams -- Shows relative number of individuals at each age
Age Structure Diagrams • Curve I – Afghanistan – – Pyramidal shape Bottom heavy or majority of population is young May indicate future population explosion Alternatively, may indicate population pressure • The majority of population will die young • Curve II – USA – Stable population – Experiencing little or zero population growth – Birth & death rates are equal = numbers in each age group is the same
Population Growth • Biotic Potential – Maximum rate at which a population could increase under ideal conditions – Maximum reproductive capacity of a population under optimum environmental conditions. • As should be evident, this is probably never true – If true, it will only exist briefly – Used more for comparison to the actual situation
Exponential Population Growth • Simplest model for population growth is exponential growth – – – Represents unrestrained growth Unlimited resources No predation/parasitism No competition No immigration/emigration • Example: introduction of a foreign organism into a stable ecosystem – Humans have experienced exponential growth for ~300 yrs.
– Does population growth continue without limits? • Number of resources usually prevent populations from growing exponentially • Carrying capacity (K) = maximum number of individual that an environment can support – When population reaches carrying capacity » birth rate = death rate » population growth rate = 0
Predicting Population Growth
• Population growth – Logistic growth model • Population growth rates decreases as population approaches its carrying capacity Adjustment for limited resources Population size Per capita growth rate Population growth rate
• Population growth – Logistic growth model • Logistic growth produces S-shaped curve; population growth rate decreases as N approaches K Population size (N) K Time (t)
Examples of logistic growth Where have all the sea otters gone?
• Population growth – How does logistic growth model work? • When N is very small (imagine N is 1 and K is 1000). . . is close to 1, so population grows exponentially (1) Population size (N) Time (t)
• When N approaches K (imagine N is 500, 600, . . . 900 and K is 1000). . . Gets closer and closer to 0, so population growth slowly approaches 0 Population size (N) Time (t)
• When N equals K (imagine N is 1000 and K is 1000). . . is 0, so population growth is 0 Population size (N) Time (t)
Actual Population Growth Models Characteristic Overshot
– Density-dependent population regulation • As populations near carrying capacity…population growth rate declines – Per capita birth rates decrease (fewer resources available for production of offspring) » fewer resources available for production of offspring – Per capita death rates increase (fewer resources for survival, predators focus attention on common prey) » fewer resources for survival » predators focus attention on common prey
– Density-dependent factors include: • disease • predators • competition for resources
• Population growth – Sometimes population regulated by densityindependent factors • Birth rates decrease and death rates increase regardless of population size – Extremely cold winter – drought – fires
r- and K-selected life history traits Life History - an organism’s schedule of reproduction and survival trait r-selected K-selected – age at 1 st reproduction early late – lifespan short long – Survivorship low (type III) high(type I) – Fecundity high low – Offspring size small large – Parental care none lots
Typical Populations • Boom-and-bust cycles are common in populations over time – Due to complex interactions between biotic and abiotic factors
Predator-Prey Relationships --Exponential Growth then crash -- Lynx population follows the hare pop. -- Cycles in hare due to food availability (grass overgrazing), disease, or predation -- Cycles in Lynx due to hare availability
Human Populations • Until 1650, human populations were very low growth • Humans have experienced high growth rates since about 1650 • Since 1970 s, population growth has decreased over time
Demographic Transition
Ecological Footprint • Proxy measure of carrying capacity • Total land + water area needed for all the resources 1 person consumes in a population • 1. 7 hectares person = sustainable usage • In the US, 10 hectares person is typical