Chapter 5 Population Ecology Section 1 Population Dynamics
![Chapter 5: Population Ecology Chapter 5: Population Ecology](https://slidetodoc.com/presentation_image_h/29a242e5456c4afc13e387f98f944eb9/image-1.jpg)
![Section 1: Population Dynamics CLE 3210. 2. 2: Analyze and interpret population data, graphs, Section 1: Population Dynamics CLE 3210. 2. 2: Analyze and interpret population data, graphs,](https://slidetodoc.com/presentation_image_h/29a242e5456c4afc13e387f98f944eb9/image-2.jpg)
![Population Characteristics l All species occur in groups called populations l There are certain Population Characteristics l All species occur in groups called populations l There are certain](https://slidetodoc.com/presentation_image_h/29a242e5456c4afc13e387f98f944eb9/image-3.jpg)
![l Spatial Distribution l The pattern of population spacing in an area l 3 l Spatial Distribution l The pattern of population spacing in an area l 3](https://slidetodoc.com/presentation_image_h/29a242e5456c4afc13e387f98f944eb9/image-4.jpg)
![](https://slidetodoc.com/presentation_image_h/29a242e5456c4afc13e387f98f944eb9/image-5.jpg)
![l Population Ranges l How far can a species spread? What areas can a l Population Ranges l How far can a species spread? What areas can a](https://slidetodoc.com/presentation_image_h/29a242e5456c4afc13e387f98f944eb9/image-6.jpg)
![Population-Limiting Factors l Limiting factors keep a population from continuing to increase forever Population-Limiting Factors l Limiting factors keep a population from continuing to increase forever](https://slidetodoc.com/presentation_image_h/29a242e5456c4afc13e387f98f944eb9/image-7.jpg)
![l Density-Independent Factors l Factors that do not depend on population size; will occur l Density-Independent Factors l Factors that do not depend on population size; will occur](https://slidetodoc.com/presentation_image_h/29a242e5456c4afc13e387f98f944eb9/image-8.jpg)
![l Density-dependent factors l An environmental factor that depends on population size l Usually l Density-dependent factors l An environmental factor that depends on population size l Usually](https://slidetodoc.com/presentation_image_h/29a242e5456c4afc13e387f98f944eb9/image-9.jpg)
![l Disease l Outbreaks of disease tend to occur when population size has increased l Disease l Outbreaks of disease tend to occur when population size has increased](https://slidetodoc.com/presentation_image_h/29a242e5456c4afc13e387f98f944eb9/image-10.jpg)
![l Competition between organisms increases when density increases l When the population increases to l Competition between organisms increases when density increases l When the population increases to](https://slidetodoc.com/presentation_image_h/29a242e5456c4afc13e387f98f944eb9/image-11.jpg)
![l Parasites l Affects organisms similar to disease…higher density populations will be negatively affected l Parasites l Affects organisms similar to disease…higher density populations will be negatively affected](https://slidetodoc.com/presentation_image_h/29a242e5456c4afc13e387f98f944eb9/image-12.jpg)
![Population Growth Rate l Explains how fast a population grows l Must know birth Population Growth Rate l Explains how fast a population grows l Must know birth](https://slidetodoc.com/presentation_image_h/29a242e5456c4afc13e387f98f944eb9/image-13.jpg)
![Exponential Growth l Occurs when the growth rate is proportional to the size of Exponential Growth l Occurs when the growth rate is proportional to the size of](https://slidetodoc.com/presentation_image_h/29a242e5456c4afc13e387f98f944eb9/image-14.jpg)
![Logistic Growth Model l Occurs when the population’s growth slows or stops; reaches carrying Logistic Growth Model l Occurs when the population’s growth slows or stops; reaches carrying](https://slidetodoc.com/presentation_image_h/29a242e5456c4afc13e387f98f944eb9/image-15.jpg)
![Carrying Capacity Maximum number of a species that an environment can support l Limited Carrying Capacity Maximum number of a species that an environment can support l Limited](https://slidetodoc.com/presentation_image_h/29a242e5456c4afc13e387f98f944eb9/image-16.jpg)
![Reproductive Patterns l Both plants and animals are placed into groups based on their Reproductive Patterns l Both plants and animals are placed into groups based on their](https://slidetodoc.com/presentation_image_h/29a242e5456c4afc13e387f98f944eb9/image-17.jpg)
![Section 2: Human Population CLE 3210. 2. 1: Investigate how the dynamic equilibrium of Section 2: Human Population CLE 3210. 2. 1: Investigate how the dynamic equilibrium of](https://slidetodoc.com/presentation_image_h/29a242e5456c4afc13e387f98f944eb9/image-18.jpg)
![Human Population Growth l Demography study of population size, density, distribution, movement, and birth Human Population Growth l Demography study of population size, density, distribution, movement, and birth](https://slidetodoc.com/presentation_image_h/29a242e5456c4afc13e387f98f944eb9/image-19.jpg)
![In 1804, the population of Earth was an estimated one billion people l By In 1804, the population of Earth was an estimated one billion people l By](https://slidetodoc.com/presentation_image_h/29a242e5456c4afc13e387f98f944eb9/image-20.jpg)
![1 in 7 Billion 1 in 7 Billion](https://slidetodoc.com/presentation_image_h/29a242e5456c4afc13e387f98f944eb9/image-21.jpg)
![l Technological advances have increased human carrying capacity l Ex: agriculture, medicine, shelter l Technological advances have increased human carrying capacity l Ex: agriculture, medicine, shelter](https://slidetodoc.com/presentation_image_h/29a242e5456c4afc13e387f98f944eb9/image-22.jpg)
- Slides: 22
![Chapter 5 Population Ecology Chapter 5: Population Ecology](https://slidetodoc.com/presentation_image_h/29a242e5456c4afc13e387f98f944eb9/image-1.jpg)
Chapter 5: Population Ecology
![Section 1 Population Dynamics CLE 3210 2 2 Analyze and interpret population data graphs Section 1: Population Dynamics CLE 3210. 2. 2: Analyze and interpret population data, graphs,](https://slidetodoc.com/presentation_image_h/29a242e5456c4afc13e387f98f944eb9/image-2.jpg)
Section 1: Population Dynamics CLE 3210. 2. 2: Analyze and interpret population data, graphs, or diagrams. Objectives: Describe characteristics of populations; Understand the concepts of carrying capacity and limiting factors; Describe the ways in which populations are distributed.
![Population Characteristics l All species occur in groups called populations l There are certain Population Characteristics l All species occur in groups called populations l There are certain](https://slidetodoc.com/presentation_image_h/29a242e5456c4afc13e387f98f944eb9/image-3.jpg)
Population Characteristics l All species occur in groups called populations l There are certain characteristics that all populations have: l Population Density l Population density is the number of organisms per unit area
![l Spatial Distribution l The pattern of population spacing in an area l 3 l Spatial Distribution l The pattern of population spacing in an area l 3](https://slidetodoc.com/presentation_image_h/29a242e5456c4afc13e387f98f944eb9/image-4.jpg)
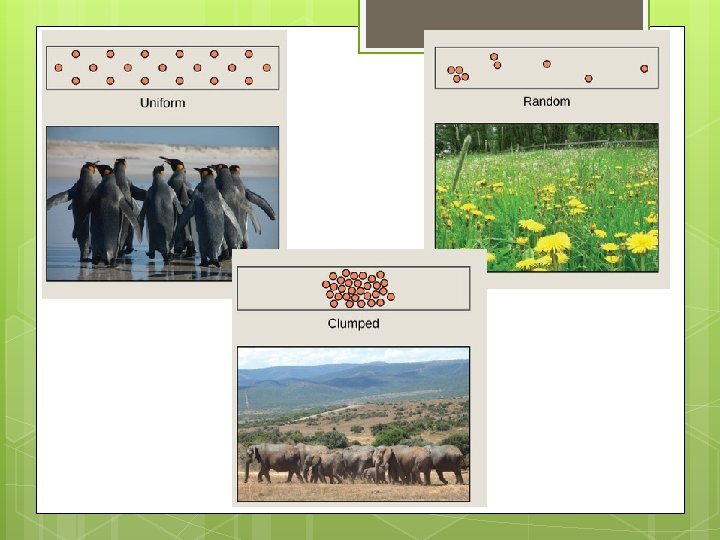
l Spatial Distribution l The pattern of population spacing in an area l 3 Main Types: 1. Uniform Dispersion evenly spaced; black bear 2. Clumped Dispersion clustered together; herds 3. Random Dispersion randomly arranged; deer
![](https://slidetodoc.com/presentation_image_h/29a242e5456c4afc13e387f98f944eb9/image-5.jpg)
![l Population Ranges l How far can a species spread What areas can a l Population Ranges l How far can a species spread? What areas can a](https://slidetodoc.com/presentation_image_h/29a242e5456c4afc13e387f98f944eb9/image-6.jpg)
l Population Ranges l How far can a species spread? What areas can a species survive in? l No population can survive in all habitats. l Populations are limited by biotic and abiotic factors l. A species might not be able to expand its population range because it cannot survive the abiotic and biotic factors found in the expanded region.
![PopulationLimiting Factors l Limiting factors keep a population from continuing to increase forever Population-Limiting Factors l Limiting factors keep a population from continuing to increase forever](https://slidetodoc.com/presentation_image_h/29a242e5456c4afc13e387f98f944eb9/image-7.jpg)
Population-Limiting Factors l Limiting factors keep a population from continuing to increase forever
![l DensityIndependent Factors l Factors that do not depend on population size will occur l Density-Independent Factors l Factors that do not depend on population size; will occur](https://slidetodoc.com/presentation_image_h/29a242e5456c4afc13e387f98f944eb9/image-8.jpg)
l Density-Independent Factors l Factors that do not depend on population size; will occur whether or not living things are present l Usually abiotic l Ex: Extreme hot or cold, tornadoes, hurricanes
![l Densitydependent factors l An environmental factor that depends on population size l Usually l Density-dependent factors l An environmental factor that depends on population size l Usually](https://slidetodoc.com/presentation_image_h/29a242e5456c4afc13e387f98f944eb9/image-9.jpg)
l Density-dependent factors l An environmental factor that depends on population size l Usually biotic factors l Ex: predation, disease, parasites, competition
![l Disease l Outbreaks of disease tend to occur when population size has increased l Disease l Outbreaks of disease tend to occur when population size has increased](https://slidetodoc.com/presentation_image_h/29a242e5456c4afc13e387f98f944eb9/image-10.jpg)
l Disease l Outbreaks of disease tend to occur when population size has increased and population density is high…disease is passed easily from one organism to another
![l Competition between organisms increases when density increases l When the population increases to l Competition between organisms increases when density increases l When the population increases to](https://slidetodoc.com/presentation_image_h/29a242e5456c4afc13e387f98f944eb9/image-11.jpg)
l Competition between organisms increases when density increases l When the population increases to a size where resources (food, space) become limited, individuals must compete for the resources
![l Parasites l Affects organisms similar to diseasehigher density populations will be negatively affected l Parasites l Affects organisms similar to disease…higher density populations will be negatively affected](https://slidetodoc.com/presentation_image_h/29a242e5456c4afc13e387f98f944eb9/image-12.jpg)
l Parasites l Affects organisms similar to disease…higher density populations will be negatively affected by parasites (will decrease numbers)
![Population Growth Rate l Explains how fast a population grows l Must know birth Population Growth Rate l Explains how fast a population grows l Must know birth](https://slidetodoc.com/presentation_image_h/29a242e5456c4afc13e387f98f944eb9/image-13.jpg)
Population Growth Rate l Explains how fast a population grows l Must know birth rate (natality) and death rates (mortality ) l Emigration: how many leave (“EXIT”) l Immigration: how many move in
![Exponential Growth l Occurs when the growth rate is proportional to the size of Exponential Growth l Occurs when the growth rate is proportional to the size of](https://slidetodoc.com/presentation_image_h/29a242e5456c4afc13e387f98f944eb9/image-14.jpg)
Exponential Growth l Occurs when the growth rate is proportional to the size of the population
![Logistic Growth Model l Occurs when the populations growth slows or stops reaches carrying Logistic Growth Model l Occurs when the population’s growth slows or stops; reaches carrying](https://slidetodoc.com/presentation_image_h/29a242e5456c4afc13e387f98f944eb9/image-15.jpg)
Logistic Growth Model l Occurs when the population’s growth slows or stops; reaches carrying capacity
![Carrying Capacity Maximum number of a species that an environment can support l Limited Carrying Capacity Maximum number of a species that an environment can support l Limited](https://slidetodoc.com/presentation_image_h/29a242e5456c4afc13e387f98f944eb9/image-16.jpg)
Carrying Capacity Maximum number of a species that an environment can support l Limited by energy, water, oxygen, and nutrients l
![Reproductive Patterns l Both plants and animals are placed into groups based on their Reproductive Patterns l Both plants and animals are placed into groups based on their](https://slidetodoc.com/presentation_image_h/29a242e5456c4afc13e387f98f944eb9/image-17.jpg)
Reproductive Patterns l Both plants and animals are placed into groups based on their reproductive factors r-strategists: generally small organisms that have short life spans and produce many offspring (fruit fly, mouse, locusts) l k-strategists: larger organisms with longer life spans that produce only a few offspring (humans, lions, elephants) l
![Section 2 Human Population CLE 3210 2 1 Investigate how the dynamic equilibrium of Section 2: Human Population CLE 3210. 2. 1: Investigate how the dynamic equilibrium of](https://slidetodoc.com/presentation_image_h/29a242e5456c4afc13e387f98f944eb9/image-18.jpg)
Section 2: Human Population CLE 3210. 2. 1: Investigate how the dynamic equilibrium of an ecological community is associated with interactions among its organisms Objectives: Explain the trends in human population growth; Compare the age structure of representative nongrowing, slowly growing, and rapidly growing countries; Predict the consequences of continued population growth
![Human Population Growth l Demography study of population size density distribution movement and birth Human Population Growth l Demography study of population size, density, distribution, movement, and birth](https://slidetodoc.com/presentation_image_h/29a242e5456c4afc13e387f98f944eb9/image-19.jpg)
Human Population Growth l Demography study of population size, density, distribution, movement, and birth and death rate
![In 1804 the population of Earth was an estimated one billion people l By In 1804, the population of Earth was an estimated one billion people l By](https://slidetodoc.com/presentation_image_h/29a242e5456c4afc13e387f98f944eb9/image-20.jpg)
In 1804, the population of Earth was an estimated one billion people l By 1999, the human population had reached six billion people. l At this growth rate, about 70 million people are added to the world population annually and the world’s population is expected to double in about 53 years. l
![1 in 7 Billion 1 in 7 Billion](https://slidetodoc.com/presentation_image_h/29a242e5456c4afc13e387f98f944eb9/image-21.jpg)
1 in 7 Billion
![l Technological advances have increased human carrying capacity l Ex agriculture medicine shelter l Technological advances have increased human carrying capacity l Ex: agriculture, medicine, shelter](https://slidetodoc.com/presentation_image_h/29a242e5456c4afc13e387f98f944eb9/image-22.jpg)
l Technological advances have increased human carrying capacity l Ex: agriculture, medicine, shelter
Section 1 population dynamics answer key
Population ecology chapter 4 answers
Section 1 population dynamics answer key
Population ecology section 1 population dynamics
Chapter 4 section 1 population dynamics
Chapter 4 population ecology answer key
Chapter 53 population ecology
Chapter 36 population ecology
Chapter 4 population ecology answer key
Chapter 53 population ecology
Study guide chapter 3 section 1 community ecology
Chapter 2 principles of ecology
Principles of ecology chapter 2 section 1 answer key
Chapter 2 principles of ecology
Chapter 2 section 1 organisms and their relationships
Clumped dispersion
Logistic and exponential growth
Population vs community ecology
Ecosystem vs community
Concept 3 population ecology
Population ecology def
Population characteristic