Population Ecology Population Dynamics Chapter 4 Population Characteristics


 � Groups are evenly spaced � Members often don’t want")
 � Members are usually social � Members are usually around")
 � Not centered around a certain resource � Some members")


- Slides: 53
Population Ecology Population Dynamics Chapter 4
Population Characteristics � Population- group of organisms of the same species in the same area � Population characteristics include: ◦ Density, spatial distribution and growth rate � Population an area Density- number of organisms in ◦ 38 deer/square mile in NJ
Dispersion Patterns Uniform (solitary) � Groups are evenly spaced � Members often don’t want to be near each other
Dispersion Patterns Clumped (herds) � Members are usually social � Members are usually around important resources
Dispersion Patterns Random (groups) � Not centered around a certain resource � Some members are social, some are not
Limiting Factors � Keep populations from growing indefinitely ◦ Without these, populations would infinitely large � Can be abiotic � Can be biotic ◦ Hiding places ◦ Temperature ◦ Rainfall ◦ Food ◦ Predators ◦ Disease
Density Independent Limiting Factors � Does not depend on the number of organisms in an area � Usually abiotic ◦ Weather (floods, temperatures, hurricanes)
Density Dependent Limiting Factor � Depends on Density � Often Biotic ◦ Parasites, Predators, Disease, Competition
Population Growth � Population growth ratemeasure of how fast a population grows � Birth and Immigration increase Populations � Death and Emigration decrease populations Growth rate Death rate Emigration rate r = (b – d) + (i – e) Birth rate Immigration rate
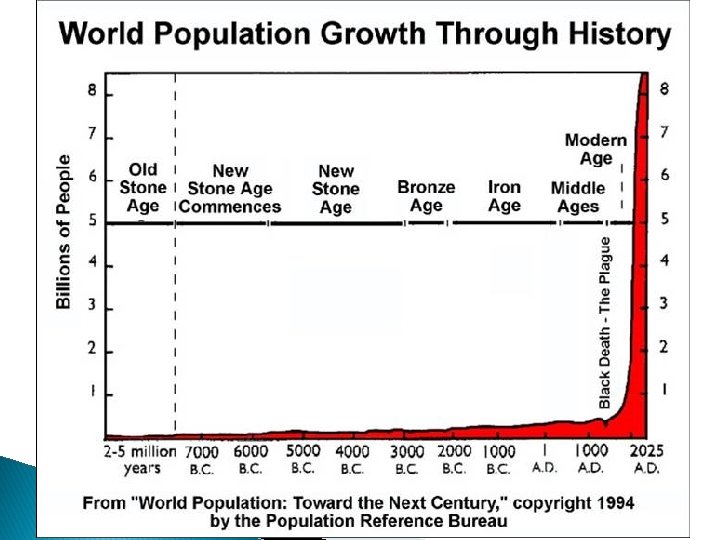
Exponential Growth � Growth without limiting factors � J shaped Curve ◦ Exponential growth � Many young survive � Cannot occur forever! ◦ Why?
Logistic Growth � Population Strains Resources � Growth will slow or stop � Fluctuates around a carrying capacity (K) � S- Shaped
Carrying Capacity � Carrying Capacity- the maximum number of individuals that the environment can support for the long term � Limited by nutrients, oxygen, and water
Reproductive Strategies r-selected � Many young � Reproduce quickly � Little parental care � Small in size � Examples: ◦ Insects ◦ Plants (esp weeds) ◦ Frogs
Reproductive Strategies k-selected � Large organism � Much parental care � Mature Late � Few Young � Examples: ◦ ◦ Kangaroo and Koala Humans Redwood trees Whales
Human Populations Humans change their environment to increase carrying capacities � Technologies reduce death rates � ◦ Medicine 70 million new people every year � 53 years to double the population � Growth rate is slowing � ◦ AIDS ◦ Voluntary Population Control � Ie. China – One Child Policy
Trends � Developed countries have a lower birth rate and later date rate ◦ USA (2009)- 13. 9/1000 ◦ USA (1850) 50/1000 � Why? � Zero death @ 78. 11 years old death @ 38. 3 years old population growth, so… ◦ Birthrate + Immigration rate = Death rate + emigration rate
Age Structure Diagrams
More Age Structure Diagrams
9 Week Test Let’s take a minute to talk
Grading Policy � All marking periods and final exam is worth 20% according to new school policy ◦ No midterms ◦ So finals count more!
What are we doing? � 9 week, 18 week 27 week, and 36 week exams ◦ Will help prepare you for the EOC Bio Test ◦ Grade goes on the individual marking period.
What to know for 9 week… � Food chain and food web ◦ producer/autotroph, consumers (herbivores, carnivores, omnivores) ◦ Arrow indicates flow of energy ◦ Trophic levels ◦ Pyramid of energy and biomass – 10% rule � Symbiotic relationships ◦ Mutualism, commensalism, parasitism � Biodiversity and biomes ◦ Tropical rainforest have most biodiversity � Read and interpret graph
More topics � Photosynthesis – who does it, what is it? ◦ Uses CO 2 and water to make glucose and release oxygen � Respiration – opposite of photosynthesis ◦ Uses oxygen to break down glucose, release water and CO 2 � Indicator species – ex. Amphibians ◦ What will happen to insects if lose frogs? What about snakes? � Cycles – water, carbon, phosphorus, nitrogen, and greenhouse � Population studies◦ S and J curves � Microscope
Biodiversity and Conservation
Biodiversity � Biodiversity-variety of life � Extinction- no more member of a species exists � Genetic diversity- variety of genes in a population ◦ Higher diversity offers a better chance to survive a disaster ◦ Some individuals are naturally resistant to some disease �Humans and AIDS (delta 32 mutation)
Species Diversity � Species Diversity- number of different species and the abundance in an area � What biomes have a higher diversity?
Why preserve Biodiversity? � We yet may not know the benefit of an organisms ◦ Aspirins-from willow ◦ Penicillin comes from mold ◦ What's next? � Healthy diversity ◦ Leads to healthy watersheds ◦ Clean drinking water � Its beautiful
Conservation Extinction Rates � Background extinction- gradual process of a species going extinct ◦ Always present ◦ Caused by natural processes, climate change, natural disasters � Mass extinction- large percentage of all living species become extinct in a short time ◦ Dinosaurs 65 million years ago
Extinctions � 73% of extinct mammals over the last 500 years are island species ◦ Why? � Many of Hawaii's birds are extinct ◦ Ground nesters – ie saffron finches � Amphibians danger ◦ Why? are currently in
Threats � Humans- change natural conditions faster than organisms can adapt � Humans- Overexploitation ◦ 50 million bison dwindled to 1000 in 1889 � Overexploitation may lead to extinction � Humans-habitat loss ◦ Passenger pigeon (next slide) ◦ Not enough food ◦ Changed weather patterns
Passenger Pigeon � � � About 5 billion in N. American in 1600 s-1700 s Up to 90 nests /tree collapsed branches Migrating flocks shadowed sky 9 am-4 pm ◦ If shoot gun randomly – birds would fall from sky ◦ Good food � � Females lay one egg a year Population decline – lost habitat and hunted ◦ Stool pigeon – name came from passenger pigeon � Community bird – like to be in groups � Capture pigeon, tie to stool, stitch eyes shut so cry, move pigeon around while shrieking to attract other pigeons � Last one died in zoo - 1914
Bison Slaughter � Bison hunted for sport � Skulls used as fertilizer � Purpose of Bronx Zoo was to replace the bison herds ◦ Now – people grow bison for meat
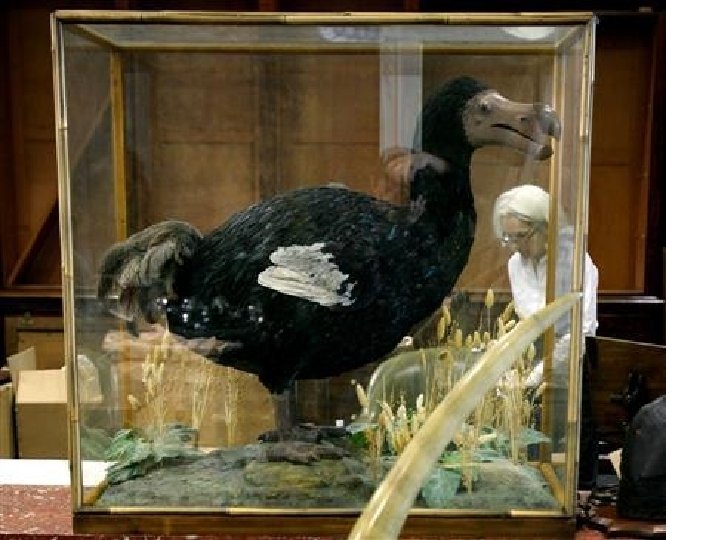
Habitat Disruption � Changing on thing can have a big effect ◦ Whales disappear then plankton bloom ◦ ADD: Dodo bird � Habitat Fragmentation- separating an ecosystem into small areas � Edge effect- temperature, humidity and species are different at edges than interiors ◦ Overlap makes the area unique
Biomagnification � Pollutants build up to high levels in carnivores � The pollutants are fat soluble � They enter the food chain at low levels � Examples ◦ DDT- kills mosquitoes and other insects ; accumulates in birds (ie eagles) affects egg shells ◦ Mercury- accumulates in humans causing problems with the nervous system (vision, hearing and speech) ◦ Dioxin- causes organ disease, increased risk of cancer and a suppressed immune system
Add… Dioxins released when plastics are burned
Acid Precipitation � Caused by burning fossil fuels � Sulfuric acid and nitric acid are formed � Acid rain falls back as rain, snow fog or sleet � Acid rain removes nutrients from soil and kills fish and other organisms
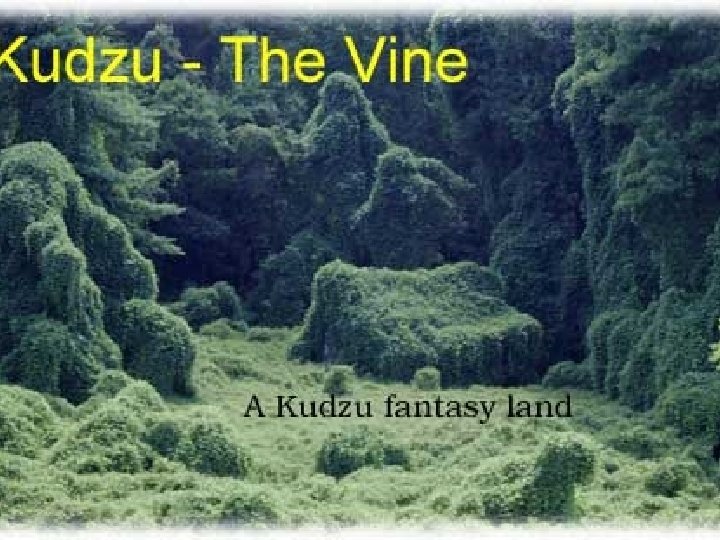
Invasive Species � Introduced or invasive species have been moved to their habitat � Organisms are not kept in balance by natural means � Examples ◦ Cane Toads ◦ Fire Ants ◦ Phragmities (the plant in the Meadowlands) ◦ Kudzu – coming up!
Kudzu Arrives � Came to US in 1876 at Japan exhibit of the Centennial � In 1930’s – used to halt soil erosion � Promoted as “miracle vine” until 1953 � Is a legume – adds N to soil � Flowers are pretty
Kudzu Today � Not under control but learn to live with � Vines used for baskets ◦ Free material! ◦ Expensive basket � Bread and jelly � Provides digestive nutrients ◦ Crohn’s disease – difficult digesting food �Kudzu soup – made from solid; people who have Crohn’s swear by ti
Kud-Zoo
Zebra Mussels � First noticed in Great lakes in 1988 � Can live for days and weeks out of water ◦ If temperature and humidity is high � 1 adult female produces between 30, 000400, 000 eggs per year � Filter feeders ◦ Increase light penetration ◦ Increase algae growth
Between ¼ and ½ in long � Razor sharp shells cut 1 in into human flesh � ◦ so fine no realize cuts � Cover may things ◦ Cost of damage is in billions of dollars
The spread…
Wild Hogs � From Europe ◦ Hernando De. Soto brought wild boars to FL for food and hunting � Bred with feral and domestic hogs � Today- wild hogs are damaging land in 39 states ◦ Damage ~1. 5 billion/year
Bad piggies � Opportunistic omnivores ◦ Will eat anything ◦ Wipe out native plant species � Destroy crops, dig up seeded fields � Erode soil, muddy stream � Eat deer, livestock and bird and turtle eggs � Hard to catch – run 30 mph and can detect odors 7 miles away or 25 ft underground
Range has spread � As far north as south NJ
Conservation � Industrialized countries use more resources � Renewable resource- replaced by natural processes � Nonrenewable- finite amount of the resource available � Which are renewable and which are not Fossil Fuels Water Timber Kenaf Solar Radiation Hydropower Metals
Sustainable Use � Resources must be used at a rate they can be replaced � All resources need to be used in an sustainable manner ◦ Nonrenewable resources �Fossil Fuels �Metals ◦ Renewable resources �Timber �Seafood
Hot Spots � 15% of the Earth Surfaces is considered a Hot Spot � There are many endemic species ◦ They only exist at that location � 70% of this habitat is lost
Should we restore ecosystem? � What � How ecosystems should be restored? should we do it? ◦ Bioremediation-remove toxins by using living organisms ◦ Bioaugmentation- adding natural predators