1 30 17 Population Ecology Population Dynamics Population


 - Death")


: • The maximum population size that can be")


- Slides: 35
1 -30 -17
Population Ecology
Population Dynamics • Population: • All the individuals of a species that live together in an area • Demography: • The statistical study of populations, allows predictions to be made about how a population will change
Population Dynamics • Three Key Features of Populations 1. Size 2. Density 3. Dispersion
Three Key Features of Populations Size: number of individuals in an area
Three Key Features of Populations • Growth Rate: • Birth Rate (natality) - Death Rate (mortality) • How many individuals are born vs. how many die • Birth rate (b) − death rate (d) = rate of natural increase (r)
Three Key Features of Populations Density: measurement of population per unit area or unit volume Pop. Density = # of individuals ÷ unit of space
How Do You Affect Density? 1. Immigration: movement of individuals into a population 2. Emigration: movement of individuals out of a population
3. Density-dependent factors: Biotic factors in the environment that have an increasing effect as population size increases (disease, competition, parasites) 4. Density-independent factors: Abiotic factors in the environment that affect populations regardless of their density (temperature, weather)
Population Dispersion
Three Key Features of Populations • Dispersion: describes the spacing of organisms relative to each other 1. Clumped 2. Uniform 3. Random
How Are Populations Measured? • Population density = number of individuals in a given area or volume • Count all the individuals in a population • Estimate by sampling • Mark-Recapture Method
How Do Populations Grow? • Idealized models describe two kinds of population growth: 1. Exponential Growth 2. Logistic Growth
Carrying Capacity • Carrying Capacity (k): • The maximum population size that can be supported by the available resources • There can only be as many organisms as the environmental resources can support
Exponential Growth Curve Figure 35. 3 A
Logistic Growth Curve
Factors Limiting Growth Rate • Declining birth rate or increasing death rate are caused by several factors including: 1. Limited food supply 2. The buildup of toxic wastes 3. Increased disease 4. Predation
Reproductive Strategies • R Strategists § Short life span § Small body size § Reproduce quickly § Have many young § Little parental care § Ex: cockroaches, weeds, bacteria
Reproductive Strategies • K Strategists § Long life span § Large body size § Reproduce slowly § Have few young § Provides parental care § Ex: humans, elephants
1. What type of growth model does this graph show?
2. If angelfish produce hundreds of young several times a year, which statement below is true? A. Angelfish have a k-strategy reproductive pattern. B. Angelfish have a r-strategy reproductive pattern
3. If an aquarium holds 80 L of water and contains 170 guppies, what is the approximate density of the guppy population?
4. Which is a densityindependent factor? A. B. C. D. A severe drought An intestinal parasite A fatal virus Severe overcrowding
1 -31 -17
Why is the lifespan of this finch with an eye disease most likely reduced? A. The bird B. The bird C. The bird D. The bird change. cannot mate. cannot find food or water. spreads the disease to others. cannot survive a temperature
Which is a possible reason for the relative quick spread of the shown disease? A. An abiotic factor B. A decrease food supply C. Increase in population density D. Increased immunity
What is the reproductive strategy of the animal in the photo. Explain your answer.
The Human Population • Doubled three times in the last three centuries • About 7. 3 billion and may reach 9. 3 billion by the year 2050 • Improved health and technology have lowered death rates
History of the Human Population
Human Population Growth • J curve growth • Grows at a rate of about 80 million yearly • r =1. 3% • Why doesn’t environmental resistance take effect? • Altering their environment • Technological advances • The cultural revolution • The agricultural revolution • The industrial-medical revolution
Trends in Human Population Growth • The change in population from high birth rate and death rates to low birth rates and death rates is called demographic transition. • Zero population growth occurs when births plus immigration equals deaths plus emigration.
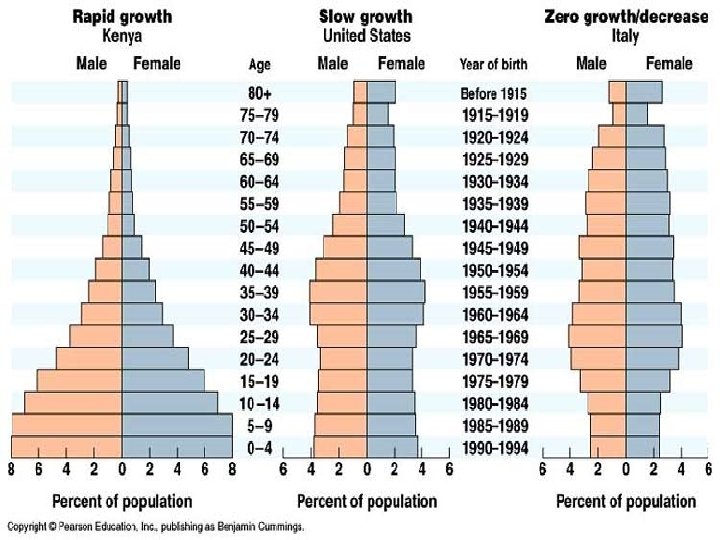
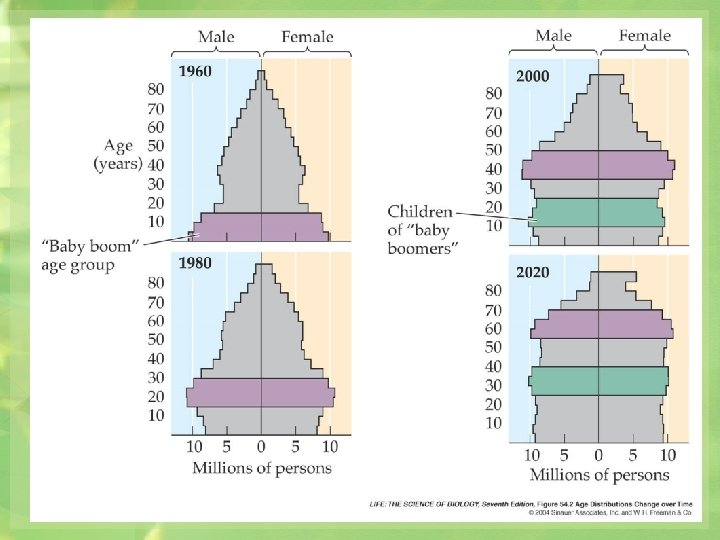
Age Distribution • Distribution of males and females in each age group of a population 1. Pre-reproduction (before 20 yrs old) 2. Reproduction( 20 -44 yrs old) 3. Post-reproduction ( 45 and up) Used to predict future population
What is the dispersion pattern of herding animals, birds that flock together, and fish that form schools? A. Clumped B. Random C. Uniform D. Unpredictable