Population Ecology Chapter 53 What is ecology Ecology


- Slides: 14
Population Ecology Chapter 53
What is ecology? Ecology is the study of organisms and their interactions with each other and their environment Abiotic Factors: light, water, nutrients, minerals, space etc. Biotic factors: mates, food, canopy cover, offspring etc. Population ecology studies how population numbers and locations change Recall that a population is a group of individuals of a single species in a specific area Ecologists define specific boundaries either natural or manmade Density measures how many individuals in a given area, for example how many trout in a square meter of lake Counting every organism can be daunting, so ecologists often take a sample Mark and Recapture (Fig. 53. 2) Quadrats https: //www. oceanmatters. org/wpcontent/uploads/2012/04/quadrats 1. jpg https: //d 1 e 4 pidl 3 fu 268. cloudfront. net/7 f 3 aeae 5 -00 f 1 -4189 -867434335 ff 02369/quadrat. crop_621 x 465_42, 0. preview. png
Populations are Dynamic Emigration and Immigration cause populations to be fluid Population density can help scientists to determine where the best habitats are Clumping shows individuals in patches Ex: Fungi Uniform shows individuals evenly spaced (can also show territory) Random shows no pattern in spacing Demography: The study of population statistics over time Life tables show individuals survive at each age Cohort: a group of the same age http: //nemaplex. ucdavis. edu/images/sampln 1. gif
Population Graphs Know these general curves and what they mean
Survivorship Curves https: //upload. wikimedia. org/wikipedia/commons/thumb/c/c 4/Survivorship_Curves. jpg/400 px-Survivorship_Curves. jpg Type I- provide care Type II- provide less care Type III- provide little to no care
https: //archive. cnx. org/resources/64522 a 7 f 22 df 9 f 70 dca 059 bff 0 d 746 c 9 e 40 be 33 f/Figure_45_03_01. jpg
Change in Population = Births+ Immigrants – Deaths - Emigrants N = population size t = time B = Births D = Deaths b = per capita birth rate m = per capita death rate r = per capita rate of increase r inst = instantaneous per capita rate of increase Exponential Growth Equation d. N/dt = rinst N J Shaped Curve http: //ccnmtl. columbia. edu/projects/biology/lecture 1/images/image 31. gif
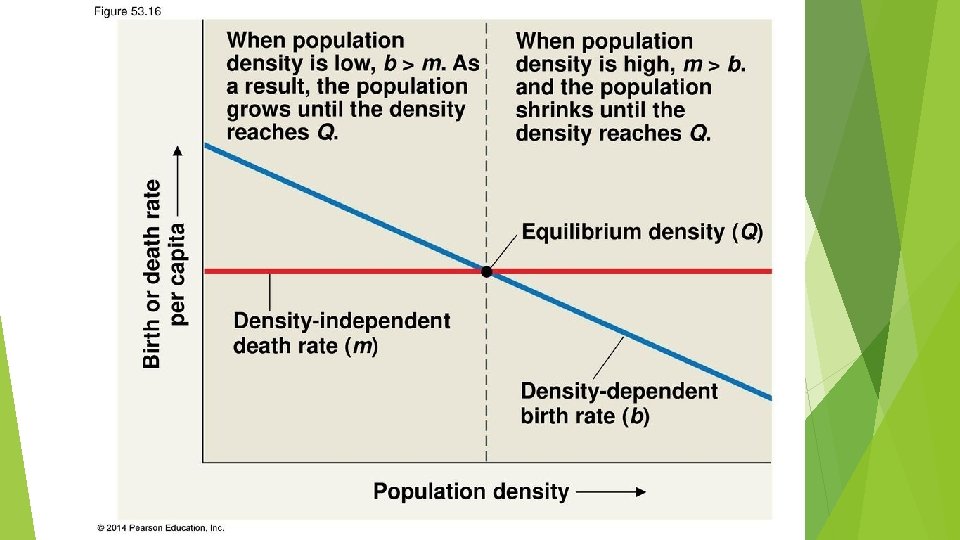
Logistic Model Carrying Capacity: The maximum population size that a particular environment can sustain K Factors such as food, shelter, nutrients (abiotic and biotic factors) control K Logistic Growth Equation d. N/dt = r inst N ((K-N)/K) S Shaped Curve https: //slideplayer. com/slide/9815581/32/images/2/Environmental+Limits+on+Population+Growth. jpg
Life History Diversity Organisms vary a how often and at what age they reproduce Some organisms reproduce once “semelparity”, some reproduce multiple times “iteroparity” The variability depends on the offspring survival rate and the likelihood that the adult will reproduce again Unstable conditions lead to semelparity Stable conditions lead to iteroparity K selection: density dependent selection disease, resources, predation, territory, intrinsic factors, wastes R selection: reproductive success selection
Human Population
https: //ourworldindata. org/uploads/2013/05/updated-World-Population-Growth-1750 -2100. png
http: //www. algebralab. org/img/fba 2228 e-1 ba 1 -47 a 7 -b 6 a 2 -8 e 9399 ad 21 c 5. gif
https: //upload. wikimedia. org/wikipedia/commons/thumb/5/5 a/World_Map_-_Energy_Use_2013. png/440 px-World_Map_-_Energy_Use_2013. png