Population Dynamics Population Dynamics Population all the individuals


 - Death Rate (mortality)")


 Carrying Capacity (k) b S-shaped curve")


 Education (family planning)")
- Slides: 32
Population Dynamics
Population Dynamics Population: all the individuals of a species that live together in an area Demography: the statistical study of populations, make predictions about how a population will change
Population Dynamics Three Key Features of Populations • Size • Density • Dispersion • (clumped, even/uniform, random) • Age Structure
Three Key Features of Populations 1. Size: number of individuals in an area
Factors That Affect Future Population Growth Immigration Natality + + Population Emigration - Mortality
4 Factors that affect density 1. Immigration- movement of individuals into a population 2. Emigration- movement of individuals out of a population
Three Key Features of Populations Growth Rate= Birth Rate (natality) - Death Rate (mortality) X Total Population OR Change in Population X 100 Original Population Rate of Natural Increase(r)= Birth Rate (b) − Death Rate (d) 100
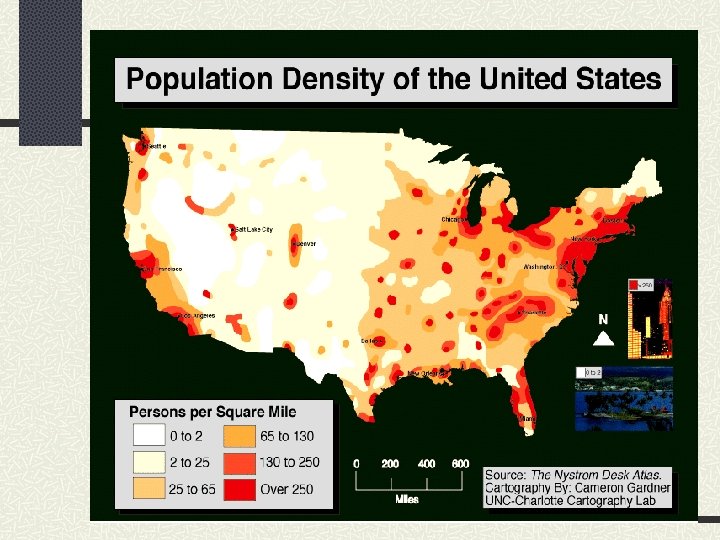
Three Key Features of Populations 2. Density: measurement of population per unit area or unit volume Formula: Dp= N S Pop. Density = # of individuals ÷ unit of space
4 Factors that affect density 3. Density-dependent factors- Biotic factors in the environment that have an increasing effect as population size increases Ex. disease competition parasites
4 Factors that affect density 4. Density-independent factors. Abiotic factors in the environment that affect populations regardless of their density Ex. temperature storms habitat destruction drought
Developing vs. Developed Countries Developing • Less industrialized • Lower per capita income • Less stable government • Poorer living conditions • Higher infant mortality rate • Lower life expectancy Developed • More industrialized • Higher per capita income • More stable government • Better living conditions • Lower infant mortality rate • Higher life expectancy
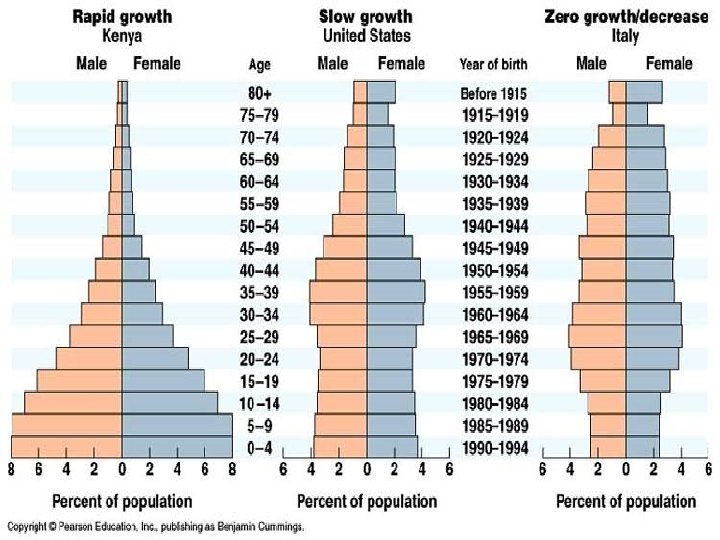
POSTREPRODUCTIVE PREREPRODUCTIVE
Population of a Stable Country
You decide!
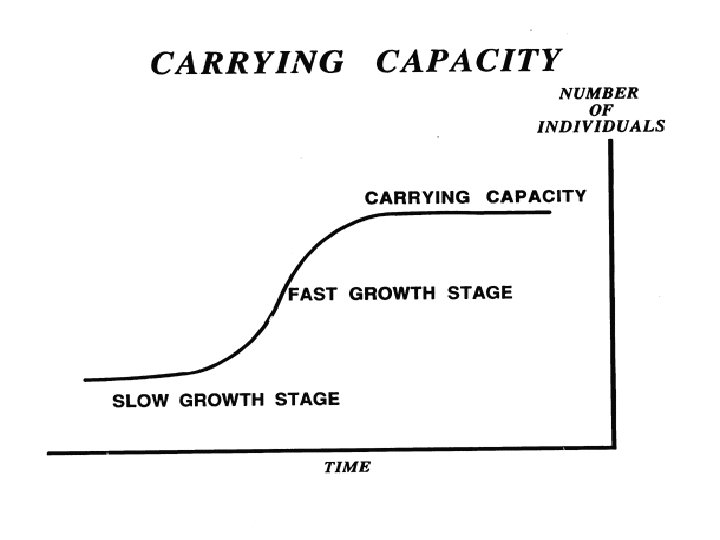
Other factors that affect population growth Carrying Capacity- the maximum population size that can be supported by the available resources There can only be as many organisms as the environmental resources can support
PREDICTING POPULATION GROWTH, con’t Two modes of population growth. The Exponential curve (also known as a Jcurve) occurs when there is no limit to population size. The Logistic curve (also known as an S-curve) shows the effect of a limiting factor (in this case the carrying capacity of the environment).
Carrying Capacity Nu m J-shaped curve (exponential growth) Carrying Capacity (k) b S-shaped curve (logistic growth) e r Time
2 Life History Patterns 1. R Strategists § § § short life span small body size reproduce quickly have many young little parental care Ex: cockroaches, weeds, bacteria
2 Life History Patterns 2. K Strategists § long life span § large body size § reproduce slowly § have few young § provides parental care § Ex: humans, elephants
Survivorship Curves
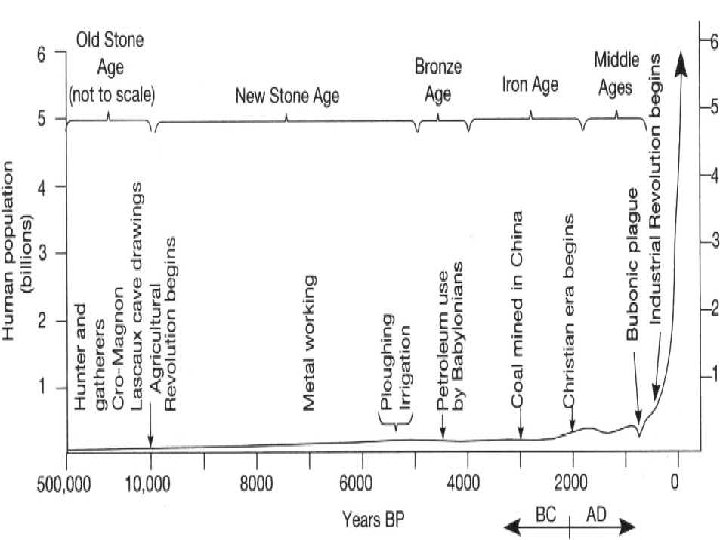
Human Population Growth
Human Population Growth
Other factors that affect population growth Limiting factor- any biotic or abiotic factor that restricts the existence of organisms in a specific environment. n EX. - Amount of water Amount of food Temperature
Limiting Factor- Zone of Tolerance None Few organisms present Many organisms present Few None organisms present
Current Human Population Trends Global human population is currently over 7 billion. Globally, the population is still increasing. Most growth is occurring in the developing world. Earth’s carrying capacity is 9 -10 billion due to available food.
Current Human Population Trends China is currently the most populous country at around 1. 4 billion people, followed closely by India’s population will surpass China’s by 2050 due to a higher growth rate. The US is 3 rd in terms of population at over 325 million people.
Current Human Population Trends
Controlling Population Growth Demographers believe growth can be slowed by: 1) Education (family planning) 2) Reducing poverty 3) Increasing women’s status