Area of a Plane Region We know how


- Slides: 51
Area of a Plane Region • We know how to find the area inside many geometric shapes, like rectangles and triangles. • We will now consider finding the area under a curve. • The following example will be instructive in developing a general procedure.
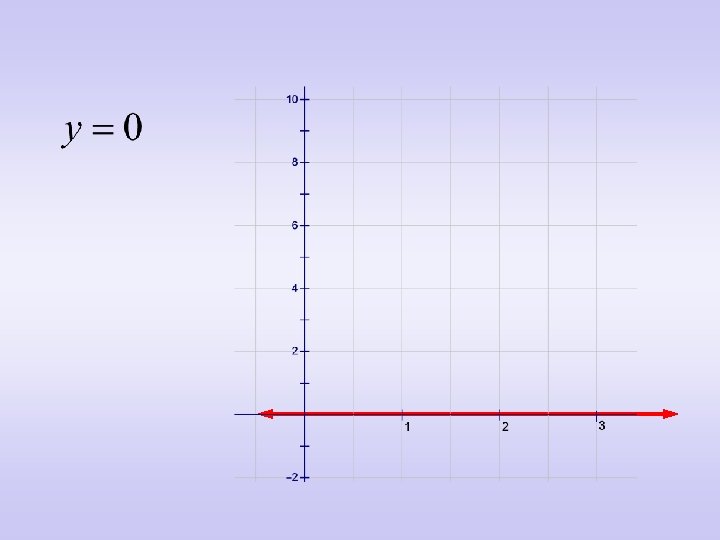
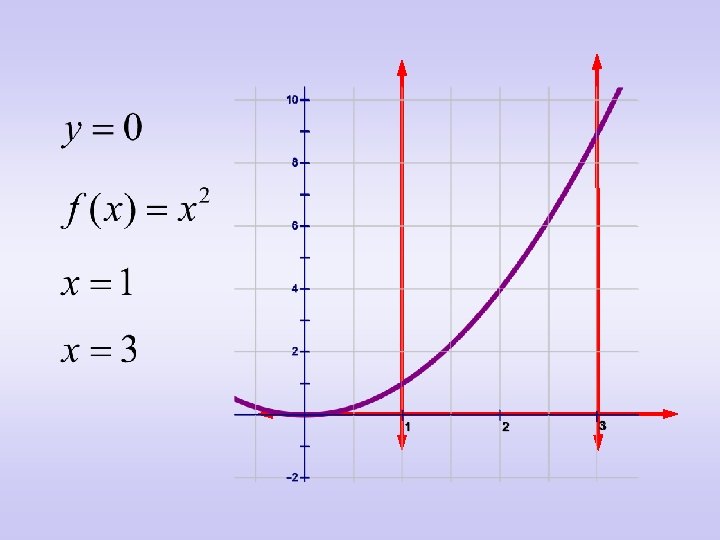
Area of a Plane Region • Find the approximate area of the region bounded by the graphs of:
• The area we are trying to find is enclosed by the four curves.
• We begin by dividing the interval from x = 1 to x = 3 into 4 equal subintervals. • Each of these subintervals are 0. 5 units wide.
• In general, if there are n equal subintervals from x = a to x = b, the width of each will be
• In general, where i is the ith subinterval, the left endpoint of each interval can be determined by:
• Using the formula in the current example, the left end points are:
4 equal subintervals
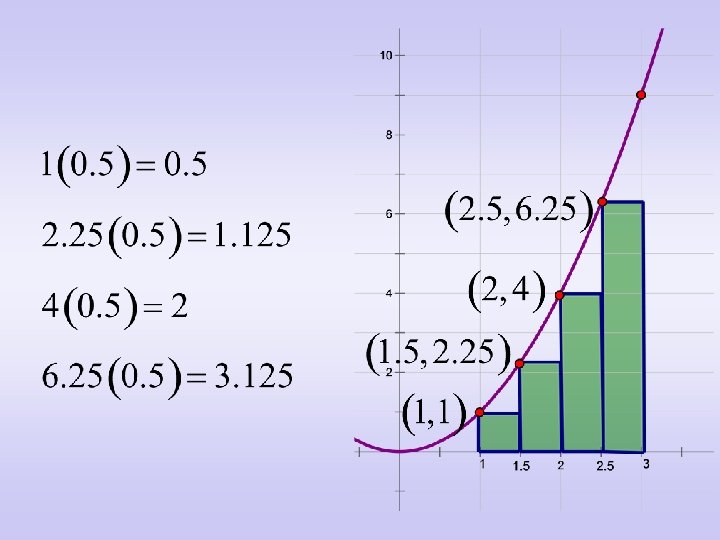
• Draw a rectangle in each subinterval, with the left side of the rectangle touching the curve. • Then find the height of each rectangle.
• To do this, use the left endpoint of each interval in the function
• Find the area of each rectangle. • This will be accomplished by multiplying the height (function value) times the width (always 0. 5 in this example).
• In general, to find the area of the ith rectangle with left endpoints, use the following:
• Find the total area of all the rectangles:
• Using sigma notation, the sum can be written as:
• The sum that we just found is called a Lower Sum since the rectangles are inscribed rectangles (all of them were below the curve).
• In general, to find the sum of the areas of all the rectangles using left endpoints, use the following:
Summary • Width of Intervals:
Summary • Left endpoint of the ith subinterval:
Summary • Area of the ith rectangle using left endpoints:
Summary • Total area of inscribed rectangles using left endpoints:
• Note that the area found using the rectangles is just an approximation of the actual area we wanted.
• Since the area found is less than the actual area, let’s repeat the process, only this time using the right endpoints.
• The width of each subinterval will be the same as before: • Each of the subintervals are 0. 5 units wide.
• In general, where i is the ith subinterval, the right endpoint of each interval can be determined by:
• Using the formula in the current example, the right end points are:
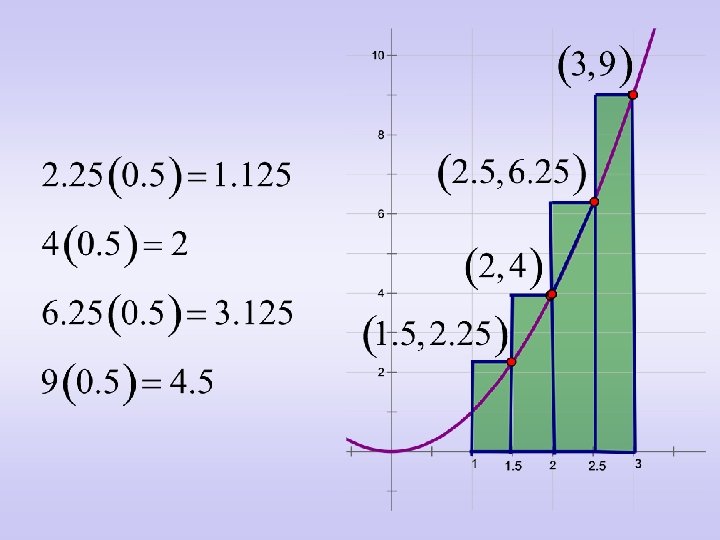
• Draw a rectangle in each subinterval, with the right side of the rectangle touching the curve. • Then find the height of each rectangle.
• To do this, use the right endpoint of each interval in the function
• Find the area of each rectangle. • This will be accomplished by multiplying the height (function value) times the width (always 0. 5 in this example).
• In general, to find the area of the ith rectangle with right endpoints, use the following:
• Find the total area of all the rectangles:
• Using sigma notation, the sum can be written as:
• The sum that we just found is called a Upper Sum since the rectangles are circumscribed rectangles (all of the tops of the rectangles are above the curve).
• In general, to find the sum of the areas of all the rectangles using right endpoints, use the following:
Summary • Width of Intervals:
Summary • Right endpoint of the ith subinterval:
Summary • Area of the ith rectangle using right endpoints:
Summary • Total area of circumscribed rectangles using right endpoints:
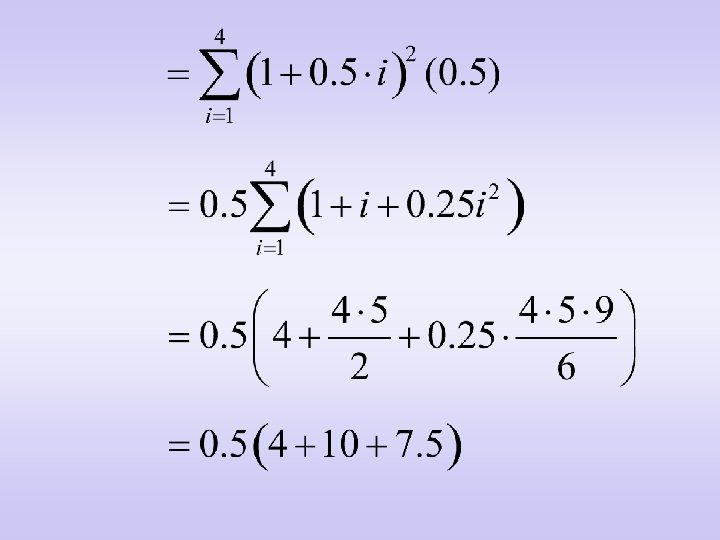
• Rather than calculating the area of each rectangle and finding the sum, we can use the formulas.
• Note that this is the same value found earlier in calculating the sum of the areas of the circumscribed rectangles.
• Once again the area found using the rectangles is just an approximation of the actual area we wanted.
• In this case the approximation turns out to be larger than the actual area.
Area • Left Endpoints • Right Endpoints
Conclusion • We know the actual area is between 6. 75 sq units and 10. 75 sq units. This isn’t very “close”. How do we get a better estimate? • There are two possibilities: 1. Use rectangles that are closer to estimating the area. In the current example, using the midpoint of the interval would give a better estimate. 2. Use more rectangles. It can be shown that as the number of rectangles approaches infinity, the area will be exact.
Definition of the Area of a Region in the Plane • Let function f be continuous and nonnegative on the interval [a, b] • The area of the region bounded by the graph of f, the x-axis, and the vertical lines x = a and x = b is given by:
Definition of the Area of a Region in the Plane • This is stating that ci can be any point in the interval, including the left or right endpoints. • This is the width of each interval.
Definition of the Area of a Region in the Plane Let the number of rectangles approach infinity Area of Rectangle (height times width) Add up all the areas of all the rectangles