Annual Return School Dental Clinics 2017 Gampaha District


 Grade 7 (P) District Jaela Gampaha 7% 6% 6%")
 Grade 7 (P) District Negombo Mirigama 7% 9% 8%")


 30% 35% 30% 15% 12% 15%")


")


 2936 Mercury (g) 2688")


- Slides: 46
Annual Return- School Dental Clinics – 2017 Gampaha District 8 th of March 2018 Family Health Bureau
Gampaha District Ø Population Ø Birth Rate per 1000 population Ø MOH Areas 2, 445, 213 14. 6 15
Basic data RDHS Division Gampaha No. of MOH areas 14 No of Schools 544 No. of school dental clinics 35 No. of school Dental Therapists 36 Target group SDT : student ratio (SDT/target) Grade 1 Grade 4 Grade 7 Other 29309 31506 30240 9800 2802 MOH without SDC 01 MOH without SDT 01 No. SDT of vacancies 05 Total 100855
Target Groups MOH Area No. No of of of Schools SDC SDT No. of children in the target group Gr. 01 Gr. 04 Gr. 07 Other grades Total SDT student ratio (total/ sdt) Attanagalla 4 4 48 2454 2537 2320 1091 8402 2101 Biyagama 1 2 29 1957 2318 1871 513 6659 3330 Diulapitiya 3 3 55 2136 2218 1809 1433 7596 2532 Dompe 3 3 46 2172 2371 1912 874 7329 2443 Gampaha 5 5 50 2976 3333 3711 688 10708 2142 Jaela 1 1 31 2178 2292 2220 324 7014 Katana 1 1 25 1211 1165 1227 286 3889 Kelaniya 2 2 27 1922 2190 2439 85 6636 3318
Target Groups MOH Area No. No of of of Schools SDC SDT No. of children in the target group Gr. 01 Gr. 04 Gr. 07 Other grades Total SDT student ratio (total/ sdt) Mahara 2 3 41 2165 2396 2132 385 7078 2359 Minuwangoda 2 2 55 2437 2476 2462 1711 9086 4543 Mirigama 3 4 54 1980 2053 2166 1625 7824 1956 Negombo 4 3 37 3040 3206 3326 277 9846 3282 Seeduwa 2 1 20 1001 1017 790 405 3213 Wattala 2 2 26 1680 1934 1858 103 5575 2788
WORK PERFORMANCE OF SCHOOL DENTAL SERVICE
% Screened % Completed District Negombo Mirigama Minuwangoda Mahara Kelaniya Katana Jaela Gampaha Dompe Divulapitiya Biyagama 100% 100% 100% 99% 97% 100% 98% 96% 94% 93% 91% 90% 93% 100% 98% 96% 102% 100% 98% 96% 94% 92% 90% 88% 86% 84% Attanagalla School coverage
100% Wattala 100% 101% Seeduwa School coverage 99% 100% 99% 98% 97% 97% 96% District 96% % Screened % Completed
40% 20% 0% Grade 1 Grade 4 Grade 7 total District Jaela Gampaha 91% 93% 90% 91% 85% 80% 73% 84% 95% 97% 95% 87% Dompe 70% 120% 97% 98% 94% 96% Diulapitiya 95% 94% Biyagama 60% 96% 95% 94% 96% 80% Attanagalla 100% 93% 91% 88% 92% Screening Coverage (Out of target)
Grade 1 Grade 4 Grade 7 total District Negombo Mirigama 86% 84% Minuwangoda Mahara 92% 97% 96% 91% 93% 90% 91% 94% 92% 93% 92% 92% 94% 93% 87% 88% 90% 89% Kelaniya 94% Katana 99% 90% Screening Coverage (Out of target) 79% 74%
86% 89% 91% 93% 90% 91% 94% District Wattala 87% 91% Seeduwa 85% 98% 96% 94% 92% 90% 88% 86% 84% 82% 80% 78% 97% 95% Screening Coverage (Out of target) Grade 1 Grade 4 Grade 7 total
Grade 1 Grade 4 Grade 7 42% 38% 49% 44% 42% 42% 65% 81% 72% 66% 61% 90% District Jaela Gampaha Dompe 30% 37% 28% 69% 70% Diulapitiya 40% 34% 72% 80% Biyagama 50% Attanagalla 60% 47% 42% % of healthy children (out of screened) 20% 10% 0%
Grade 1 Grade 4 41% 44% 42% 38% Negombo District Grade 7 65% 83% 76% 67% 61% 54% Mirigama 36% 28% 38% 41% 37% 45% 37% 41% 31% Minuwangoda Mahara Kelaniya Katana 90% 80% 70% 60% 50% 40% 30% 20% 10% 0% 50% % of healthy children (out of screened)
58% 70% 42% 38% 27% 30% 38% 40% 44% 47% 60% 50% 65% % of healthy children (out of screened) 20% 10% District Wattala Seeduwa 0% Grade 1 Grade 4 Grade 7
Grade 1 Grade 4 (P) Grade 7 (P) District Jaela Gampaha 7% 6% 6% 17% 12% 18% 16% 22% 30% Dompe 6% 13% 58% 56% 52% 51% 45% 63% 60% 56% 52% 50% 46% 50% Divulapitiya 5% 20% 11% 70% Biyagama 3% 10% Attanagalla 60% 51% 54% % of children with Caries (out of screened) 40% 0%
Grade 1 Grade 4 (P) Grade 7 (P) District Negombo Mirigama 7% 9% 8% 9% 17% 16% 18% 22% 23% 30% Minuwangoda 12% 56% 52% 58% 53% 59% 54% 62% 58% 59% 55% 50% 70% Mahara 5% 10% 20% Kelaniya 10% 4% 9% 50% Katana 60% 50% 46% % of children with Caries (out of screened) 40% 0%
56% 52% 60% 50% 70% 59% 56% % of children with Caries (out of screened) 50% 13% 5% 4% 10% 13% 20% 7% 30% 17% 28% 40% Grade 1 District Wattala Seeduwa 0% Grade 4 (P) Grade 7 (P)
Grade 1 Grade 4 Grade 7 District Ja ela Gampaha 1% 1% 1% 0% 4% 5% 8% 20% 17% 15% 14% 12% 11% 15% 21% 25% Dompe Divulapitiya 1% 14% 15% Biyagama 0% 0% 10% Attanagalla 5% 4% % of children with Calculus (out of screened)
0% Grade 1 Grade 4 Grade 7 District Negombo 3% 1% 0% 6% 12% 17% 16% 22% 21% 32% 35% Mirigama 2% 2% 17% 20% Minuwangoda Mahara 2% 25% 24% 30% Kelaniya 1% 10% 9% 10% 15% Katana 5% 0% % of children with Calculus (out of screened)
% of children with Calculus (out of screened) 30% 35% 30% 15% 12% 15% 20% 17% 22% 25% 1% 2% District Wattala 0% Seeduwa 5% 3% 10% Grade 1 Grade 4 Grade 7
Grade 1 Grade 4 Grade 7 Total District Ja ela Gampaha 78% 80% 83% 80% 70% 65% 73% 72% 84% 88% 90% 88% Dompe 71% 63% 62% 66% 88% 81% 88% 86% 88% 91% 90% Divulapitiya Biyagama Attanagalla 100% 90% 80% 70% 60% 50% 40% 30% 20% 10% 0% 75% 72% 78% 75% Coverage percentage [(Healthy + Rx completion)x 100/target group]
100% Negombo Grade 4 Grade 7 Total District 83% 86% 89% Mirigama Grade 1 78% 80% 83% 80% 72% 81% 87% 79% Minuwangoda 0% 69% 71% 84% 71% 20% Mahara 40% 88% 85% 87% 60% Kelaniya 80% 75% 80% 84% 80% Katana 120% 96% 92% Coverage percentage [(Healthy + Rx completion)x 100/target group]
Coverage percentage 78% 80% 83% 80% 68% 78% 63% 70% District Wattala Seeduwa 90% 80% 70% 60% 50% 40% 30% 20% 10% 0% 73% 81% 84% 79% [(Healthy + Rx completion)x 100/target group] Grade 1 Grade 4 Grade 7 Total
Health promotion activities - district Total number of children in the target group 100855 Total no. of sessions 2494 Total no. educated Children 83717 Parents 16930 Teachers 2302
Progress- % of children with Caries - 2011 Children with caries(1, 4, 7 Total) 56%
Progress- % of children with Caries 0. 7 0. 6 55% 0. 5 17% 8% 7% 12% 18% 8% 13% 7% 4% 5% 0. 1 11% 0. 2 13% 22% 0. 3 26% 0. 4 Grade 1(2011) Grade 4 (2014) Grade 4 (P)(2014) District Ja ela Gampaha Dompe Divulapitiya Biyagama Attanagalla 0 Grade 7 (P)(2017)
60% 57% 65% 61% 0. 6 53% 0. 7 56% Progress- % of children with Caries 0. 5 17% 8% 8% 16% 18% 8% 13% 11% 0. 1 4% 10% 0. 2 10% 9% 0. 3 22% 23% 0. 4 Grade 1(2011) Grade 4 (2014) Grade 4 (P)(2014) District Negombo Mirigama Minuwangoda Mahara Kelaniya Katana 0 Grade 7 (P)(2017)
0. 6 52% 0. 7 57% 65% Progress- % of children with Caries 0. 5 0. 4 17% 13% 8% 0. 1 5% 0. 2 9% 13% 0. 3 Grade 1(2011) District Wattala Seeduwa 0 Grade 4 (2014) Grade 4 (P)(2014) Grade 7 (P)(2017)
Supervision RDS MOH SDDT Other Attanagalla 2 0 26 0 Biyagama 1 0 4 0 Diulapitiya 3 0 29 1 Dompe 0 0 15 0 Gampaha 4 2 36 7 Ja ela 1 1 13 0 Katana 1 0 6 0 Kelaniya 1 1 11 0 Mahara 3 1 8 0 Minuwangoda 2 3 12 1 Mirigama 8 0 40 1 Negombo 4 1 11 0
Supervision RDS MOH SDDT Other Seeduwa 0 0 5 0 Wattala 1 4 6 0
District Summary - Service coverage 90% 80% 70% 60% 50% 40% 30% 20% 10% 0% 78% 76% 77% Healthy 65% Rx completed 42% 43% 38% 13% Grade 1 9% 13% Grade 4 7% 7% Rx not completed 37% 11% 9% 10% Grade 7 Total target SDT student ratio: (Number of target students) /SDT Achieved screening coverage Unscreened =2802 =91% (100 -Unscreened) Achieved coverage percentage (Healthy + Rx Completed) =80% Expected screening /coverage = 2000 x 100 /SDT ratio =71
District summary - Material usage Materials used Amalgam powder (g) 2936 Mercury (g) 2688 GIC (g) 2750 Total no. of Amalgam fillings 8474 Total no. of GIC fillings 35599 Ave amount of fillings done by a material pack (no of fillings/material used) Amalgam (10 g bottle) Mercury (30 g bottle) GIC (15 g powder packs) 293. 4 89. 6 183. 3
District summary - Average number of patients seen 1 Total no. of SDTT in the district 36 2 Total no. of days worked (Qt. 19. 1) 7440 3 Total no. days on leave (Qt 19. 2) 1227 4 Total number patients seen (Qt 14. 3) 146533 5 Ave. number of pts seen per day in the District (4/2) 20 6 Ave. number of pts see/SDT/day (4/1/2) 20
District summary - Approximate ave. cost per patient 1 Salaries 2 Material used (from material stocks)*** 3 Total cost 4 Total no. of children seen in the district (Qtr 14. 3) 5 Average cost per patient (3/4) All SDTs(36) Rs. 16200000 All Assistants(32) 10240000 Amalgam 2936 g Mercury 2688 g GIC 2750 g Transport (for mobile programmes) 936058 1412245 28788303 146533 196
Special activities • Annual Review of School Dental Service in Gampaha District for 2016
Special activities • In-service training programme for SDT & SDC Assistants – 2017. 08. 31
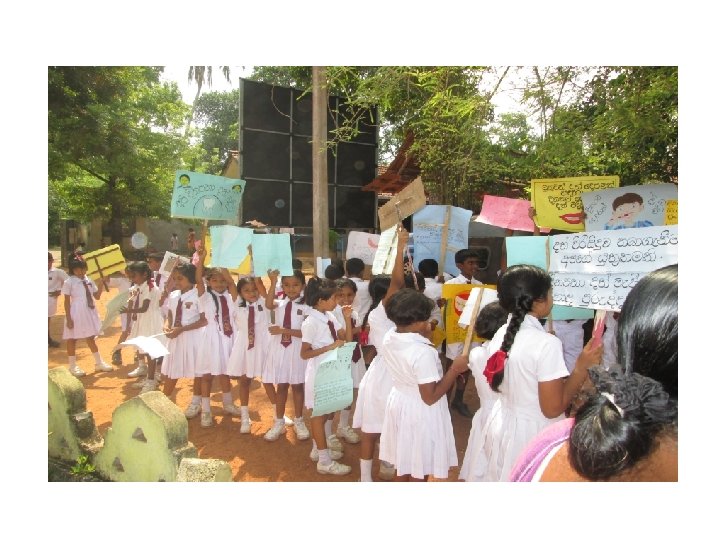
Special activities • Conducting oral health promotion programmes for early childhood teachers in Gampaha RDHS area - 3 programmes 2017. 07. 24 / 2017. 07. 28 / 2017. 07. 31
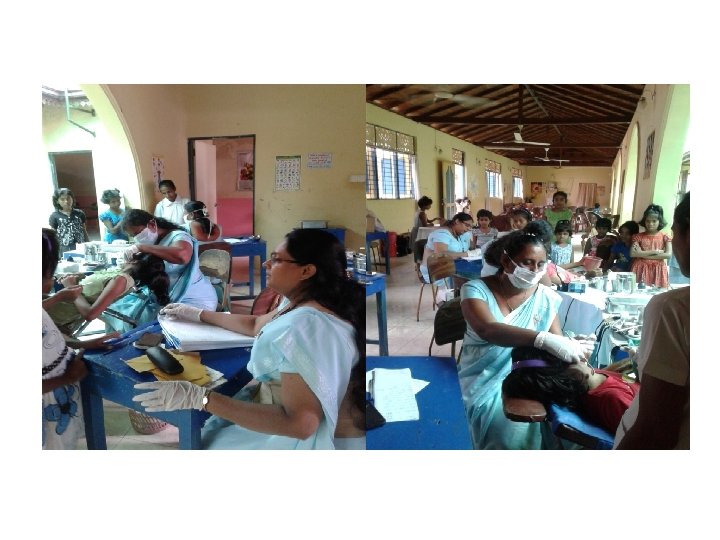
Special activities • Implementation of Prevention oriented oral care programme for institutionalized children (Orphanage & Rehabilitation) – 5 programmes 1. Peeter wirasekara orphanage, Dabuwa – 2017. 11 2. Center for youth offenders, Dalupotha, Negombo – 2017. 11. 13 3. Rammuthugala Rehabilitation center – 2017. 11. 17 4. Center for street children, Negombo – 2017. 11. 24 5. Rehabilitation center, Nawadiganthaya – 2017. 11. 30
Problems, constrains and suggestions • Urgent repairs to be done for following School Dental Clinics 1. Madduma Bandara Vidyalaya, Waliweriya 2. Raddolugama Health center 3. Central College, Kirindiwela 4. Kuruwamulla M. V 5. St’Maris College , Veyangoda 6. Dudly Senanayaka Vidyalaya , Meerigama 7. Horampalla M. V, Minuwangoda 8. Senarath Paranavithana Vidyalaya, Udugampola 9. St’Maris College, Bandarawaththa, Seeduwa
Problems, constrains and suggestions 10. Pitipana M. V , Negombo 11. Maristella College, Negombo 12. Bopitiya K. V, Pamunugama 13. Roman Catholic Tamil Vidyalaya, Wattala 14. St’Francis College, Dalugama 15. Central college, Galahitiyawa
Problems, Constrains and Suggestions
Problems, Constrains and Suggestions
Problems, Constrains and Suggestions • Poor Drugs & materials Distribution • Minimum supply of Burs for Contrangular Hand Pieces • Difficulty to maintain proper sterilization procedures • Urgent Repairs of Equipments are problems due to the absences o f trained staff(No BME) • Transport for Mobile Programmes • Vacancies for School Dental Therapists(Most of SDTs cover more than 4000 target group) • Transport Problems for Supervisions
Thank You!