
PARCC Results Year One Southampton Township School District


- Slides: 24
PARCC Results: Year One Southampton Township School District Measuring College and Career Readiness December 14, 2015
Vision for Public Education in New Jersey “New Jersey will educate all students to prepare them to lead productive, fulfilling lives. Through a public education system that is seamlessly aligned from pre-school to college, students will gain the requisite academic knowledge and technical and critical thinking skills for life and work in the 21 st century. ”
College and Career Ready Standards “Align New Jersey high school standards and graduation requirements to college and workforce entry requirements. ” – NJ High School Redesign Steering Committee (HSRSC - 2008) New Jersey has adopted standards that “are widely recognized as appropriate standards for college and career readiness. ” - College and Career Ready Taskforce (CCRT - 2009: New Jersey adopted higher course taking requirements for all students. 2010: New Jersey adopted the Common Core State Standards in English Language Arts and Mathematics. Raising standards
NJ Statewide Assessment Program � In 2015, New Jersey adopted the PARCC to replace HSPA and previous assessments in the elementary and middle school in language arts and mathematics. � Students took PARCC English Language Arts and Literacy Assessments (ELA/L) in grades 3 – 11. � Students took PARCC Mathematics Assessments in grades 3 – 8 and End of Course Assessments in Algebra I, Geometry, and Algebra II.
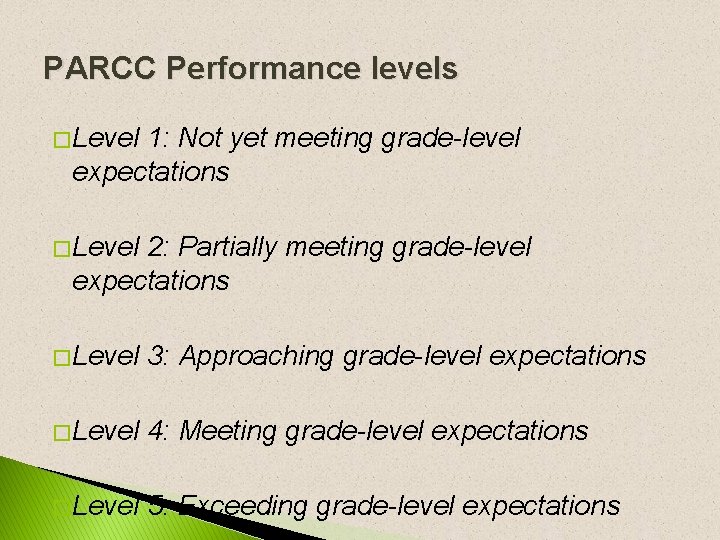
PARCC Performance levels � Level 1: Not yet meeting grade-level expectations � Level 2: Partially meeting grade-level expectations � Level 3: Approaching grade-level expectations � Level 4: Meeting grade-level expectations � Level 5: Exceeding grade-level expectations
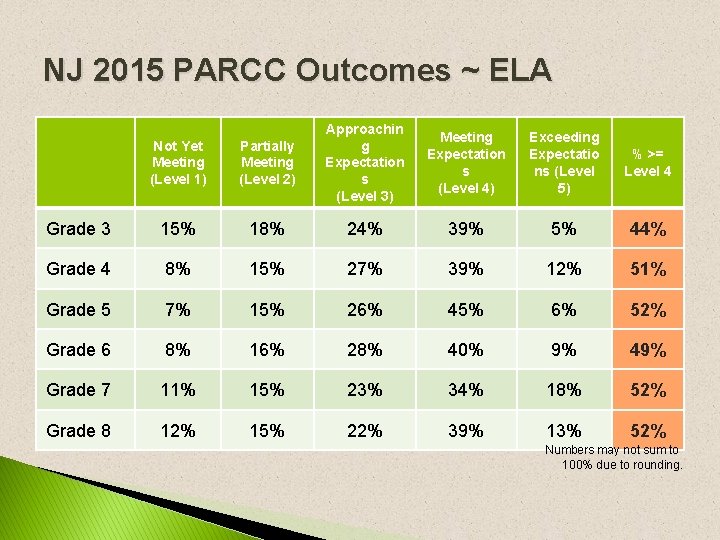
NJ 2015 PARCC Outcomes ~ ELA Not Yet Meeting (Level 1) Partially Meeting (Level 2) Approachin g Expectation s (Level 3) Grade 3 15% 18% 24% 39% 5% 44% Grade 4 8% 15% 27% 39% 12% 51% Grade 5 7% 15% 26% 45% 6% 52% Grade 6 8% 16% 28% 40% 9% 49% Grade 7 11% 15% 23% 34% 18% 52% Grade 8 12% 15% 22% 39% 13% 52% Meeting Expectation s (Level 4) Exceeding Expectatio ns (Level 5) % >= Level 4 Numbers may not sum to 100% due to rounding.
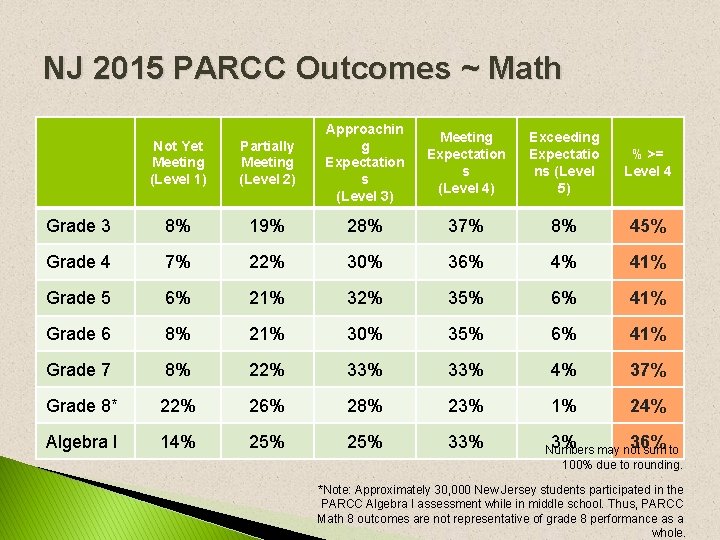
NJ 2015 PARCC Outcomes ~ Math Not Yet Meeting (Level 1) Partially Meeting (Level 2) Approachin g Expectation s (Level 3) Grade 3 8% 19% 28% 37% 8% 45% Grade 4 7% 22% 30% 36% 4% 41% Grade 5 6% 21% 32% 35% 6% 41% Grade 6 8% 21% 30% 35% 6% 41% Grade 7 8% 22% 33% 4% 37% Grade 8* 22% 26% 28% 23% 1% 24% Algebra I 14% 25% 33% 3% 36% Meeting Expectation s (Level 4) Exceeding Expectatio ns (Level 5) % >= Level 4 Numbers may not sum to 100% due to rounding. *Note: Approximately 30, 000 New Jersey students participated in the PARCC Algebra I assessment while in middle school. Thus, PARCC Math 8 outcomes are not representative of grade 8 performance as a whole.
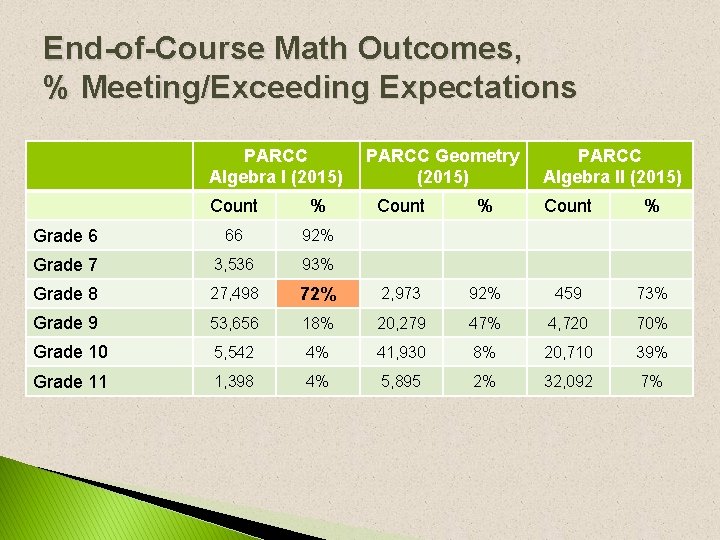
End-of-Course Math Outcomes, % Meeting/Exceeding Expectations PARCC Algebra I (2015) Count % Grade 6 66 92% Grade 7 3, 536 93% Grade 8 27, 498 Grade 9 PARCC Geometry (2015) PARCC Algebra II (2015) Count % 72% 2, 973 92% 459 73% 53, 656 18% 20, 279 47% 4, 720 70% Grade 10 5, 542 4% 41, 930 8% 20, 710 39% Grade 11 1, 398 4% 5, 895 2% 32, 092 7%
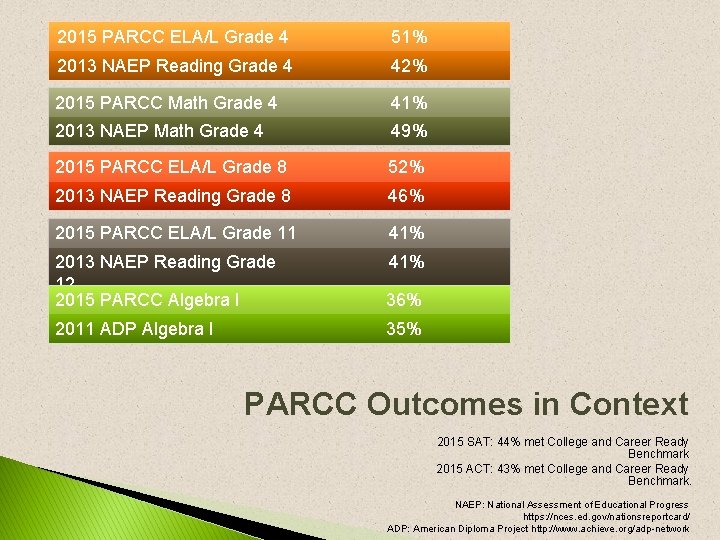
2015 PARCC ELA/L Grade 4 51% 2013 NAEP Reading Grade 4 42% 2015 PARCC Math Grade 4 41% 2013 NAEP Math Grade 4 49% 2015 PARCC ELA/L Grade 8 52% 2013 NAEP Reading Grade 8 46% 2015 PARCC ELA/L Grade 11 41% 2013 NAEP Reading Grade 12 2015 PARCC Algebra I 41% 36% 2011 ADP Algebra I 35% PARCC Outcomes in Context 2015 SAT: 44% met College and Career Ready Benchmark 2015 ACT: 43% met College and Career Ready Benchmark. NAEP: National Assessment of Educational Progress https: //nces. ed. gov/nationsreportcard/ ADP: American Diploma Project http: //www. achieve. org/adp-network
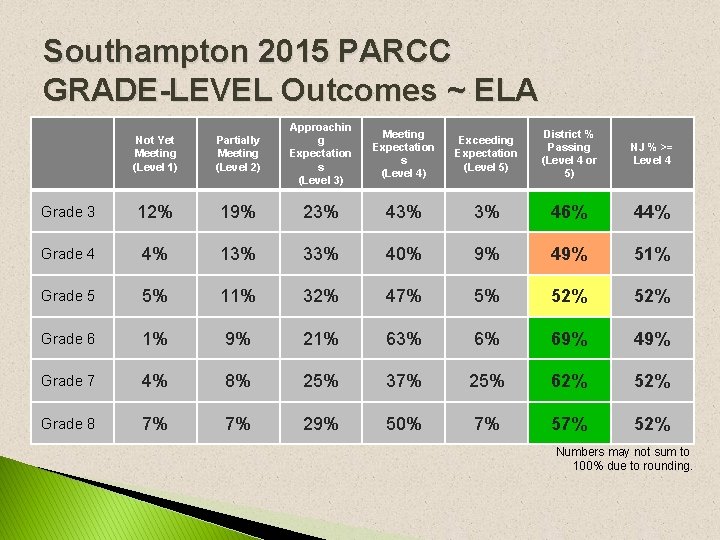
Southampton 2015 PARCC GRADE-LEVEL Outcomes ~ ELA Not Yet Meeting (Level 1) Partially Meeting (Level 2) Approachin g Expectation s (Level 3) Grade 3 12% 19% 23% 43% 3% 46% 44% Grade 4 4% 13% 33% 40% 9% 49% 51% Grade 5 5% 11% 32% 47% 5% 52% Grade 6 1% 9% 21% 63% 6% 69% 49% Grade 7 4% 8% 25% 37% 25% 62% 52% Grade 8 7% 7% 29% 50% 7% 52% Meeting Expectation s (Level 4) Exceeding Expectation (Level 5) District % Passing (Level 4 or 5) NJ % >= Level 4 Numbers may not sum to 100% due to rounding.
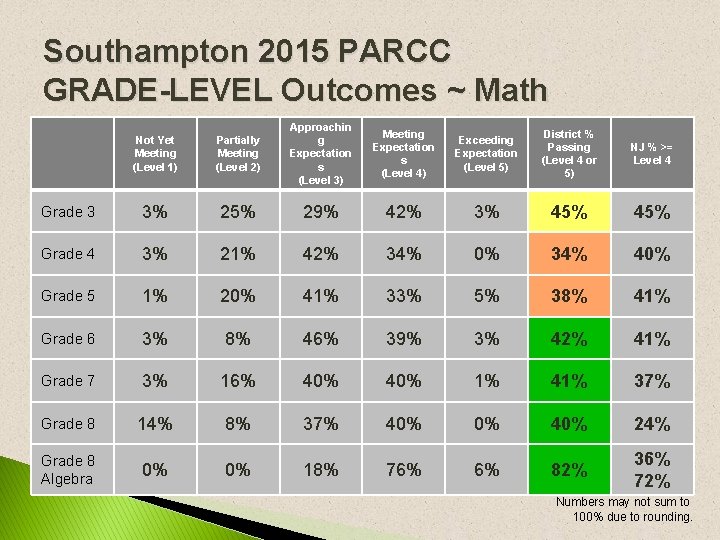
Southampton 2015 PARCC GRADE-LEVEL Outcomes ~ Math Not Yet Meeting (Level 1) Partially Meeting (Level 2) Approachin g Expectation s (Level 3) Grade 3 3% 25% 29% 42% 3% 45% Grade 4 3% 21% 42% 34% 0% 34% 40% Grade 5 1% 20% 41% 33% 5% 38% 41% Grade 6 3% 8% 46% 39% 3% 42% 41% Grade 7 3% 16% 40% 1% 41% 37% Grade 8 14% 8% 37% 40% 0% 40% 24% Grade 8 Algebra 0% 0% 18% 76% 6% 82% 36% 72% Meeting Expectation s (Level 4) Exceeding Expectation (Level 5) District % Passing (Level 4 or 5) NJ % >= Level 4 Numbers may not sum to 100% due to rounding.
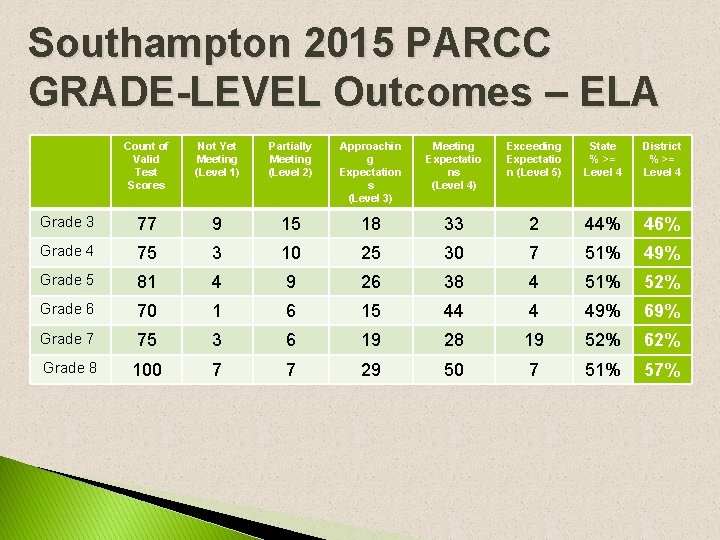
Southampton 2015 PARCC GRADE-LEVEL Outcomes – ELA Count of Valid Test Scores Not Yet Meeting (Level 1) Partially Meeting (Level 2) Approachin g Expectation s (Level 3) Meeting Expectatio ns (Level 4) Exceeding Expectatio n (Level 5) State % >= Level 4 District % >= Level 4 Grade 3 77 9 15 18 33 2 44% 46% Grade 4 75 3 10 25 30 7 51% 49% Grade 5 81 4 9 26 38 4 51% 52% Grade 6 70 1 6 15 44 4 49% 69% Grade 7 75 3 6 19 28 19 52% 62% Grade 8 100 7 7 29 50 7 51% 57%
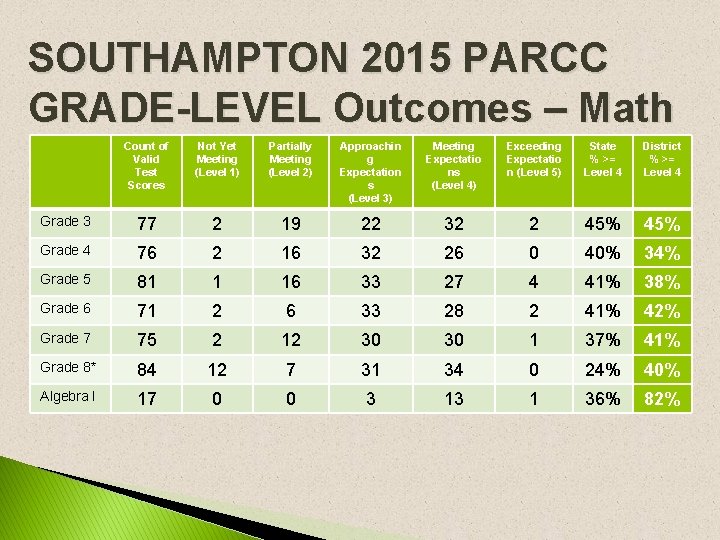
SOUTHAMPTON 2015 PARCC GRADE-LEVEL Outcomes – Math Count of Valid Test Scores Not Yet Meeting (Level 1) Partially Meeting (Level 2) Approachin g Expectation s (Level 3) Meeting Expectatio ns (Level 4) Exceeding Expectatio n (Level 5) State % >= Level 4 District % >= Level 4 Grade 3 77 2 19 22 32 2 45% Grade 4 76 2 16 32 26 0 40% 34% Grade 5 81 1 16 33 27 4 41% 38% Grade 6 71 2 6 33 28 2 41% 42% Grade 7 75 2 12 30 30 1 37% 41% Grade 8* 84 12 7 31 34 0 24% 40% Algebra I 17 0 0 3 13 1 36% 82%
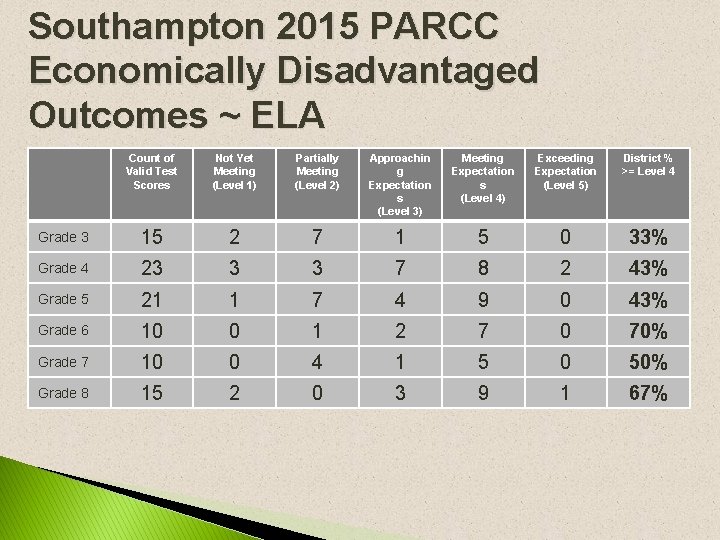
Southampton 2015 PARCC Economically Disadvantaged Outcomes ~ ELA Count of Valid Test Scores Not Yet Meeting (Level 1) Partially Meeting (Level 2) Approachin g Expectation s (Level 3) Meeting Expectation s (Level 4) Exceeding Expectation (Level 5) District % >= Level 4 Grade 3 15 2 7 1 5 0 33% Grade 4 23 3 3 7 8 2 43% Grade 5 21 1 7 4 9 0 43% Grade 6 10 0 1 2 7 0 70% Grade 7 10 0 4 1 5 0 50% Grade 8 15 2 0 3 9 1 67%
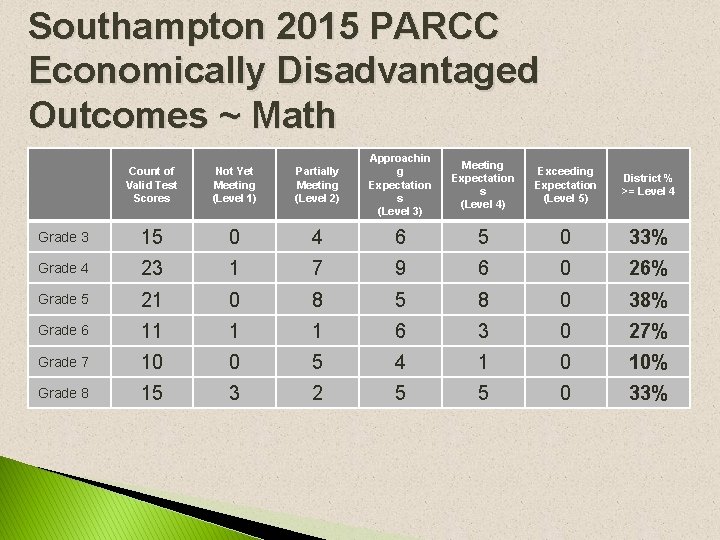
Southampton 2015 PARCC Economically Disadvantaged Outcomes ~ Math Count of Valid Test Scores Not Yet Meeting (Level 1) Partially Meeting (Level 2) Approachin g Expectation s (Level 3) Meeting Expectation s (Level 4) Exceeding Expectation (Level 5) District % >= Level 4 Grade 3 15 0 4 6 5 0 33% Grade 4 23 1 7 9 6 0 26% Grade 5 21 0 8 5 8 0 38% Grade 6 11 1 1 6 3 0 27% Grade 7 10 0 5 4 1 0 10% Grade 8 15 3 2 5 5 0 33%
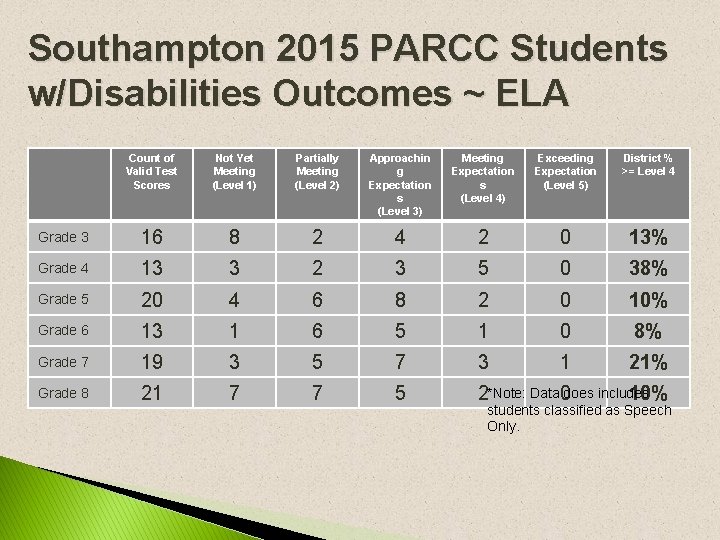
Southampton 2015 PARCC Students w/Disabilities Outcomes ~ ELA Count of Valid Test Scores Not Yet Meeting (Level 1) Partially Meeting (Level 2) Approachin g Expectation s (Level 3) Meeting Expectation s (Level 4) Exceeding Expectation (Level 5) District % >= Level 4 Grade 3 16 8 2 4 2 0 13% Grade 4 13 3 2 3 5 0 38% Grade 5 20 4 6 8 2 0 10% Grade 6 13 1 6 5 1 0 8% Grade 7 19 3 5 7 3 1 21% Grade 8 21 7 7 5 2*Note: Data 0 does includes 10% students classified as Speech Only.
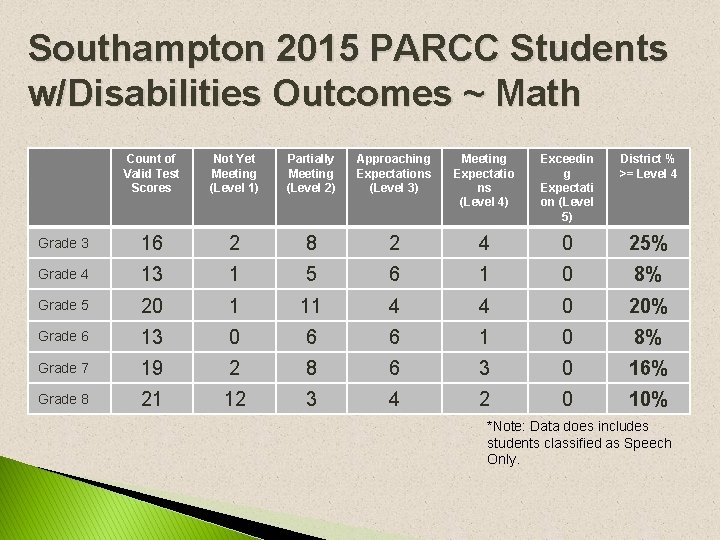
Southampton 2015 PARCC Students w/Disabilities Outcomes ~ Math Count of Valid Test Scores Not Yet Meeting (Level 1) Partially Meeting (Level 2) Approaching Expectations (Level 3) Meeting Expectatio ns (Level 4) Exceedin g Expectati on (Level 5) District % >= Level 4 Grade 3 16 2 8 2 4 0 25% Grade 4 13 1 5 6 1 0 8% Grade 5 20 1 11 4 4 0 20% Grade 6 13 0 6 6 1 0 8% Grade 7 19 2 8 6 3 0 16% Grade 8 21 12 3 4 2 0 10% *Note: Data does includes students classified as Speech Only.
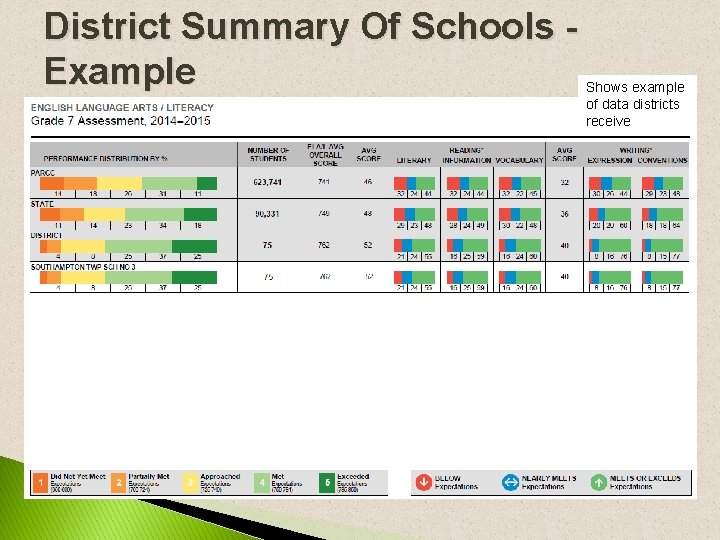
District Summary Of Schools Example Shows example of data districts receive
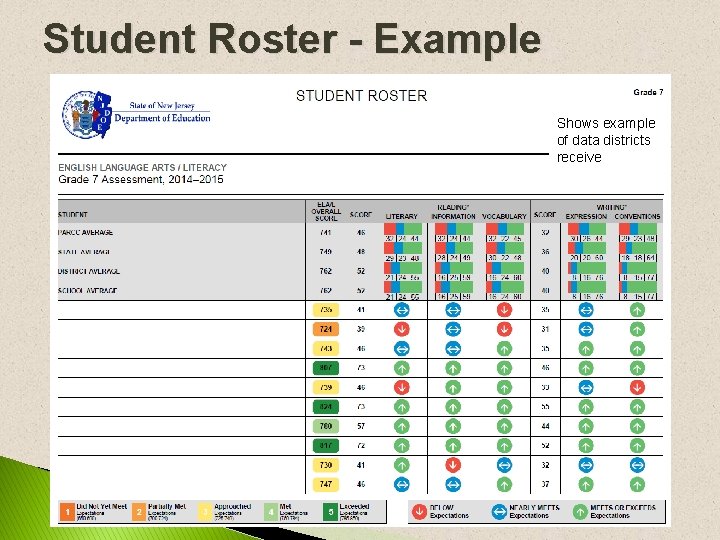
Student Roster - Example Shows example of data districts receive
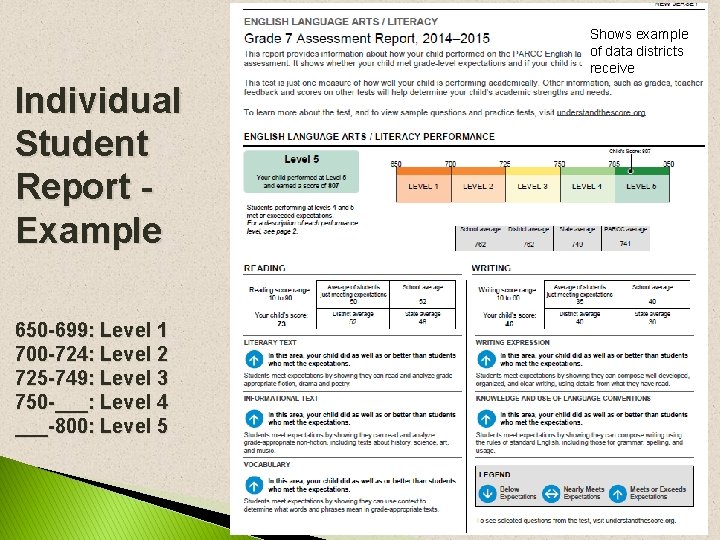
Shows example of data districts receive Individual Student Report Example 650 -699: Level 1 700 -724: Level 2 725 -749: Level 3 750 -___: Level 4 ___-800: Level 5
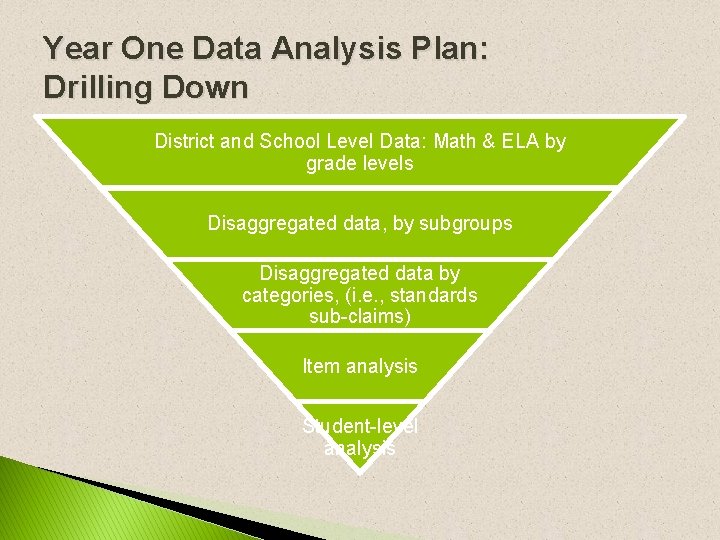
Questions to Guide PARCC Data Reflection � How will we use PARCC data to identify strengths and gaps that exist in curriculum and instruction? � How will we use PARCC data to inform the conversations of our educators? � What can we learn about where additional professional resources are needed to meet the learning needs of all students?
Year One Data Analysis Plan: Drilling Down District and School Level Data: Math & ELA by grade levels Disaggregated data, by subgroups Disaggregated data by categories, (i. e. , standards sub-claims) Item analysis Student-level analysis
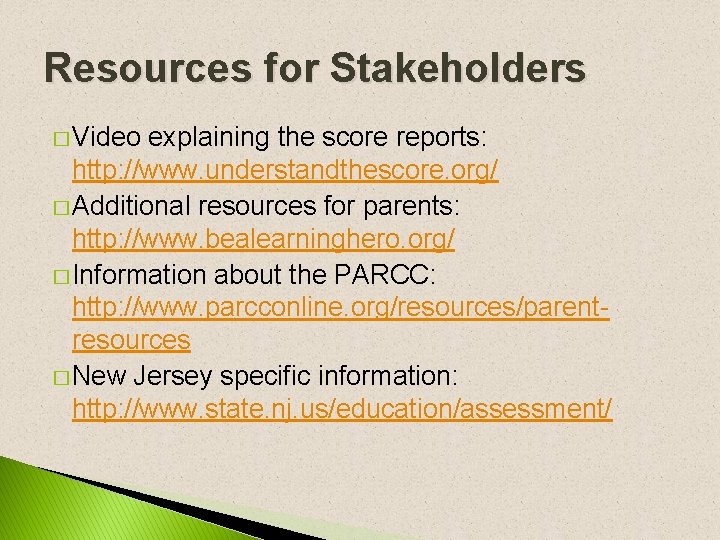
Resources for Stakeholders � Video explaining the score reports: http: //www. understandthescore. org/ � Additional resources for parents: http: //www. bealearninghero. org/ � Information about the PARCC: http: //www. parcconline. org/resources/parentresources � New Jersey specific information: http: //www. state. nj. us/education/assessment/
Thank you!!!