5483 TT 2020 2021 3 SinoAmerican Silicon Products
 2020年營運報告 2021年 3月 ©Sino-American Silicon Products Inc. All rights reserved.")
. This")


 34% 27% 37% 6 497 34% 35% 33% 35% 34%")
 (NT$mn) 24% 29% 25% 27% 24% 19% 26% 21%")
 營業收入 成長率 (%) 營業毛利率 (%) EBITDA 率 (%) 營業淨利率 (%) 稅前淨利率 (%)")
 2013 2014 2015 2016 2017 2018 2019 2020 現金及約當現金 3, 682 5,")


 Qo. Q EPS(NT$) Q 420 14, 137 0.")
 2020 2019 年成長率 營業收入 55, 359 58, 094 -4.")
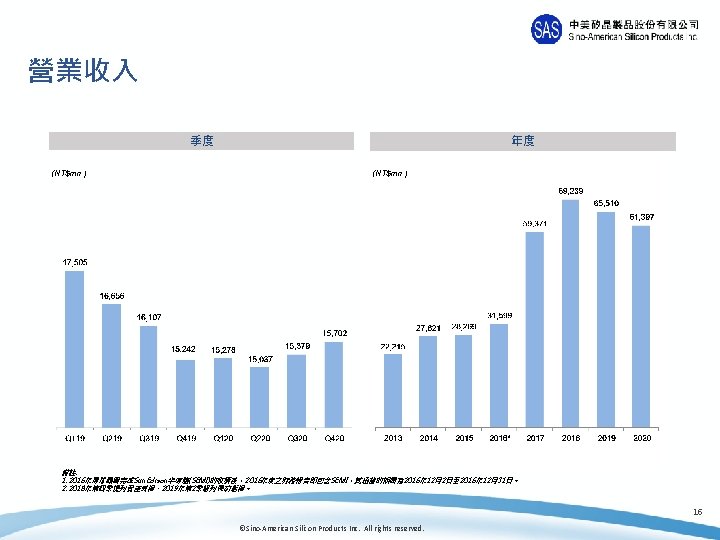
 2013 2014 2015 2016 2017 2018 2019 2020 營業收入 15, 570 15,")


- Slides: 36
中美矽晶 (5483 TT) 2020年營運報告 2021年 3月 ©Sino-American Silicon Products Inc. All rights reserved.
Disclaimer This presentation has been prepared by Sino-American Silicon Products Inc. (the “Company”). This presentation and the materials provided herewith do not constitute an offer to sell or issue or the solicitation of an offer to buy or acquire securities of the Company in any jurisdiction or an inducement to enter into investment activity, nor may it or any part of it form the basis of or be relied on in connection with any contract or commitment whatsoever. Any decision to purchase securities in a proposed offering should be made solely on the basis of the information contained in the offering circular published in relation to such proposed offering, if any. The information contained in this presentation has not been independently verified. No representation, warranty or undertaking, express or implied, is made as to, and no reliance should be placed on, the fairness, accuracy, completeness or correctness of the information or the opinions contained herein. The information contained in this document should be considered in the context of the circumstances prevailing at the time and has not been, and will not be, updated to reflect material developments which may occur after the date of the presentation. None of the Company nor any of its affiliates, advisors or representatives will be liable (in negligence or otherwise) for any loss howsoever arising from any use of this presentation or its contents or otherwise arising in connection with the presentation. 1 ©Sino-American Silicon Products Inc. All rights reserved.
太陽能與半導體事業營收占比 85% 89% 78% 90% 57% 54% 43% 46% 58% 42% 22% 15% 11% 10% 6 ©Sino-American Silicon Products Inc. All rights reserved.
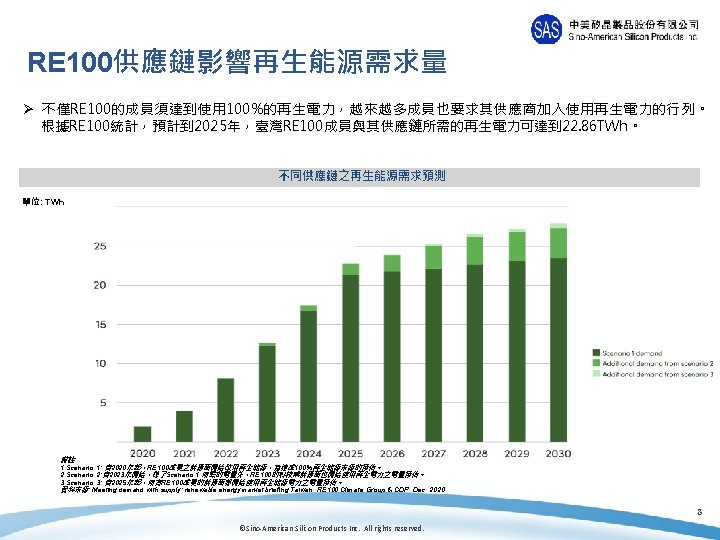
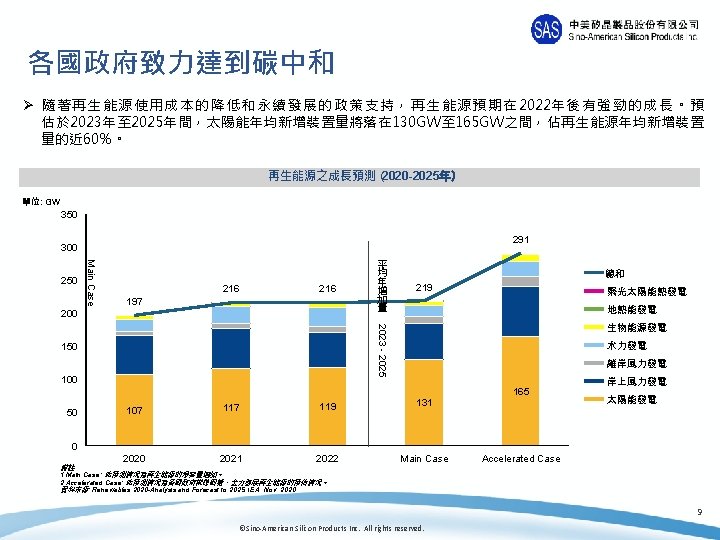
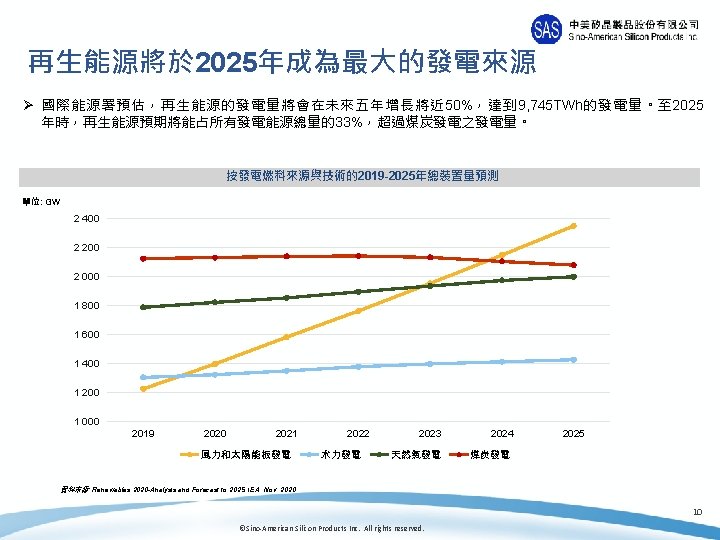
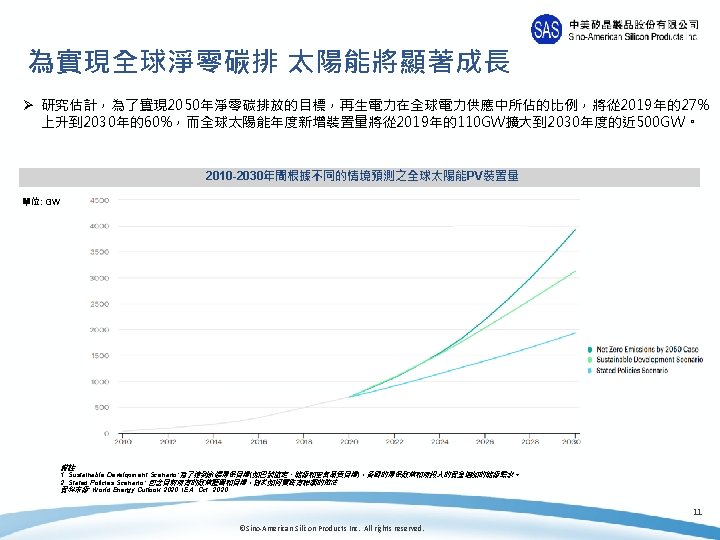
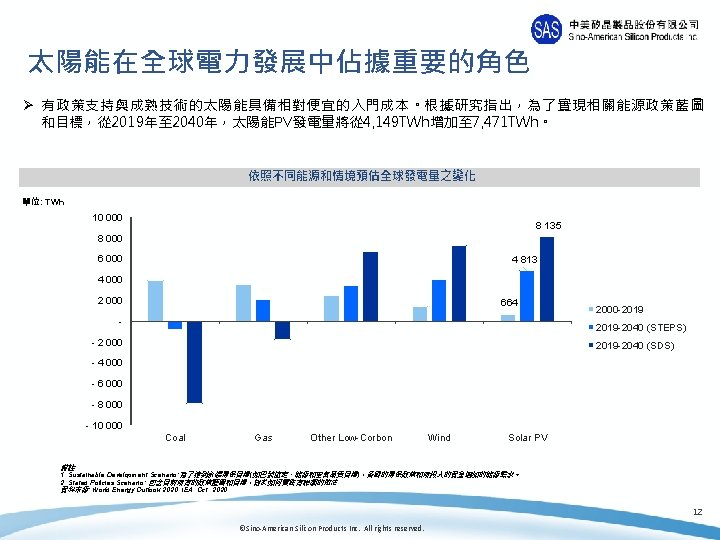
太陽能產業現況與展望 7 ©Sino-American Silicon Products Inc. All rights reserved.
中美矽晶營運報告 13 ©Sino-American Silicon Products Inc. All rights reserved.
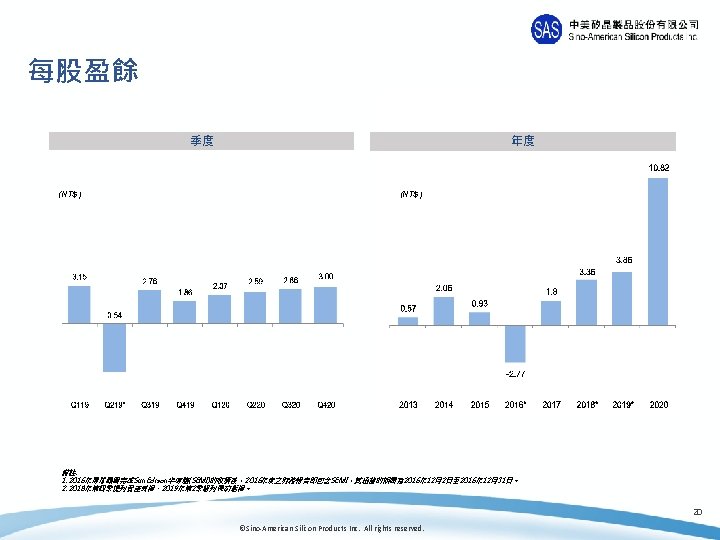
財務摘要: 2020年 vs. 2019年 2020 2019 年成長率 營業收入 61, 397 65, 510 -6. 3% EBITDA*1 22, 232 18, 668 19. 1% EBITDA % 36. 2% 28. 5% 7. 7% EBIT 16, 084 12, 049 33. 5% 營業淨利 14, 932 13, 515 10. 5% 營業淨利 % 24. 3% 20. 6% 3. 7% 本期淨利 12, 711 8, 895 42. 9% 本期淨利 % 20. 7% 13. 6% 7. 1% NT$10. 82 NT$3. 86 NT$6. 96 股東權益報酬率 /ROE*2 (年化) 25. 9% 18. 4% 7. 4% 資產報酬率 /ROA*3(年化) 11. 6% 8. 5% 3. 2% (NT$mn) 每股盈餘 備註: 1. EBITDA=本期淨利+折舊費用+攤銷費用+利息+所得稅 2. ROE = 本期淨利/股東平均權益 3 3. ROA = ((本期淨利+利息*(1 -有效稅率))/平均資產 15 ©Sino-American Silicon Products Inc. All rights reserved.
營業毛利 季度 年度 (NT$mn) 34% 27% 37% 6 497 34% 35% 33% 35% 34% 11% 13% 15% 29% 11% 21 114 18 642 19 268 2018* 2019* 11% 5 546 5 344 5 050 5 295 5 369 5, 400 11 403 6 231 2 439 Q 119 Q 219* Q 319 Q 419 Gross Margin Q 120 Q 220 Q 320 Q 420 2013 GM% 3 498 2014 4 271 2015 3 435 2016* Gross Margin 2017 2020 GM% 備註: 1. 2016年環球晶圓完成Sun. Edison半導體(SEMI)的收購後,2016年度之財務報告即包含SEMI,其涵蓋的期間為 2016年 12月2日至 2016年 12月31日。 2. 2018年第四季提列資產減損、2019年第 2季認列長約虧損。 17 ©Sino-American Silicon Products Inc. All rights reserved.
營業利益 季度 年度 (NT$mn ) (NT$mn) 24% 29% 25% 27% 24% 19% 26% 21% 3% 5 064 5% 21% 11% 8% 14 932 13 178 13, 515 0% 4% 4 038 4 082 3 747 3 977 3 706 3 212 6 325 2 237 4 973 1 447 629 Q 119 Q 219* Q 319 Q 419 Operating Profit Q 120 Q 220 Q 320 Q 420 2013 42 2014 OP% 2015 2016* 2017 Operating Profit 2018* 2019* 2020 OP% 備註: 1. 2016年環球晶圓完成Sun. Edison半導體(SEMI)的收購後,2016年度之財務報告即包含SEMI,其涵蓋的期間為 2016年 12月2日至 2016年 12月31日。 2. 2018年第四季提列資產減損、2019年第 2季認列長約虧損。 18 ©Sino-American Silicon Products Inc. All rights reserved.
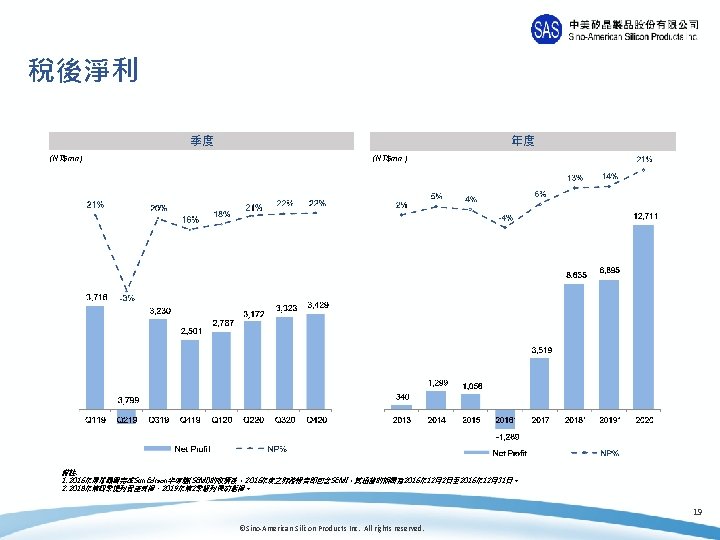
綜合損益表 (NT$百萬) 營業收入 成長率 (%) 營業毛利率 (%) EBITDA 率 (%) 營業淨利率 (%) 稅前淨利率 (%) 淨利 淨利率 (%) EPS (NT$) 2013 2014 2015 2016 2017 2018 2019 2020 22, 215 27, 821 28, 269 31, 599 59, 371 69, 239 65, 510 61, 397 20. 8% 25. 2% 1. 6% 11. 8% 87. 9% 16. 6% (5. 4%) (6. 3%) 2, 439 3, 498 4, 271 3, 435 11, 403 18, 642 19, 268 21, 114 11. 0% 12. 6% 15. 1% 10. 9% 19. 2% 26. 9% 29. 4% 34. 4% 4, 058 4, 214 4, 184 2, 052 11, 741 19, 030 18, 668 22, 232 18. 3% 15. 1% 14. 8% 6. 5% 19. 8% 27. 5% 28. 5% 36. 2% 629 1, 447 2, 236 42 6, 325 13, 178 13, 515 14, 932 2. 8% 5. 2% 7. 9% 0. 1% 10. 7% 19. 0% 20. 6% 24. 3% 128 1, 925 1, 960 (856) 5, 126 13, 318 13, 924 16, 238 0. 6% 6. 9% (2. 7%) 8. 6% 19. 2% 21. 3% 26. 4% 340 1, 299 1, 056 (1, 289) 3, 519 8, 635 8, 895 12, 711 1. 5% 4. 7% 3. 7% (4. 1%) 5. 9% 12. 5% 13. 6% 20. 7% 0. 57 2. 06 0. 93 (2. 77) 1. 80 3. 36 3. 86 10. 82 備註: 1. 2016年環球晶圓完成Sun. Edison半導體(SEMI)的收購後,2016年度之財務報告即包含SEMI,其涵蓋的期間為 2016年 12月2日至 2016年 12月31日。 2. 2018年第四季提列資產減損、2019年第 2季認列長約虧損。 21 ©Sino-American Silicon Products Inc. All rights reserved.
資產負債表 (NT$百萬) 2013 2014 2015 2016 2017 2018 2019 2020 現金及約當現金 3, 682 5, 391 5, 902 9, 269 20, 343 36, 829 34, 901 23, 813 應收帳款 4, 064 5, 019 6, 204 8, 560 8, 830 9, 881 8, 507 8, 407 存貨 4, 416 1, 607 5, 749 9, 708 10, 048 7, 881 7, 398 7, 929 不動產、廠房及設備 16, 098 15, 244 18, 905 41, 398 37, 529 37, 439 40, 277 42, 455 其他資產 11, 414 13, 627 9, 427 14, 079 12, 593 11, 955 18, 300 27, 349 資產 資產總計 39, 674 40, 887 46, 186 83, 014 89, 343 103, 985 109, 383 109, 953 負債 短期借款 2, 576 3, 486 2, 676 17, 704 14, 367 9, 335 11, 465 10, 804 應付帳款 2, 754 2, 713 2, 932 6, 328 5, 352 5, 236 4, 180 4, 204 長期借款 4, 373 3, 807 2, 546 16, 357 5, 034 2, 040 -- 1, 048 其他負債 9, 385 9, 299 9, 464 15, 399 20, 814 39, 460 45, 122 44, 227 負債總計 19, 088 19, 304 17, 617 55, 787 45, 566 56, 071 60, 767 60, 283 權益總計 20, 586 21, 583 28, 570 27, 227 43, 777 47, 914 48, 616 49, 669 備註 1. 2016年環球晶圓完成Sun. Edison半導體(SEMI)的收購後,2016年度之財務報告即包含SEMI,其涵蓋的期間為 2016年 12月2日至 2016年 12月31日。 2. 2018年第四季提列資產減損、2019年第 2季認列長約虧損。 3. 應收帳款包括關係人。 4. 應付帳款包含關係人。 22 ©Sino-American Silicon Products Inc. All rights reserved.
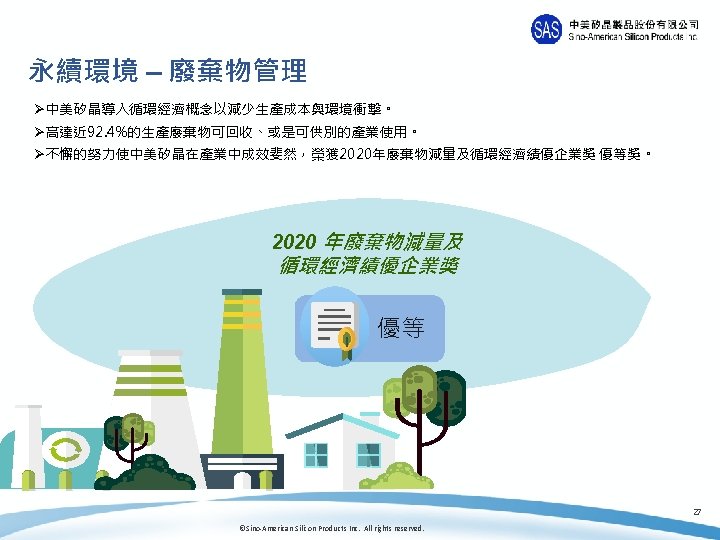
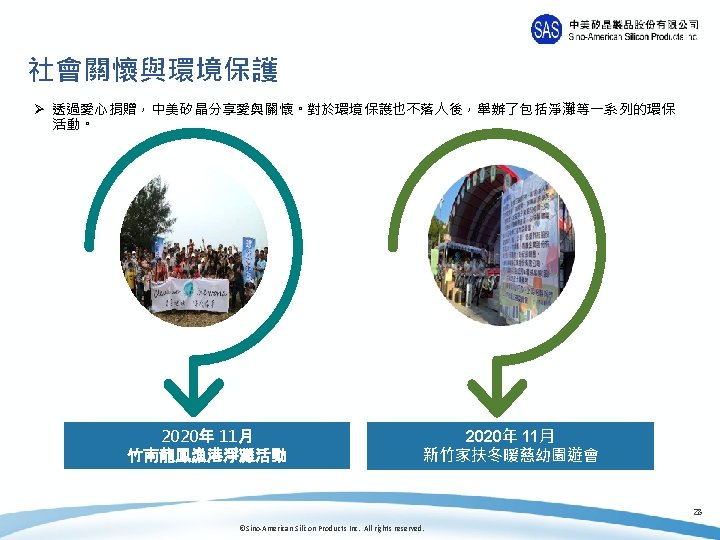
ESG 施行狀況 23 ©Sino-American Silicon Products Inc. All rights reserved.
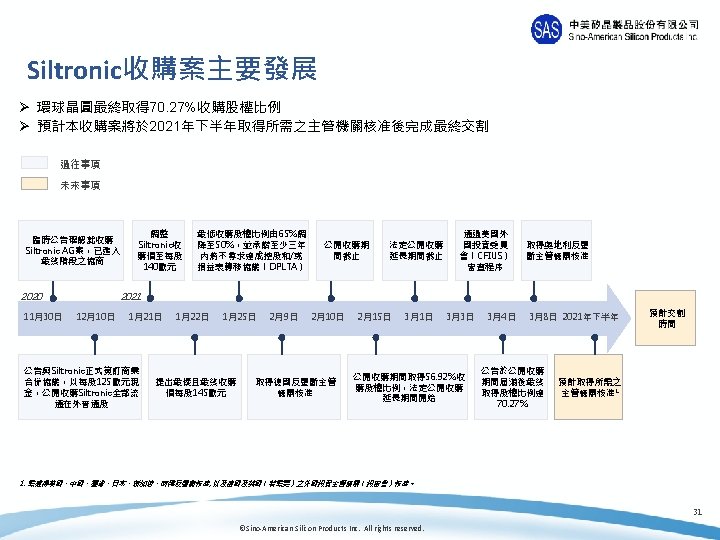
環球晶圓營運表現 29 ©Sino-American Silicon Products Inc. All rights reserved.
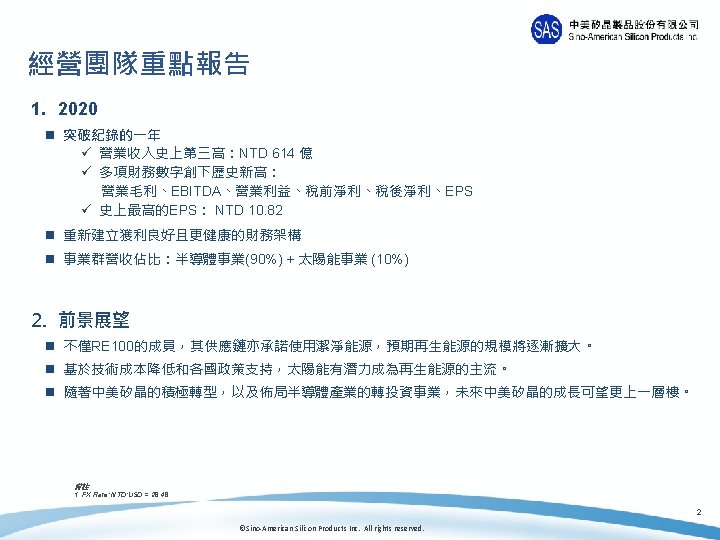
財務摘要 Ø 2020 l 無懼逆風,逐季成長 Revenue(NT$mn) Qo. Q EPS(NT$) Q 420 14, 137 0. 9% 7. 90 Q 320 14, 006 2. 2% 7. 78 Q 220 13, 701 1. 4% 7. 81 Q 120 13, 515 6. 62 l 史上第三高 ü 營收、毛利及毛利率、EBITDA、營業淨利、稅前淨利、稅後淨利、 EPS l EBITDA % & 稅後淨利率 – 史上最高! Ø 財務比例 l 充足現金*1 –NT$ 28, 165 mn (US$ 989 mn)*2 l 預付貨款 – NT$ 16, 763 mn (US$ 589 mn)*2 備註: 1. 1. 現金 = 現金&約當現金 + 受限制現金 2. FX Rate: NTD: USD = 28. 48 30 ©Sino-American Silicon Products Inc. All rights reserved.
財務摘要: 2020年 vs. 2019年 (NT$百萬) 2020 2019 年成長率 營業收入 55, 359 58, 094 -4. 7% EBITDA*1 21, 967 22, 648 -3. 0% EBITDA (%) 39. 7% 39. 0% 0. 7% EBIT 16, 445 17, 902 -8. 1% 營業淨利 15, 287 17, 897 -14. 6% 營業淨利(%) 27. 6% 30. 8% -3. 2% 本期淨利 13, 104 13, 636 -3. 9% 本期淨利 (%) 23. 7% 23. 5% 0. 2% NT$30. 11 NT$31. 35 -NT$1. 24 股東權益報酬率 /ROE*2 (年化) 29. 4% 30. 9% -1. 5% 資產報酬率/ROA*3(年化) 13. 8% 14. 7% -0. 9% 每股盈餘 1. EBITDA=本期淨利+折舊費用+攤銷費用+利息+所得稅 2. ROE = 本期淨利/股東平均權益 3 3. ROA = ((本期淨利+利息*(1 -有效稅率))/平均資產 32 ©Sino-American Silicon Products Inc. All rights reserved.
綜合損益表 (NT$mn) 2013 2014 2015 2016 2017 2018 2019 2020 營業收入 15, 570 15, 922 15, 310 18, 427 46, 213 59, 064 58, 094 55, 359 - 2. 3% -3. 8% 20. 4% 150. 8% 27. 8% -1. 6% -4. 7% 3, 663 3, 728 4, 073 4, 130 11, 808 22, 299 22, 847 20, 568 23. 5% 23. 4% 26. 6% 22. 4% 25. 6% 37. 8% 39. 3% 37. 2% 4, 053 4, 087 4, 046 3, 025 12, 221 22, 712 22, 648 21, 967 26. 0% 25. 7% 26. 4% 16. 4% 26. 4% 38. 5% 39. 0% 39. 7% 2, 194 2, 336 2, 685 1, 378 7, 414 17, 578 17, 897 15, 287 14. 1% 14. 7% 17. 5% 16. 0% 29. 8% 30. 8% 27. 6% 2, 204 2, 679 2, 808 1, 344 6, 875 18, 253 18, 554 16, 615 14. 2% 16. 8% 18. 3% 7. 3% 14. 9% 30. 9% 31. 9% 30. 0% 1, 948 2, 095 2, 044 939 5, 278 13, 634 13, 636 13, 104 12. 5% 13. 2% 13. 4% 5. 1% 11. 4% 23. 1% 23. 5% 23. 7% 6. 14 6. 60 5. 80 2. 54 12. 68 31. 18 31. 35 30. 11 成長率 (%) 營業毛利率(%) EBITDA比率 (%) 營業淨利率(%) 稅前淨利率 (%) 淨利 淨利率(%) EPS (NT$) 備註: 1. 2016年GWC完成Sun. Edison半導體(SEMI)的收購後,2016年度之財務報告即包含SEMI,其涵蓋的期間為 2016年 12月2日至 2016年 12月31日。 2. 3 Q 20為累計數 33 ©Sino-American Silicon Products Inc. All rights reserved.
資產負債表 2013 2014 2015 2016 2017 2018 2019 2020 現金及約當現金 1, 536 2, 685 3, 662 5, 628 18, 794 35, 214 32, 822 22, 439 應收帳款 3, 165 3, 694 4, 538 7, 642 7, 869 9, 226 8, 140 8, 037 存貨 3, 291 2, 829 3, 262 7, 307 7, 347 7, 040 6, 849 7, 208 不動產、廠房及設備 9, 796 8, 972 9, 361 31, 036 28, 202 30, 887 34, 697 37, 111 其他資產 3, 286 3, 204 2, 994 8, 948 8, 020 7, 455 14, 078 20, 056 21, 074 21, 385 23, 816 60, 560 70, 232 89, 822 96, 586 94, 852 短期借款 1, 302 2, 069 696 12, 982 10, 738 5, 042 9, 886 9, 871 應付帳款 1, 816 1, 789 1, 383 5, 126 4, 269 4, 870 3, 837 3, 895 長期借款 -- -- -- 14, 367 3, 663 430 -- 0 其他負債 4, 821 4, 325 5, 012 12, 267 17, 508 36, 324 37, 790 36, 930 負債總計 7, 939 8, 184 7, 091 44, 742 36, 178 46, 666 51, 513 50, 697 權益總計 13, 135 13, 201 16, 725 15, 819 34, 054 43, 156 45, 073 44, 155 (NT$mn) 資產 資產總計 負債 備註: 1. 2016年GWC完成Sun. Edison Semiconductor (SEMI)的收購後,2016年度之財務報告即包含SEMI,其涵蓋的期間為 2016年 12月2日至 2016年 12月31日。 2. 應收帳款包括關係人。 3. 應付帳款包含關係人。 34 ©Sino-American Silicon Products Inc. All rights reserved.
Thank you 35 ©Sino-American Silicon Products Inc. All rights reserved.