2 k Factorial Design k2 Ex Assuming a


.")


- Slides: 25
2 k Factorial Design k=2 Ex:
• Assuming a model containing 2 main effects and interaction. Calculate 3 effects. • Sketch the interaction plot and interpret the graph. • Write hypothesis regarding main effects and interaction. • Do ANOVA and test for interaction (α = 0. 05). Give conclusion. • Test for main effects and give final conclusion regarding the importance of all these effects. • Write the least squares fitted model using only significant terms. • Use the model to predict the response when x 1=-1 and x 2=-1.
2 k Factorial Design k=3
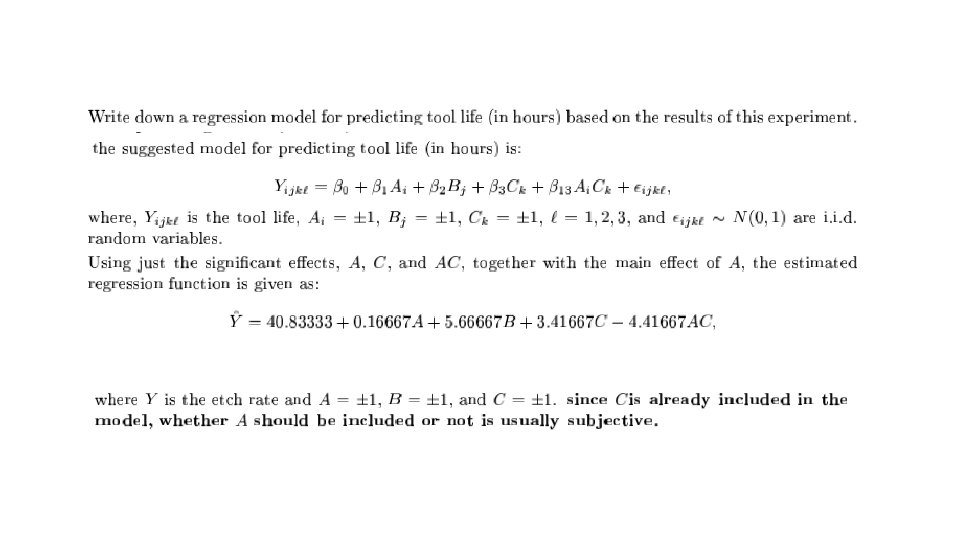
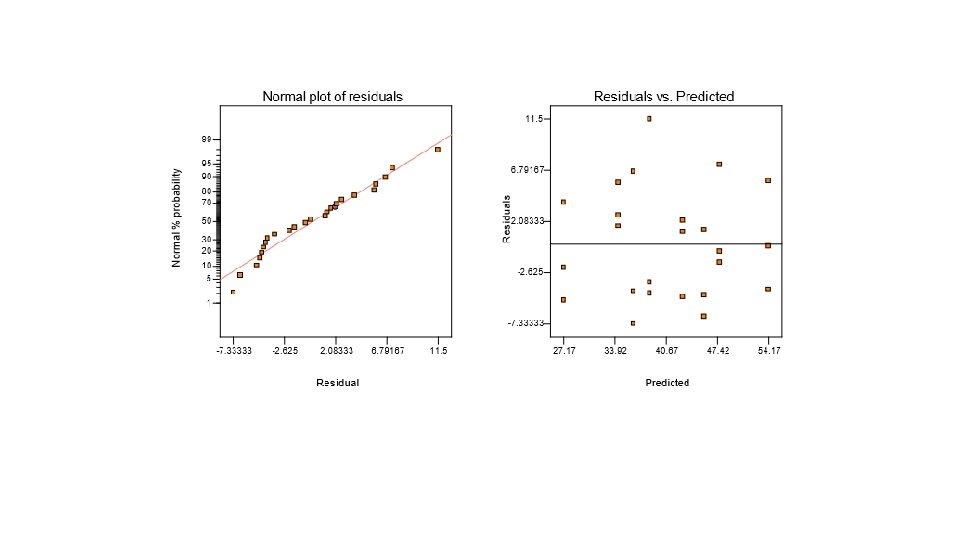
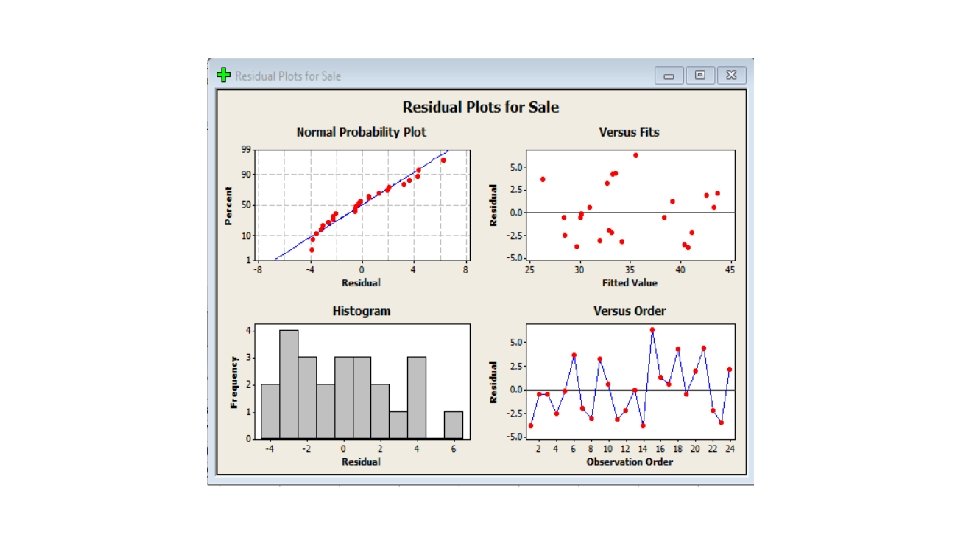
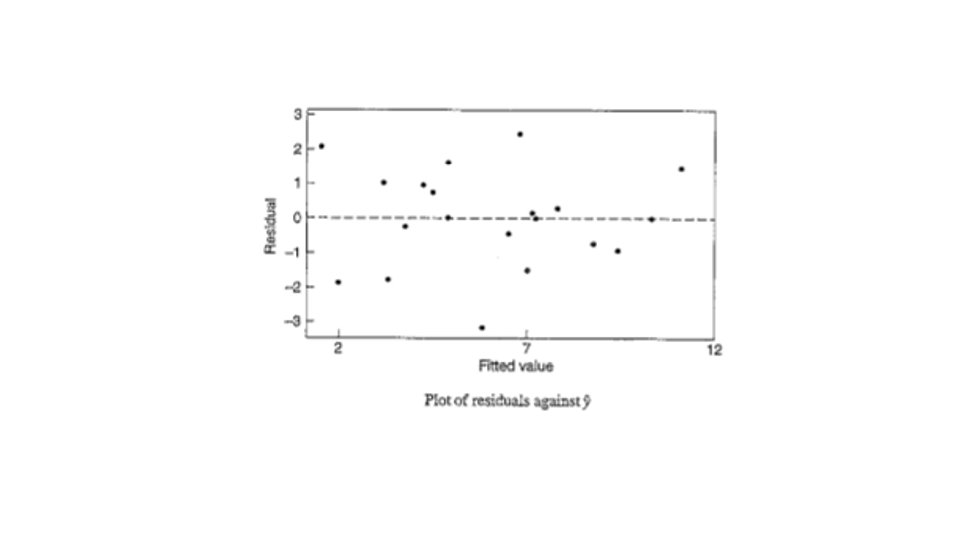
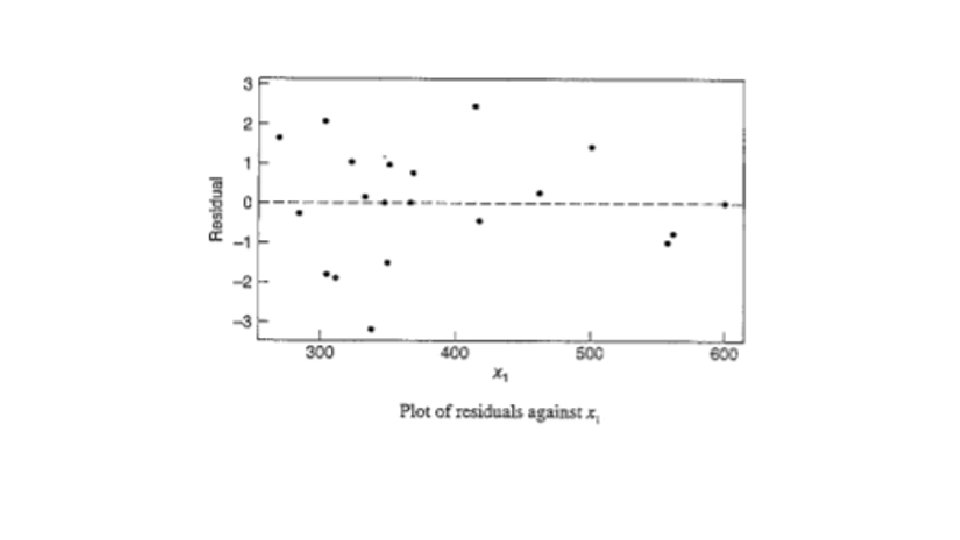
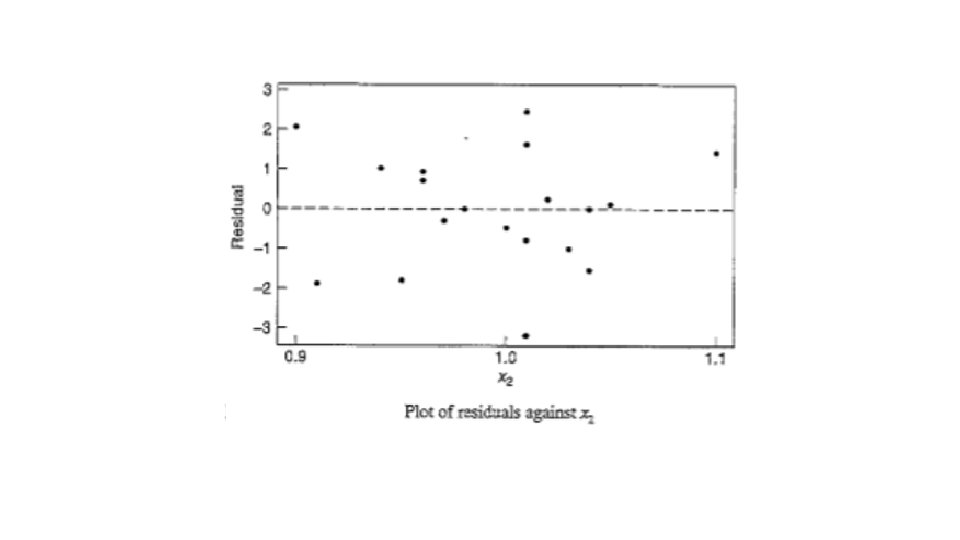
• Estimate the factor effects. Which effects appear to be large? • Use the analysis of variance to confirm your conclusions for part (a). • Write down a regression model for predicting tool life (in hours) based on the results of this experiment. • Analyze the residuals. Are there any obvious problems?
• Factors B, C, and the AC interaction appear to be large (significant).
• The analysis of variance confirms the significance of factors B, C, and the AC interaction.
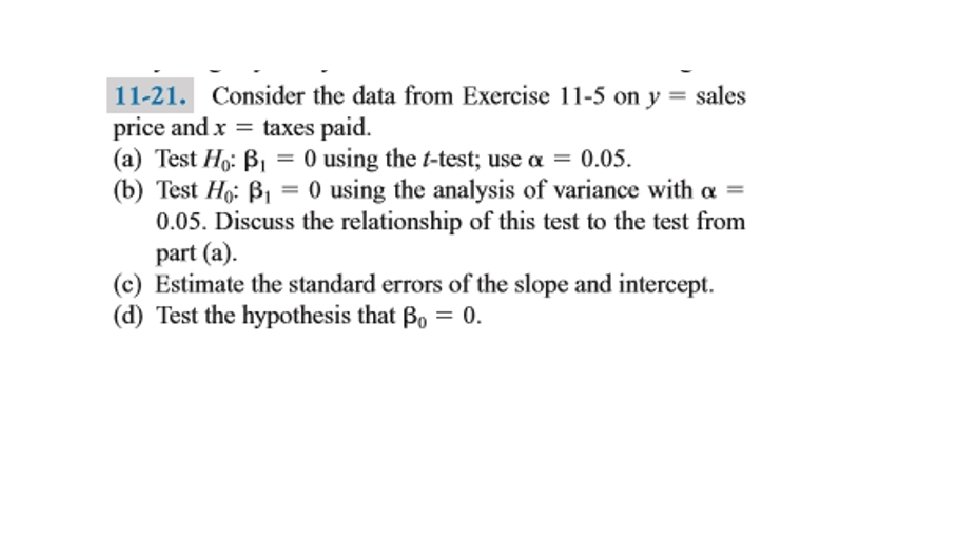
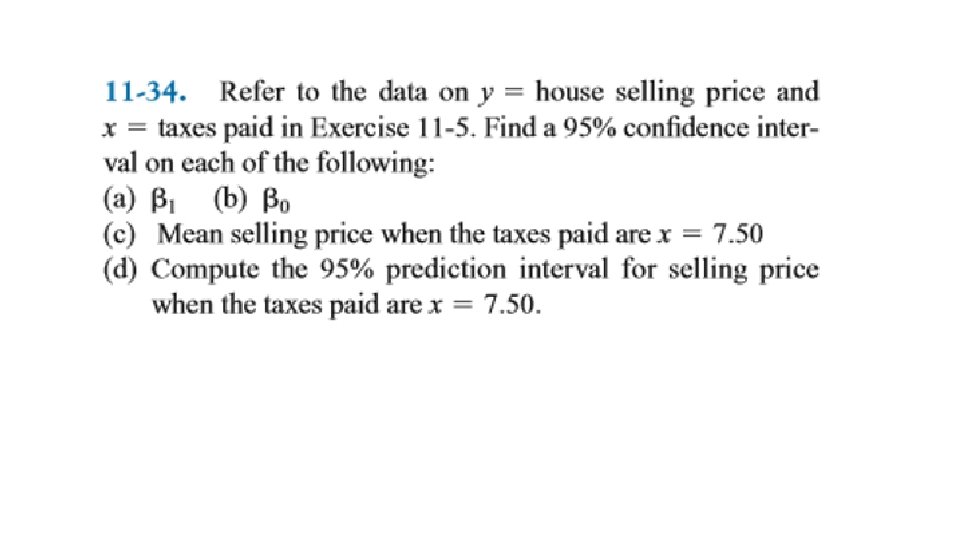
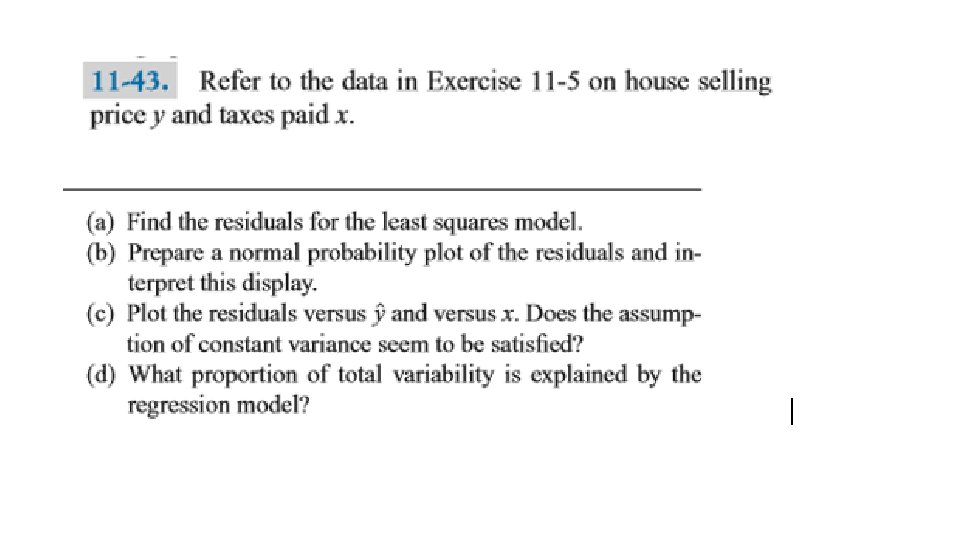
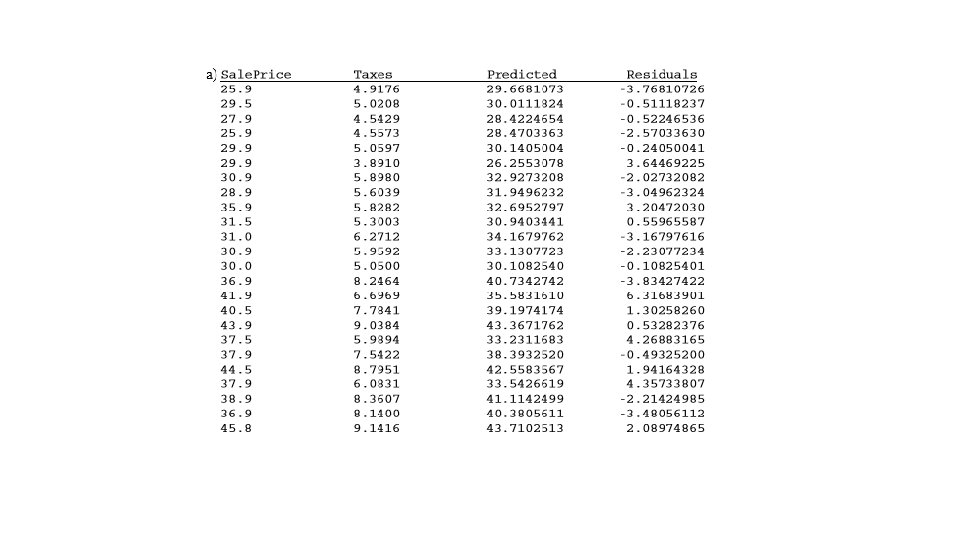
Simple Linear Regression Ex:
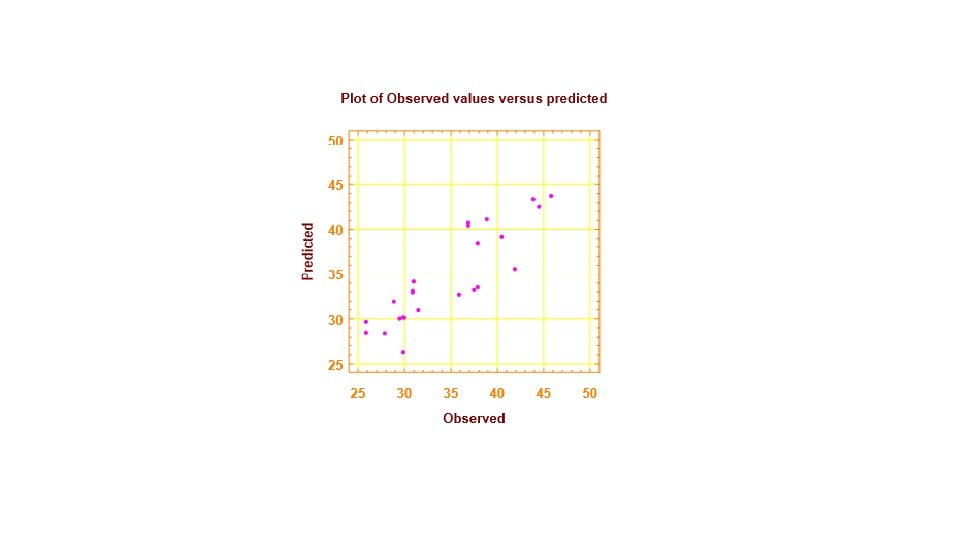
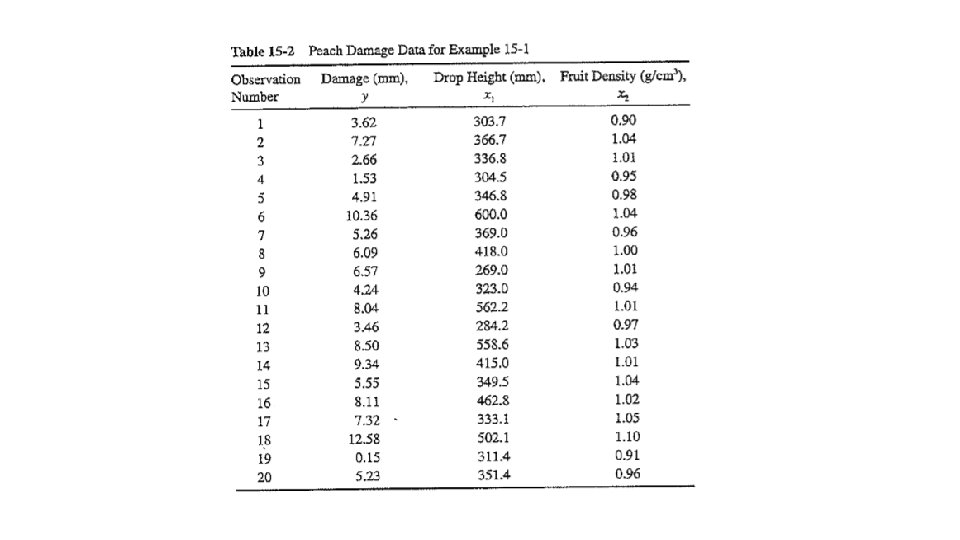
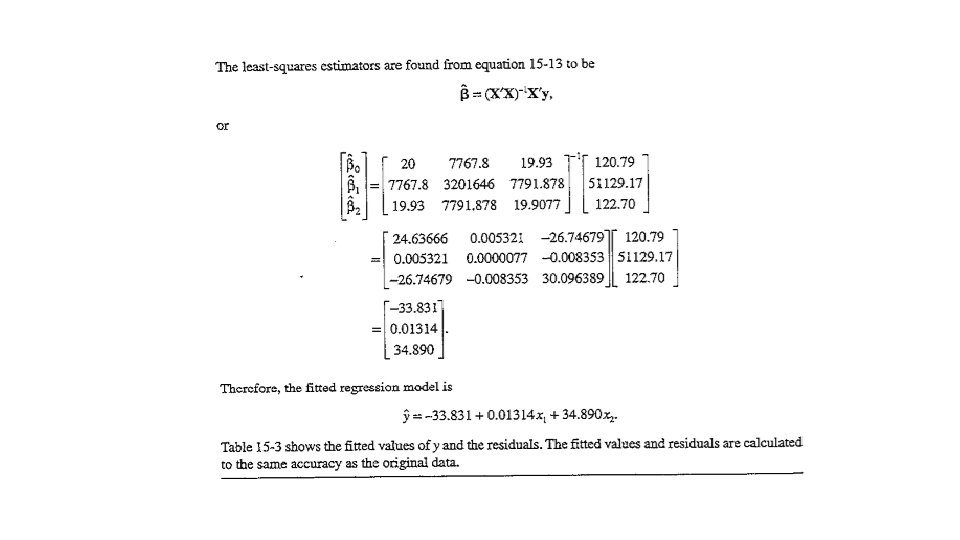
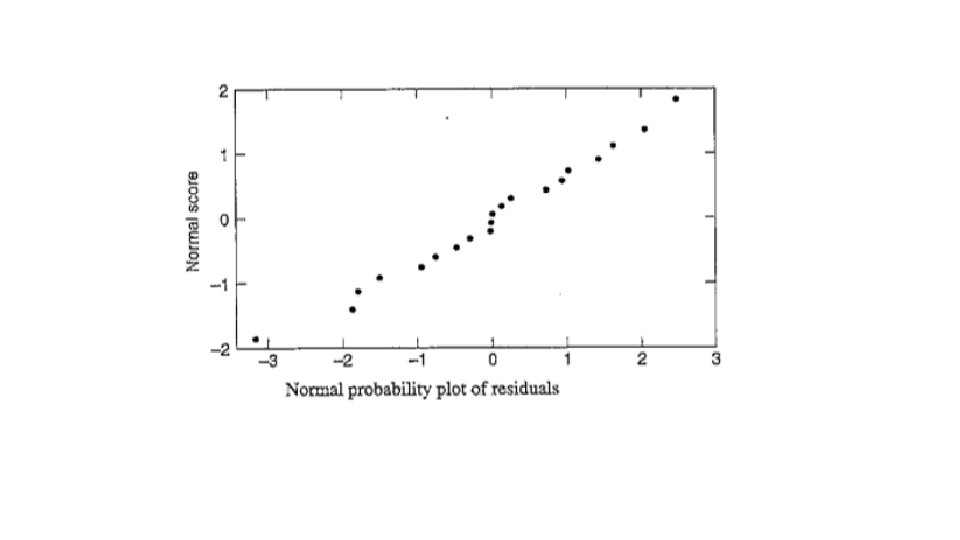
Multiple Linear Regression Ex: Write fitted multiple linear regression model. Find the residual value of third observation. What is the estimate of Find a 95% CI on Test the significance of regression. Besides write hypotehsis for this test. Calculate the coefficient of multiple determination andjusted coefficient of multiple determination. Interpret the results. • Check the model adequacy. • • •
• In the following table x 1, x 2, and y values corresponding to a regression analysis problem are given.