Using your calculator Go Using Ran Go Using


![Using Ran# to generate a random whole number within a given interval [1, 200]](https://slidetodoc.com/presentation_image_h/03b74b5121f9fd454ce33d6d230bc190/image-14.jpg "Using Ran# to generate a random whole number within a given interval [1, 200]")


![Generating whole numbers in a given interval [1, 200] using Ranint](https://slidetodoc.com/presentation_image_h/03b74b5121f9fd454ce33d6d230bc190/image-31.jpg "Generating whole numbers in a given interval [1, 200] using Ranint")


![Using Ranint We want our interval to be [1, 200]](https://slidetodoc.com/presentation_image_h/03b74b5121f9fd454ce33d6d230bc190/image-34.jpg "Using Ranint We want our interval to be [1, 200]")


![Using Ranint To keep generating a random 3 digit number between [1, 200] we](https://slidetodoc.com/presentation_image_h/03b74b5121f9fd454ce33d6d230bc190/image-41.jpg "Using Ranint To keep generating a random 3 digit number between [1, 200] we")


")
 4. 5 3. 0 5. 2 5. 0 2. 1 0")
 4. 5 3. 0 5. 2 5. 0 2. 1 0")
 4. 5 3. 0 5. 2 5. 0 2. 1 0")
 4. 5 3. 0 5. 2 5. 0 2. 1 0")
 4. 5 3. 0 5. 2 5. 0 2. 1 0")
 4. 5 3. 0 5. 2 5. 0 2. 1 0")
 4. 5 3. 0 5. 2 5. 0 2. 1 0")
 1 4. 5 2 3. 0 3 5. 2 4 5.")
 1 4. 5 2 3. 0 3 5. 2 4 5.")
 1 4. 5 2 3. 0 3 5. 2 4 5.")
 1 4. 5 2 3. 0 3 5. 2 4 5.")
 1 4. 5 2 3. 0 3 5. 2 4 5.")
 1 4. 5 2 3. 0 3 5. 2 4 5.")
 1 4. 5 2 3. 0 3 5. 2 4 5.")
 1 4. 5 2 3. 0 3 5. 2 4 5.")
 1 4. 5 2 3. 0 3 5. 2 4 5.")
 1 4. 5 2 3. 0 3 5. 2 4 5.")
 1 4. 5 2 3. 0 3 5. 2 4 5.")
 1 4. 5 2 3. 0 3 5. 2 4 5.")
 1 4. 5 2 3. 0 3 5. 2 4 5.")
 1 4. 5 2 3. 0 3 5. 2 4 5.")
 1 4. 5 2 3. 0 3 5. 2 4 5.")
 1 4. 5 2 3. 0 3 5. 2 4 5.")
 1 4. 5 2 3. 0 3 5. 2 4 5.")
 1 4. 5 2 3. 0 3 5. 2 4 5.")
 1 4. 5 2 3. 0 3 5. 2 4 5.")
 1 4. 5 2 3. 0 3 5. 2 4 5.")


- Slides: 95
Using your calculator Go • Using Ran# Go • Using Ranint Go • Finding Standard Deviation Go • Finding Correlation Coefficient
Random Sampling using Ran# The Ran#: Generates a pseudo random number to 3 decimal places that is less than 1. i. e. it generates a random number in the range [0, 1] Ran# is in Yellow
Random Sampling using Ran#
Random Sampling using Ran# To keep generating a random 3 digit number between [0, 1] we repeatedly press =
Random Sampling using Ran#
Random Sampling using Ran# The calculator automatically displays in Natural display. If we are generating lots of numbers this may become annoying. We need to Set UP the calculator into Linear Display (as a single line …Decimals)
Random Sampling using Ran#
Random Sampling using Ran# We want it Linear
Random Sampling using Ran# we want a random number again
Random Sampling using Ran#
Random Sampling using Ran# To keep generating a random 3 digit number between [0, 1] we repeatedly press =
Random Sampling using Ran#
Random Sampling using Ran#
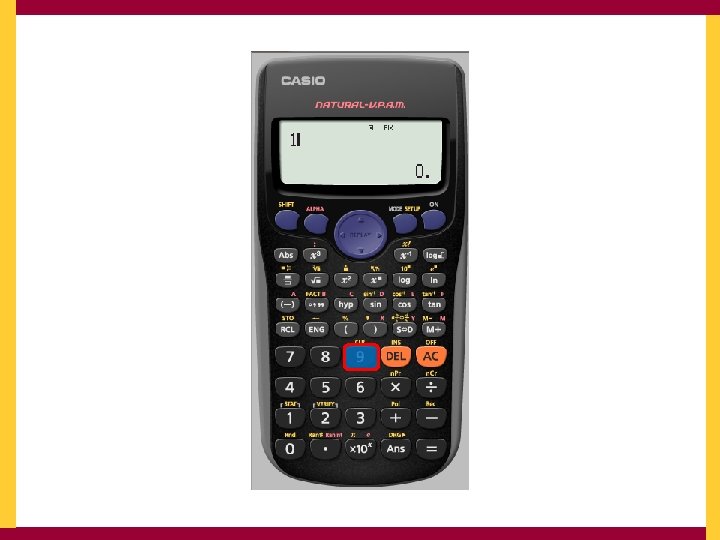
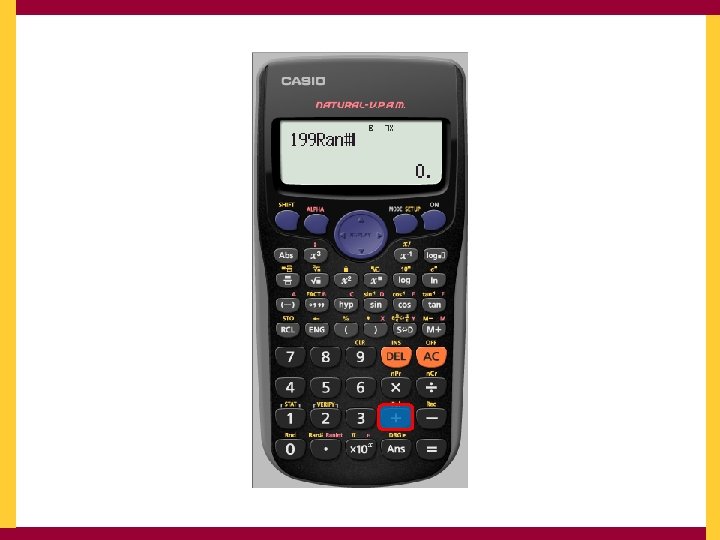
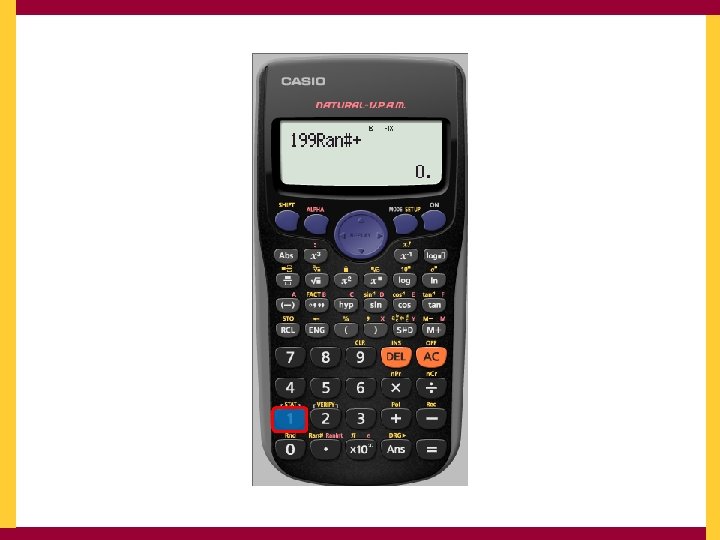
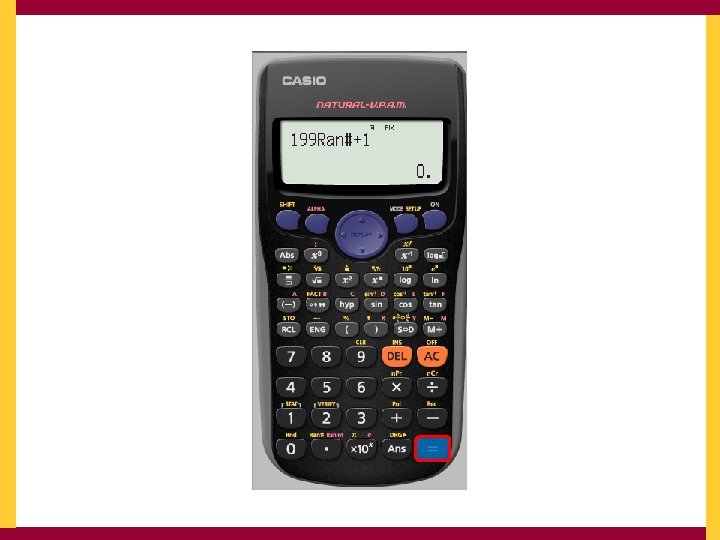
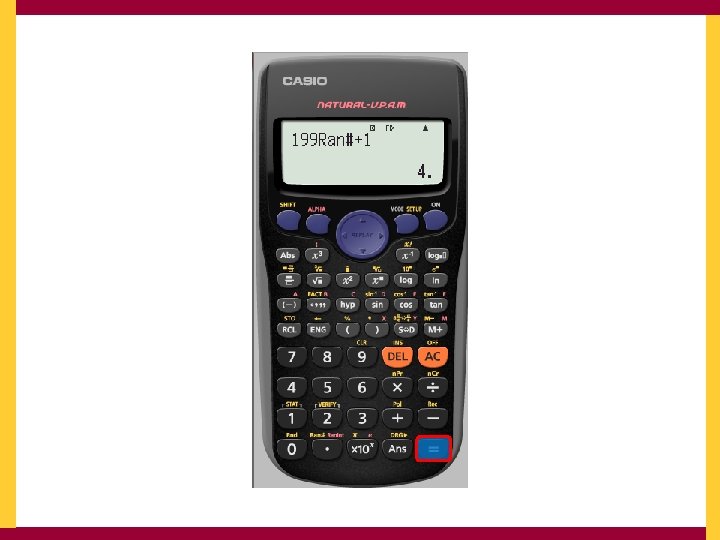
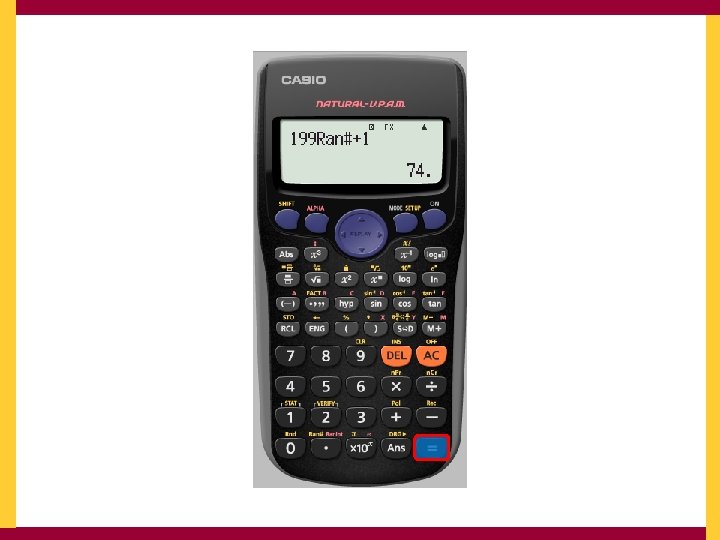
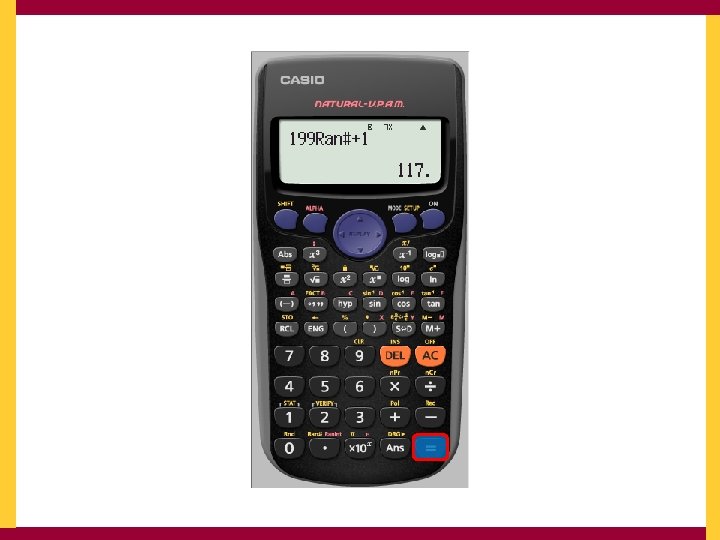
Using Ran# to generate a random whole number within a given interval [1, 200] If we multiply the randomly generated number by 199 then 199 x [0, 1] = [0, 199] To get it between 1 and 200 we must add 1 199 x [0, 1] + 1 = [1, 200] But we must first SET UP the calculator to Fix to 0 decimal place
But we must first SET UP the calculator to Fix to 0 decimal place
But we must first SET UP the calculator to Fix to 0 decimal place
But we must first SET UP the calculator to Fix to 0 decimal place
But we must first SET UP the calculator to Fix to 0 decimal place
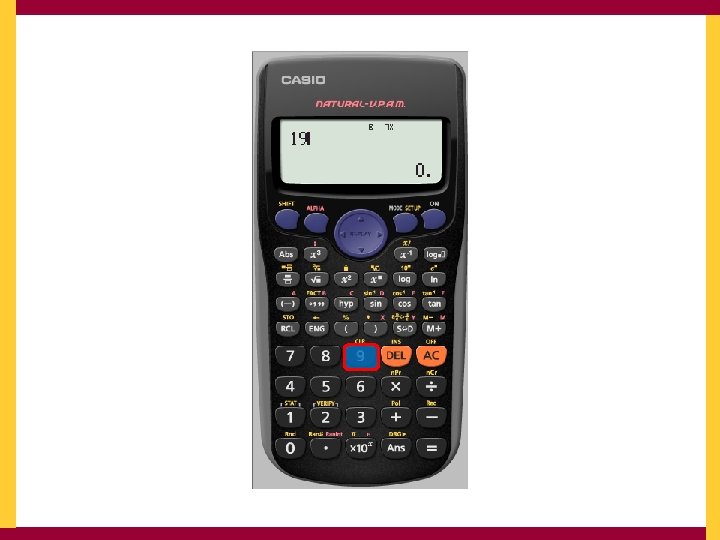
The calculator tells us it has been SET UP To Fix We now need to tell it what we want 199 x [0, 1] + 1
Using your calculator Go • Using Ran# Go • Using Ranint Go • Finding Standard Deviation Go • Finding Correlation Coefficient
Generating whole numbers in a given interval [1, 200] using Ranint
Using Ranint is in Red
Using Ranint
Using Ranint We want our interval to be [1, 200]
Using Ranint The comma is here in yellow
Using Ranint The comma is here in yellow
Using Ranint
Using Ranint
Using Ranint
Using Ranint The bracket is here
Using Ranint To keep generating a random 3 digit number between [1, 200] we repeatedly press =
Using Ranint
Using Ranint
Using your calculator Go • Using Ran# Go • Using Ranint Go • Finding Standard Deviation Go • Finding Correlation Coefficient
Finding Standard Deviation Find the Standard Deviation of 6, 5, 5, 4, 5, 5, 6, 5 and 4 We first need to make sure the calculator is clear of all previous content
Finding Standard Deviation Find the Standard Deviation of 6, 5, 5, 4, 5, 5, 6, 5 and 4 We first need to make sure the calculator is clear of all previous content
Finding Standard Deviation Find the Standard Deviation of 6, 5, 5, 4, 5, 5, 6, 5 and 4 We want to clear ALL
Finding Standard Deviation Find the Standard Deviation of 6, 5, 5, 4, 5, 5, 6, 5 and 4 Yes reset all
Finding Standard Deviation Find the Standard Deviation of 6, 5, 5, 4, 5, 5, 6, 5 and 4 We really do agree AC
Finding Standard Deviation Find the Standard Deviation of 6, 5, 5, 4, 5, 5, 6, 5 and 4 We want the calculator in stats mode
Finding Standard Deviation Find the Standard Deviation of 6, 5, 5, 4, 5, 5, 6, 5 and 4 We want the calculator in stats mode
Finding Standard Deviation Find the Standard Deviation of 6, 5, 5, 4, 5, 5, 6, 5 and 4 We only have 1 variable
Finding Standard Deviation Find the Standard Deviation of 6, 5, 5, 4, 5, 5, 6, 5 and 4 We now input our data pressing = after each term
Finding Standard Deviation Find the Standard Deviation of 6, 5, 5, 4, 5, 5, 6, 5 and 4
Finding Standard Deviation Find the Standard Deviation of 6, 5, 5, 4, 5, 5, 6, 5 and 4
Finding Standard Deviation Find the Standard Deviation of 6, 5, 5, 4, 5, 5, 6, 5 and 4
Finding Standard Deviation Find the Standard Deviation of 6, 5, 5, 4, 5, 5, 6, 5 and 4 Repeat this process until the data is entered
Finding Standard Deviation Find the Standard Deviation of 6, 5, 5, 4, 5, 5, 6, 5 and 4 We have finished inputting the data. We now need to get to where we can analyse it Press AC
Finding Standard Deviation Find the Standard Deviation of 6, 5, 5, 4, 5, 5, 6, 5 and 4 We need to analyse the stats we have input
Finding Standard Deviation Find the Standard Deviation of 6, 5, 5, 4, 5, 5, 6, 5 and 4 We need to analyse the stats we have input
Finding Standard Deviation Find the Standard Deviation of 6, 5, 5, 4, 5, 5, 6, 5 and 4 We want to see the Variance
Finding Standard Deviation Find the Standard Deviation of 6, 5, 5, 4, 5, 5, 6, 5 and 4 We want the standard Deviation σx
Finding Standard Deviation Find the Standard Deviation of 6, 5, 5, 4, 5, 5, 6, 5 and 4
Finding Standard Deviation Find the Standard Deviation of 6, 5, 5, 4, 5, 5, 6, 5 and 4 This is the standard deviation of the data set To see more analysis details, analyse the data again
Using your calculator Go • Using Ran# Go • Using Ranint Go • Finding Standard Deviation Go • Finding Correlation Coefficient
Finding Correlation Coefficient Find the Correlation Coefficient for the following data Rainfall (x cm) 4. 5 3. 0 5. 2 5. 0 2. 1 No. of tourists (1000’s 5. 0 8. 0 0. 8 4. 2 4. 8 We first need to make sure the calculator is clear of all 0 0 1. 2 3. 2 previous content 7. 4 9. 4 8. 6 2. 6 Finding Correlation Coefficient
Rainfall (x cm) 4. 5 3. 0 5. 2 5. 0 2. 1 0 0 1. 2 3. 2 No. of tourists (1000’s 5. 0 8. 0 0. 8 4. 2 4. 8 7. 4 9. 4 8. 6 2. 6 We first need to make sure the calculator is clear of all previous content Finding Correlation Coefficient
Rainfall (x cm) 4. 5 3. 0 5. 2 5. 0 2. 1 0 0 1. 2 3. 2 No. of tourists (1000’s 5. 0 8. 0 0. 8 4. 2 4. 8 7. 4 9. 4 8. 6 2. 6 We want to clear Finding Correlation Coefficient All
Rainfall (x cm) 4. 5 3. 0 5. 2 5. 0 2. 1 0 0 1. 2 3. 2 No. of tourists (1000’s 5. 0 8. 0 0. 8 4. 2 4. 8 7. 4 9. 4 8. 6 2. 6 Yes Reset all Finding Correlation Coefficient
Rainfall (x cm) 4. 5 3. 0 5. 2 5. 0 2. 1 0 0 1. 2 3. 2 No. of tourists (1000’s 5. 0 8. 0 0. 8 4. 2 4. 8 7. 4 9. 4 8. 6 2. 6 We really do agree AC Finding Correlation Coefficient
Rainfall (x cm) 4. 5 3. 0 5. 2 5. 0 2. 1 0 0 1. 2 3. 2 No. of tourists (1000’s 5. 0 8. 0 0. 8 4. 2 4. 8 7. 4 9. 4 8. 6 2. 6 We want the calculator in stats mode Finding Correlation Coefficient
Rainfall (x cm) 4. 5 3. 0 5. 2 5. 0 2. 1 0 0 1. 2 3. 2 No. of tourists (1000’s 5. 0 8. 0 0. 8 4. 2 4. 8 7. 4 9. 4 8. 6 2. 6 We want the calculator in stats mode Finding Correlation Coefficient
Rainfall (x cm) 4. 5 3. 0 5. 2 5. 0 2. 1 0 0 1. 2 3. 2 No. of tourists (1000’s 5. 0 8. 0 0. 8 4. 2 4. 8 7. 4 9. 4 8. 6 2. 6 We have 2 variables Finding Correlation Coefficient
Rainfall (x cm) 1 4. 5 2 3. 0 3 5. 2 4 5. 0 5 2. 1 6 0 7 0 8 1. 2 9 3. 2 No. of tourists (1000’s 5. 0 8. 0 0. 8 4. 2 4. 8 7. 4 9. 4 8. 6 2. 6 Useful to write the numbers 1, 2, 3, … above each row so as we can check we are correct We now input the first row of the data into the first column of the table pressing = after each term Finding Correlation Coefficient
Rainfall (x cm) 1 4. 5 2 3. 0 3 5. 2 4 5. 0 5 2. 1 6 0 7 0 8 1. 2 9 3. 2 No. of tourists (1000’s 5. 0 8. 0 0. 8 4. 2 4. 8 7. 4 9. 4 8. 6 2. 6 Finding Correlation Coefficient
Rainfall (x cm) 1 4. 5 2 3. 0 3 5. 2 4 5. 0 5 2. 1 6 0 7 0 8 1. 2 9 3. 2 No. of tourists (1000’s 5. 0 8. 0 0. 8 4. 2 4. 8 7. 4 9. 4 8. 6 2. 6 Finding Correlation Coefficient
Rainfall (x cm) 1 4. 5 2 3. 0 3 5. 2 4 5. 0 5 2. 1 6 0 7 0 8 1. 2 9 3. 2 No. of tourists (1000’s 5. 0 8. 0 0. 8 4. 2 4. 8 7. 4 9. 4 8. 6 2. 6 Finding Correlation Coefficient
Rainfall (x cm) 1 4. 5 2 3. 0 3 5. 2 4 5. 0 5 2. 1 6 0 7 0 8 1. 2 9 3. 2 No. of tourists (1000’s 5. 0 8. 0 0. 8 4. 2 4. 8 7. 4 9. 4 8. 6 2. 6 Finding Correlation Coefficient
Rainfall (x cm) 1 4. 5 2 3. 0 3 5. 2 4 5. 0 5 2. 1 6 0 7 0 8 1. 2 9 3. 2 No. of tourists (1000’s 5. 0 8. 0 0. 8 4. 2 4. 8 7. 4 9. 4 8. 6 2. 6 Finding Correlation Coefficient
Rainfall (x cm) 1 4. 5 2 3. 0 3 5. 2 4 5. 0 5 2. 1 6 0 7 0 8 1. 2 9 3. 2 No. of tourists (1000’s 5. 0 8. 0 0. 8 4. 2 4. 8 7. 4 9. 4 8. 6 2. 6 Finding Correlation Coefficient
Rainfall (x cm) 1 4. 5 2 3. 0 3 5. 2 4 5. 0 5 2. 1 6 0 7 0 8 1. 2 9 3. 2 No. of tourists (1000’s 5. 0 8. 0 0. 8 4. 2 4. 8 7. 4 9. 4 8. 6 2. 6 Finding Correlation Coefficient
Rainfall (x cm) 1 4. 5 2 3. 0 3 5. 2 4 5. 0 5 2. 1 6 0 7 0 8 1. 2 9 3. 2 No. of tourists (1000’s 5. 0 8. 0 0. 8 4. 2 4. 8 7. 4 9. 4 8. 6 2. 6 Repeat this process until the first row has been entered Finding Correlation Coefficient
Rainfall (x cm) 1 4. 5 2 3. 0 3 5. 2 4 5. 0 5 2. 1 6 0 7 0 8 1. 2 9 3. 2 No. of tourists (1000’s 5. 0 8. 0 0. 8 4. 2 4. 8 7. 4 9. 4 8. 6 2. 6 Use the cursor keys to enter the data from the second row Finding Correlation Coefficient
Rainfall (x cm) 1 4. 5 2 3. 0 3 5. 2 4 5. 0 5 2. 1 6 0 7 0 8 1. 2 9 3. 2 No. of tourists (1000’s 5. 0 8. 0 0. 8 4. 2 4. 8 7. 4 9. 4 8. 6 2. 6 Press the right cursor Finding Correlation Coefficient
Rainfall (x cm) 1 4. 5 2 3. 0 3 5. 2 4 5. 0 5 2. 1 6 0 7 0 8 1. 2 9 3. 2 No. of tourists (1000’s 5. 0 8. 0 0. 8 4. 2 4. 8 7. 4 9. 4 8. 6 2. 6 Finding Correlation Coefficient
Rainfall (x cm) 1 4. 5 2 3. 0 3 5. 2 4 5. 0 5 2. 1 6 0 7 0 8 1. 2 9 3. 2 No. of tourists (1000’s 5. 0 8. 0 0. 8 4. 2 4. 8 7. 4 9. 4 8. 6 2. 6 Input the data from the second row Finding Correlation Coefficient
Rainfall (x cm) 1 4. 5 2 3. 0 3 5. 2 4 5. 0 5 2. 1 6 0 7 0 8 1. 2 9 3. 2 No. of tourists (1000’s 5. 0 8. 0 0. 8 4. 2 4. 8 7. 4 9. 4 8. 6 2. 6 We have finished inputting the data. We now need to analyse the STATS Press AC Finding Correlation Coefficient
Rainfall (x cm) 1 4. 5 2 3. 0 3 5. 2 4 5. 0 5 2. 1 6 0 7 0 8 1. 2 9 3. 2 No. of tourists (1000’s 5. 0 8. 0 0. 8 4. 2 4. 8 7. 4 9. 4 8. 6 2. 6 We need to analyse the stats we have input Finding Correlation Coefficient
Rainfall (x cm) 1 4. 5 2 3. 0 3 5. 2 4 5. 0 5 2. 1 6 0 7 0 8 1. 2 9 3. 2 No. of tourists (1000’s 5. 0 8. 0 0. 8 4. 2 4. 8 7. 4 9. 4 8. 6 2. 6 We need to analyse the stats we have input Finding Correlation Coefficient
Rainfall (x cm) 1 4. 5 2 3. 0 3 5. 2 4 5. 0 5 2. 1 6 0 7 0 8 1. 2 9 3. 2 No. of tourists (1000’s 5. 0 8. 0 0. 8 4. 2 4. 8 7. 4 9. 4 8. 6 2. 6 We want use Regression Finding Correlation Coefficient
Rainfall (x cm) 1 4. 5 2 3. 0 3 5. 2 4 5. 0 5 2. 1 6 0 7 0 8 1. 2 9 3. 2 No. of tourists (1000’s 5. 0 8. 0 0. 8 4. 2 4. 8 7. 4 9. 4 8. 6 2. 6 We want the Correlation Coefficient r Finding Correlation Coefficient
Rainfall (x cm) 1 4. 5 2 3. 0 3 5. 2 4 5. 0 5 2. 1 6 0 7 0 8 1. 2 9 3. 2 No. of tourists (1000’s 5. 0 8. 0 0. 8 4. 2 4. 8 7. 4 9. 4 8. 6 2. 6 Press = Finding Correlation Coefficient
Rainfall (x cm) 1 4. 5 2 3. 0 3 5. 2 4 5. 0 5 2. 1 6 0 7 0 8 1. 2 9 3. 2 No. of tourists (1000’s 5. 0 8. 0 0. 8 4. 2 4. 8 7. 4 9. 4 8. 6 2. 6 We have the Correlation Coefficient of the data To see more analysis details analyse the STAT Finding Correlation Coefficient
The line of Best Fit The calculator uses y = A + Bx Instead of y = mx + c 1: A → the y intercept 2: B → the Slope
Using your calculator Go • Using Ran# Go • Using Ranint Go • Finding Standard Deviation Go • Finding Correlation Coefficient