Water Quality Assessment of Osage Creek West Fork


- Slides: 28
Water Quality Assessment of Osage Creek & West Fork, White and Kings Rivers 2008 & ½ 2009 Marc Nelson Ph. D, PE Nelson Engineering
Funding provided by: Arkansas Natural Resources Commission, EPA 319 Grant Program To : Northwest Arkansas Conservation Authority - Osage City Of Fayetteville - West Fork Beaver Water District - White Kings River Watershed Partnership - Kings
Summarize Water Quality Assessment • • • Four watersheds NWA 2008 and first half of 2009 results Phosphorus Trends Watershed comparisons
Northwest Arkansas Water Quality Monitoring Sites Osage Creek Kings River White River @ 45 Bridge West Fork of White River
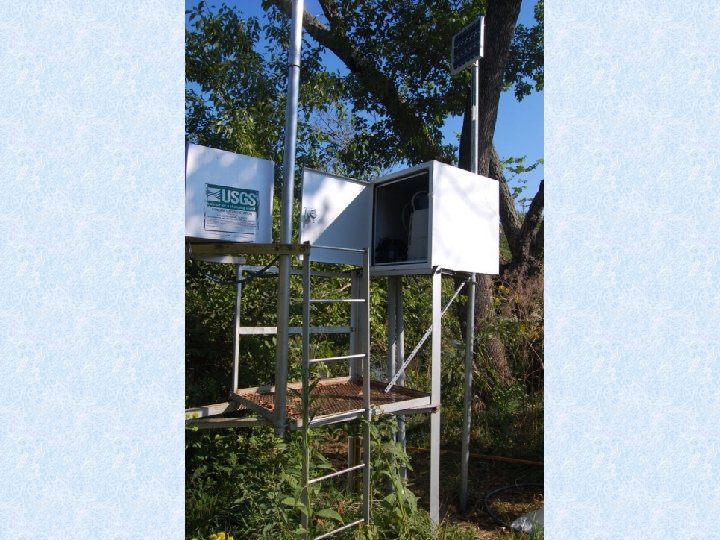
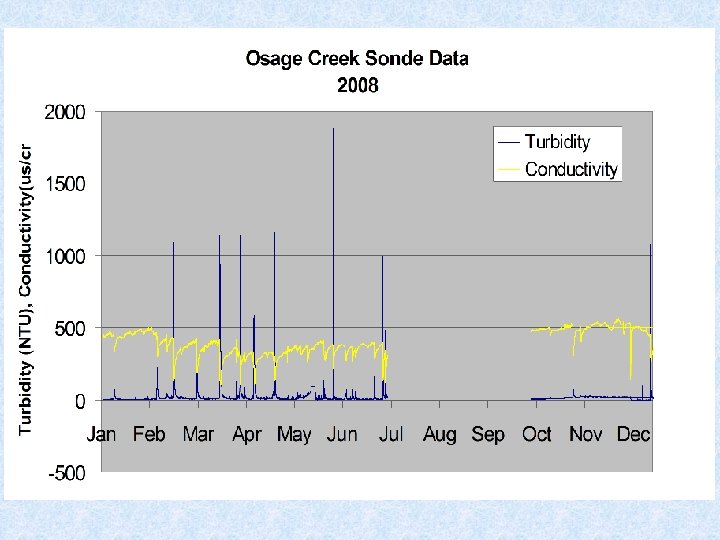
Water Quality Sampling • Grab samples every two weeks • Auto-sampler samples all storm events > trigger level • Flow-weighted composite samples (except White) • SO 4, Cl-, NH 4, NO 3/NO 2, T-N, T-P, s. PO 4, and TSS • Concentrations assigned to all times • USGS discharge for all times • Loads calculated by multiplying and summing for the year • Sondes reading turbidity, conductivity and temp (except Kings River)
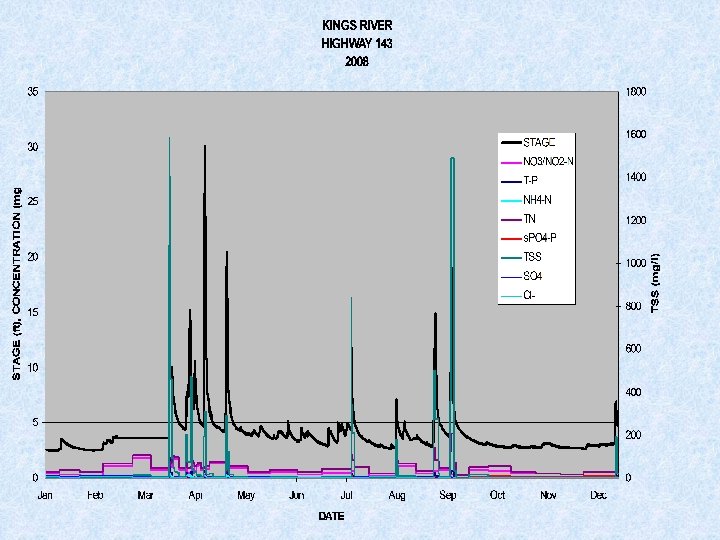
Kings River near Berryville 2008 Loads and Mean Concentrations Parameter Total Discharge Total Load (m 3/yr) (kg/yr) 796, 964, 238 SO 4 3, 680, 000 Cl- 2, 265, 835 NO 3/NO 2 -N 524, 321 TP 217, 473 NH 4 -N 49, 313 TN s. PO 4 -P TSS 1, 048, 175 28, 059 166, 344, 864
Kings River near Berryville 2008 Loads and Mean Concentrations Parameter Total Discharge Total Load Average Discharge Mean (m 3/yr) (kg/yr) (m 3/s) Concentrations (mg/l) 796, 964, 238 25. 3 SO 4 3, 680, 000 4. 62 Cl- 2, 265, 835 2. 84 NO 3/NO 2 -N 524, 321 0. 66 TP 217, 473 0. 27 NH 4 -N 49, 313 0. 06 1, 048, 175 1. 32 28, 059 0. 04 TN s. PO 4 -P TSS 166, 344, 864 208. 72
Kings River near Berryville 2008 Storm and Base-flow Loads and Mean Concentrations Parameter Storm Loads Base Loads (kg) Storm Concentrations (mg/l) Base Concentrations (mg/l) Discharge (m 3) 510, 695, 939 286, 268, 299 SO 4 1, 976, 692 1, 703, 308 3. 87 5. 95 Cl- 1, 083, 426 1, 182, 408 2. 12 4. 13 NO 3/NO 2 -N 318, 395 205, 925 0. 62 0. 72 TP 203, 841 13, 632 0. 40 0. 05 NH 4 -N 44, 040 5, 273 0. 09 0. 02 TN 780, 366 267, 809 1. 53 0. 94 s. PO 4 -P 18, 542 9, 516 0. 04 0. 03 TSS 165, 148, 911 1, 195, 953 323. 38 4. 18
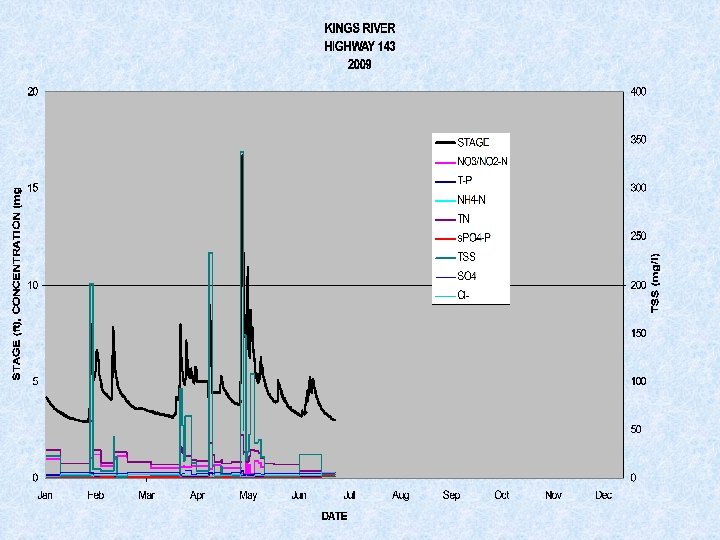
Kings River near Berryville First Half of 2009 Storm and Base-flow Loads and Mean Concentrations Parameter Storm Loads Base Loads (kg) Storm Concentrations (mg/l) Base Concentrations (mg/l) Discharge (m 3) 283, 881, 933 216, 878, 594 SO 4 1, 220, 122 1, 062, 575 4. 30 4. 90 Cl- 689, 341 674, 990 2. 43 3. 11 NO 3/NO 2 -N 160, 241 133, 527 0. 56 0. 62 TP 39, 355 8, 936 0. 14 0. 04 NH 4 -N 5, 103 3, 442 0. 02 TN 418, 119 175, 055 1. 47 0. 81 s. PO 4 -P 5, 716 5, 850 0. 02 0. 03 TSS 31, 103, 491 1, 603, 502 109. 56 7. 39
Kings River P trends
Kings River P trends
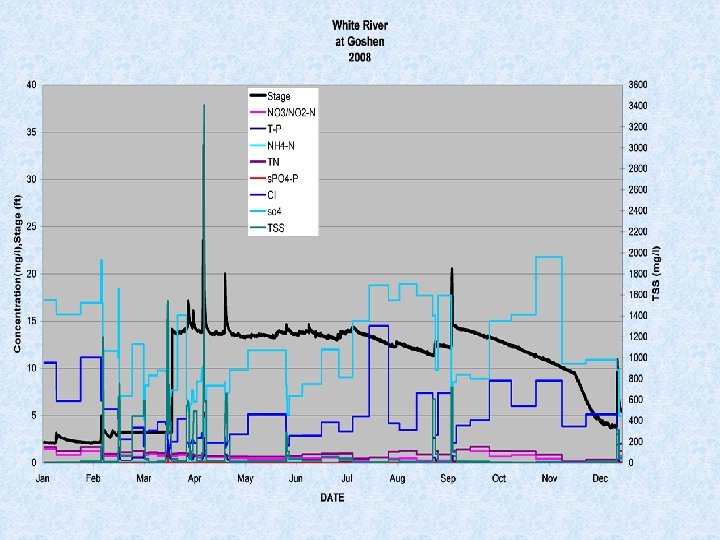
White River near Goshen 2008 Storm and Base-flow Loads and Mean Concentrations Parameter Storm Loads Base Loads (kg) Storm Base Concentrations (mg/l) Discharge (M 3) 352, 003, 227 75, 214, 118 SO 4 2, 412, 067 883, 714 6. 85 11. 75 Cl- 783, 554 373, 661 2. 23 4. 97 NO 3/NO 2 N 130, 167 54, 950 0. 37 0. 73 T-P 256, 002 5, 690 0. 73 0. 08 NH 4 -N 53, 875 2, 469 0. 15 0. 03 T-N 403, 793 74, 907 1. 15 1. 00 s. PO 4 -P 11, 246 626 0. 03 0. 01 TSS 168, 910, 069 1, 324, 206 479. 85 17. 61
White River near Goshen
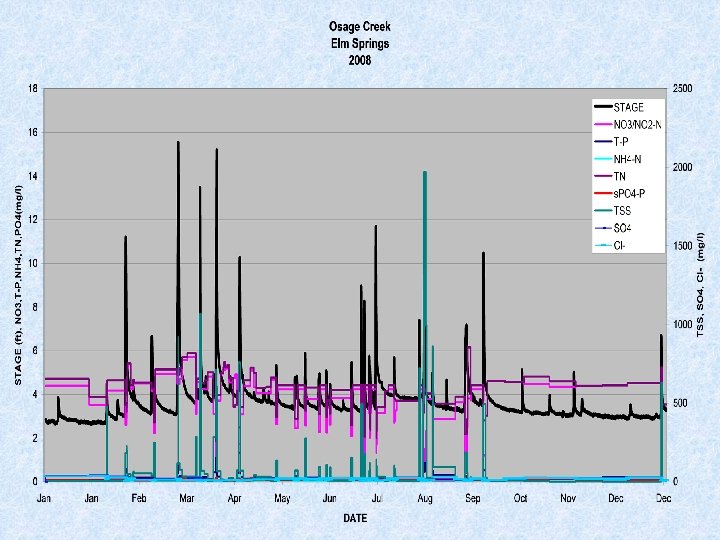
Osage Creek near Elm Springs 2008 Storm and Base-flow Loads and Mean Concentrations Storm Loads Base Loads (kg) Storm Concentr ations (mg/l) Base Concentr ations (mg/l) Discharge (M 3) 148, 229, 762 119, 349, 947 SO 4 1, 806, 811 2, 485, 784 12. 19 20. 83 Cl- 1, 520, 040 2, 433, 803 10. 25 20. 39 NO 3/NO 2 -N 460, 819 507, 235 3. 11 4. 25 T-P 65, 665 16, 108 0. 44 0. 13 NH 4 -N 12, 357 2, 930 0. 08 0. 02 T-N 566, 285 530, 292 3. 82 4. 44 s. PO 4 -P 16, 706 11, 319 0. 11 0. 09 TSS 42, 376, 056 2, 130, 036 285. 88 17. 85
Osage Creek near Elm Springs
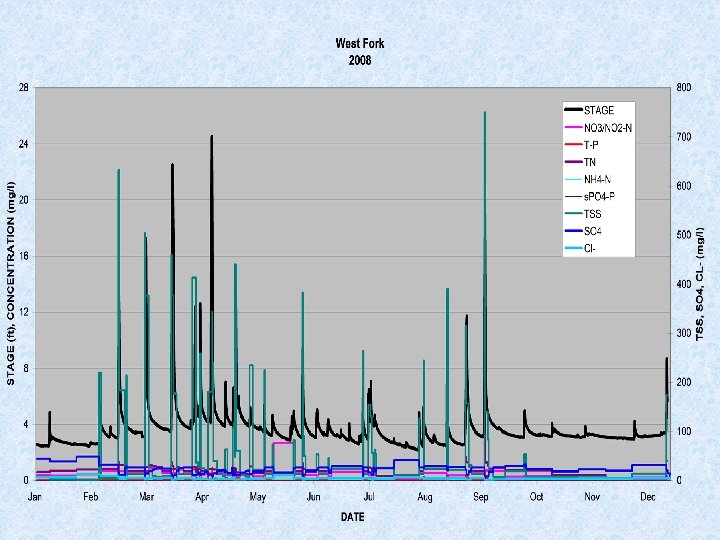
West Fork near Baldwin 2008 Storm and Base-flow Loads and Mean Concentrations Parameter Storm Loads Base Loads (kg) Storm Concentrations (mg/l) Base Concentrations (mg/l) Discharge (M 3) 199, 282, 249 44, 218, 901 SO 4 2, 528, 236 1, 162, 181 12. 69 26. 28 Cl- 559, 928 214, 005 2. 81 4. 84 NO 3/NO 2 -N 83, 995 22, 172 0. 42 0. 50 T-P 89, 294 1, 586 0. 45 0. 036 NH 4 -N 40, 322 1, 025 0. 20 0. 02 T-N 198, 834 29, 530 1. 00 0. 67 s. PO 4 -P 5, 851 376 0. 03 0. 009 TSS 46, 775, 101 573, 090 234. 72 12. 96
West Fork near Elm Springs
Watershed comparison
Watershed comparison
Watershed comparison
Questions?