Visualizing Multidimensional Persistent Homology Matthew L Wright in


.")


")


")
")
")
")
")
")


- Slides: 40
Visualizing Multi-dimensional Persistent Homology Matthew L. Wright in collaboration with Michael Lesnick Institute for Mathematics and its Applications University of Minnesota
What is persistent homology? Persistent homology is an algebraic method for discerning topological features of data. e. g. components, holes, graph structure e. g. set of discrete points, with a metric
Persistent homology emerged in the past 20 years due to the work of: Frosini, Ferri, et. al. (Bologna, Italy) Robins (Boulder, Colorado, USA) Edelsbrunner (Duke, North Carolina, USA) Carlsson, de Silva, et. al. (Stanford, California, USA) Zomorodian (Dartmouth, New Hampshire, USA) and others
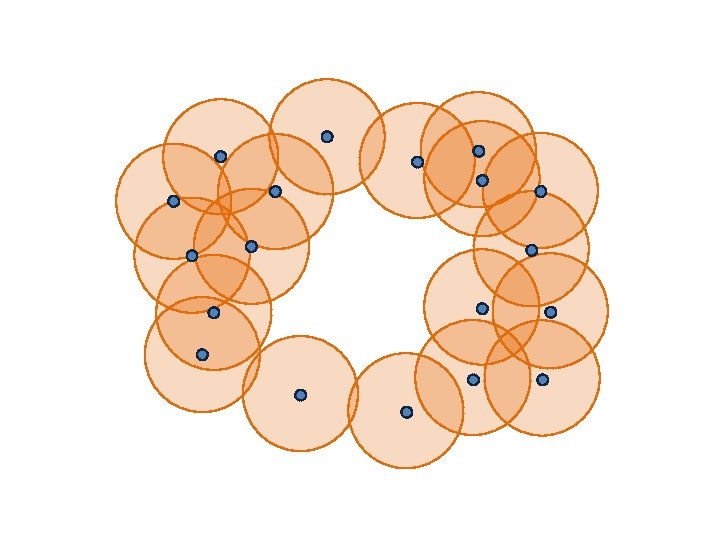
Example: What is the shape of the data? Problem: Discrete points have trivial topology.
Idea: Connect nearby points. Problem: A graph captures connectivity, but ignores higher-order features, such as holes.
Idea: Connect nearby points, build a simplicial complex. 3. Fill in complete simplices. 4. Homology detects the hole.
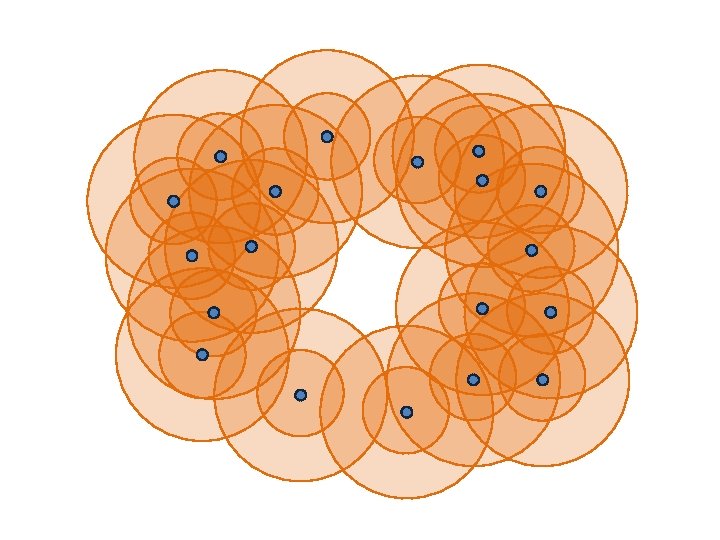
…then we detect noise.
…then we get a giant simplex (trivial homology).
How do we know this hole is significant and not noise?
A collection of bars is a barcode.
Example: Record the barcode:
Example: Short bars represent noise. Long bars represent features. Record the barcode:
A persistence diagram is an alternate depiction of a barcode. Dots far from the diagonal represent features. Dots near the diagonal represent noise.
A barcode is a visualization of an algebraic structure.
A barcode is a visualization of an algebraic structure. This sequence of complexes, with maps, is a filtration.
A barcode is a visualization of an algebraic structure. Filtration:
A barcode is a visualization of an algebraic structure. The structure theorem for finitely generated modules over PIDs implies: Thus, the barcode is a complete discrete invariant.
Stability: Persistence barcodes are stable with respect to pertubations of the data. Cohen-Steiner, Edelsbrunner, Harer (2007) Computation: Zomorodian and Carlsson (2005)
Where has persistent homology been used? Image Processing The space of 3 x 3 high -contrast patches from digital images has the topology of a Klein bottle. Gunnar Carlsson, Tigran Ishkhanov, Vin de Silva, Afra Zomorodian. “On the Local Behavior of Spaces of Natural Images. ” Journal of Computer Vision. Vol. 76, No. 1, 2008, p. 1 – 12. Image credit: Robert Ghrist. “Barcodes: The Persistent Topology of Data. ” Bulletin of the American Mathematical Society. Vol. 45, no. 1, 2008, p. 61 -75.
Where has persistent homology been used? Cancer Research Topological analysis of very high-dimensional breast cancer data can distinguish between different types of cancer. Monica Nicolau, Arnold J. Levine, Gunnar Carlsson. “Topology-Based Data Analysis Identifies a Subgroup of Breast Cancers With a Unique Mutational Profile and Excellent Survival. ” Proceedings of the National Academy of Sciences. Vol. 108, No. 17, 2011, p. 7265 – 7270.
Problem: Persistent homology is sensitive to outliers.
Problem: Persistent homology is sensitive to outliers. Red points in dense regions Do we have to threshold by density? Purple points in sparse regions
Multi-dimensional persistence: Allows us to work with data indexed by two parameters, such as distance and density. distance We obtain a bifiltration: a set of simplicial complexes indexed by two parameters. density
Carlsson and Zomorodian (2009)
Algebraic Structure of Multi-dimensional Persistence We call this a 2 -dimensional persistence module. Problem: The structure of multi-graded modules is much more complicated than that of graded modules. There is no complete, discrete invariant for multi-dimensional persistence modules (Carlsson and Zomorodian, 2007). Thus, there is no multi-dimensional barcode. Question: How can we visualize multi-dimensional persistence?
Concept: Visualize a barcode along any one-dimensional slice of a multi-dimensional parameter space. Along any onedimensional slice, a barcode exists. distance Example: density
Example: 1 st homology (holes)
Example: 1 st homology (holes)
Example: 1 st homology (holes)
Example: 1 st homology (holes)
Example: 1 st homology (holes)
Example: 1 st homology (holes)
R ank I nvariant V isualization and E xploration Tool Mike Lesnick and Matthew Wright
How RIVET Works RIVET pre-computes a relatively small number of discrete barcodes, from which it draws barcodes in real-time. Endpoints of bars appear in the same order in each of these two barcodes. Endpoints of bars in this barcode have a different order.
Endpoints of bars are the projections of support points of the bigraded Betti numbers onto the slice line. We can identify lines for which these projections agree.
Data Structure At the core of RIVET is a line arrangement. Each line corresponds to a point where projections of two support points agree. Cells correspond to families of lines with the same discrete barcode. When the user selects a slice line, the appropriate cell is found, and its discrete barcode is re-scaled and displayed.
Performance
For more information: Robert Ghrist. “Barcodes: The Persistent Topology of Data. ” Bulletin of the American Mathematical Society. Vol. 45, no. 1, 2008, p. 61 -75. Gunnar Carlsson and Afra Zomorodian. “The Theory of Multidimensional Persistence. ” Discrete and Computational Geometry. Vol. 42, 2009, p. 71 -93. Michael Lesnick and Matthew Wright. “Efficient Representation and Visualization of 2 -D Persistent Homology. ” in preparation.