Ultralarge Multiple Sequence Alignment Tandy Warnow Founder Professor

 Orangutan From the Tree of the Life Website, University of Arizona")


 Deletion Mutation …ACGGTGCAGTTACCA… …ACCAGTCACCA…")


: a scientific grand challenge 1 S 1 = AGGCTATCACCTGACCTCCA S")


 FP: false positive (incorrect edge) FP 50% error")
 • Probcons (and Probtree)")
")


 performance 1000 -taxon models, ordered by difficulty – rate of evolution")
 SATé-1: up to 8 K SATé-2: up to")


 • Select random subset of sequences, and build “backbone alignment”")

 • Select random subset of sequences, and build “backbone alignment”")


: – 10 K to 1, 000")


 took 2.")

 given 12 processors")

: leading method for statistical co-estimation of alignments")
 MAFFT 40% PASTA 30%")


 Decomposition to 100")


 on both biological and simulated")


 and Siavash Mirarab (now")
- Slides: 75
Ultra-large Multiple Sequence Alignment Tandy Warnow Founder Professor of Engineering The University of Illinois at Urbana-Champaign http: //tandy. cs. illinois. edu
Phylogeny (evolutionary tree) Orangutan From the Tree of the Life Website, University of Arizona Gorilla Chimpanzee Human
Phylogenies and Applications Basic Biology: How did life evolve? Applications of phylogenies to: protein structure and function population genetics human migrations metagenomics
Hard Computational Problems NP-hard problems Large datasets 100, 000+ sequences thousands of genes “Big data” complexity: model misspecification fragmentary sequences errors in input data streaming data
Phylogeny Problem U AGGGCAT V W TAGCCCA X TAGACTT Y TGCACAA X U Y V W TGCGCTT
Much is known about this problem from a mathematical and empirical viewpoint U AGGGCAT V W TAGCCCA X TAGACTT Y TGCACAA X U Y V W TGCGCTT
However… U V W AGGGCATGA AGAT X TAGACTT Y TGCACAA X U Y V W TGCGCTT
Indels (insertions and deletions) Deletion Mutation …ACGGTGCAGTTACCA… …ACCAGTCACCA…
Deletion Substitution …ACGGTGCAGTTACCA… Insertion …ACCAGTCACCTA… …ACGGTGCAGTTACC-A… …AC----CAGTCACCTA… The true multiple alignment – Reflects historical substitution, insertion, and deletion events – Defined using transitive closure of pairwise alignments computed on edges of the true tree
Input: unaligned sequences S 1 S 2 S 3 S 4 = = AGGCTATCACCTGACCTCCA TAGCTATCACGACCGC TAGCTGACCGC TCACGACA
Phase 1: Alignment S 1 S 2 S 3 S 4 = = AGGCTATCACCTGACCTCCA TAGCTATCACGACCGC TAGCTGACCGC TCACGACA S 1 S 2 S 3 S 4 = = -AGGCTATCACCTGACCTCCA TAG-CTATCAC--GACCGC-TAG-CT-------GACCGC----TCAC--GACCGACA
Phase 2: Construct tree S 1 S 2 S 3 S 4 = = AGGCTATCACCTGACCTCCA TAGCTATCACGACCGC TAGCTGACCGC TCACGACA S 1 S 4 S 1 S 2 S 3 S 4 S 2 S 3 = = -AGGCTATCACCTGACCTCCA TAG-CTATCAC--GACCGC-TAG-CT-------GACCGC----TCAC--GACCGACA
Phylogenomic pipeline • Select taxon set and markers • Gather and screen sequence data, possibly identify orthologs • Compute multiple sequence alignments for each locus, and construct gene trees • Compute species tree or network: – Combine the estimated gene trees, OR – Estimate a tree from a concatenation of the multiple sequence alignments • Get statistical support on each branch (e. g. , bootstrapping) • Estimate dates on the nodes of the phylogeny • Use species tree with branch support and dates to understand biology
Phylogenomic pipeline • Select taxon set and markers • Gather and screen sequence data, possibly identify orthologs • Compute multiple sequence alignments for each locus, and construct gene trees • Compute species tree or network: – Combine the estimated gene trees, OR – Estimate a tree from a concatenation of the multiple sequence alignments • Get statistical support on each branch (e. g. , bootstrapping) • Estimate dates on the nodes of the phylogeny • Use species tree with branch support and dates to understand biology
Multiple Sequence Alignment (MSA): a scientific grand challenge 1 S 1 = AGGCTATCACCTGACCTCCA S 2 = TAGCTATCACGACCGC S 3 = TAGCTGACCGC … Sn = TCACGACA S 1 S 2 S 3 … Sn = -AGGCTATCACCTGACCTCCA = TAG-CTATCAC--GACCGC-= TAG-CT-------GACCGC-= -------TCAC--GACCGACA Novel techniques needed for scalability and accuracy NP-hard problems and large datasets Current methods do not provide good accuracy Few methods can analyze even moderately large datasets Many important applications besides phylogenetic estimation 1 Frontiers in Massive Data Analysis, National Academies Press, 2013
This talk • “Big data” multiple sequence alignment • SATé (Science 2009, Systematic Biology 2012) and PASTA (RECOMB and J Comp Biol 2015), methods for co-estimation of alignments and trees • UPP (Genome Biology 2015): ultra-large multiple sequence alignment, using the “Ensemble of HMMs technique”. • Evaluating BAli-Phy on biological and simulated datasets
First Align, then Compute the Tree S 1 S 2 S 3 S 4 = = AGGCTATCACCTGACCTCCA TAGCTATCACGACCGC TAGCTGACCGC TCACGACA S 1 S 4 S 1 S 2 S 3 S 4 S 2 S 3 = = -AGGCTATCACCTGACCTCCA TAG-CTATCAC--GACCGC-TAG-CT-------GACCGC----TCAC--GACCGACA
Simulation Studies S 1 = AGGCTATCACCTGACCTCCA S 2 = TAGCTATCACGACCGC S 3 = TAGCTGACCGC S 4 = TCACGACA Unaligned Sequences S 1 = AGGCTATCACCTGACCTCCA S 2 = TAG-CTATCAC--GACCGC-S 3 = TAG-CT-------GACCGC-S 4 = -------TCAC--GACCGACA S 1 S 2 S 4 S 3 True tree and alignment S 1 = AGGCTATCACCTGACCTCCA S 2 = TAG-CTATCAC--GACCGC-S 3 = TAG-C--T-----GACCGC-S 4 = T---C-A-CGACCGA----CA S 1 S 4 Compare S 2 S 3 Estimated tree and alignment
FN FN: false negative (missing edge) FP: false positive (incorrect edge) FP 50% error rate
Two-phase estimation Alignment methods • Clustal • POY (and POY*) • Probcons (and Probtree) • Probalign • MAFFT • Muscle • Di-align • T-Coffee • Prank (PNAS 2005, Science 2008) • Opal (ISMB and Bioinf. 2007) • FSA (PLo. S Comp. Bio. 2009) • Infernal (Bioinf. 2009) • Etc. Phylogeny methods • • Bayesian MCMC Maximum parsimony Maximum likelihood Neighbor joining Fast. ME UPGMA Quartet puzzling Etc. RAx. ML: heuristic for large-scale ML optimization
1000 -taxon models, ordered by difficulty (Liu et al. , 2009)
SATé “Family” of methods • Iterative divide-and-conquer methods – Each iteration re-aligns the sequences using the current tree, running preferred MSA methods on small local subsets, and merging subset alignments – Each iteration computes an ML tree on the current alignment, under the GTR (Generalized Time Reversible) Markov model of evolution • Note: these methods are “MSA boosters”, designed to improve accuracy and/or scalability of the base method • We show results using MAFFT-l-ins-i to align subsets
Re-aligning on a tree C A B D Decompose dataset A B C D Align subsets Estimate ML tree on merged alignment ABCD A B C D Merge subalignments
SATé and PASTA Algorithms Obtain initial alignment and estimated ML tree Tree Use tree to compute new alignment Estimate ML tree on new alignment Alignment Repeat until termination condition, and return the alignment/tree pair with the best ML score
SATé-1 (Science 2009) performance 1000 -taxon models, ordered by difficulty – rate of evolution generally increases from left to right SATé-1 24 hour analysis, on desktop machines (Similar improvements for biological datasets) SATé-1 can analyze up to about 8, 000 sequences.
SATé-1 and SATé-2 (Systematic Biology, 2012) SATé-1: up to 8 K SATé-2: up to ~50 K 1000 -taxon models ranked by difficulty
SATé variants differ only in the decomposition strategy C A B D Decompose dataset Estimate ML tree on merged alignment A B C D Align subsets ABCD A B C D Merge subalignments
PASTA merging: Step 1 C D B A Compute a spanning tree connecting alignment subsets E
PASTA merging: Step 2 C CD CD BD D AB AB BD DE B A Use Opal (or Muscle) to merge adjacent subset alignments in the spanning tree DE E
PASTA merging: Step 3 C AB + BD = ABD + CD = ABCD + DE = ABCDE CD BD D AB B DE A Use transitivity to merge all pairwise-merged alignments from Step 2 into final an alignment on entire dataset Overall: O(n log(n) + L) E
1 kp: Thousand Transcriptome Project G. Ka-Shu Wong U Alberta J. Leebens-Mack U Georgia N. Wickett Northwestern N. Matasci i. Plant T. Warnow, UIUC S. Mirarab, UT-Austin N. Nguyen, UT-Austin Plus many other people… First study (Wickett, Mirarab, et al. , PNAS 2014) had ~100 species and ~800 genes, gene trees and alignments estimated using SATé, and a coalescent-based species tree estimated using ASTRAL Second study: Plant Tree of Life based on transcriptomes of ~1200 species, and more than 13, 000 gene families (most not single copy) Gene Tree Incongruence Challenges: Species tree estimation from conflicting gene trees Gene tree estimation of datasets with > 100, 000 sequences
1 KP dataset: more than 100, 000 p 450 amino-acid sequences, many fragmentary
1 KP dataset: more than 100, 000 p 450 amino-acid sequences, many fragmentary All standard multiple sequence alignment methods we tested performed poorly on datasets with fragments.
1 kp: Thousand Transcriptome Project G. Ka-Shu Wong U Alberta J. Leebens-Mack U Georgia N. Wickett Northwestern N. Matasci i. Plant T. Warnow, UIUC S. Mirarab, UT-Austin N. Nguyen UT-Austin Plus many other people… Plant Tree of Life based on transcriptomes of ~1200 species More than 13, 000 gene families (most not single copy) Gene Tree Incongruence Challenge: Alignment of datasets with > 100, 000 sequences with many fragmentary sequences
UPP = “Ultra-large multiple sequence alignment using Phylogeny-aware Profiles” Nguyen, Mirarab, and Warnow. Genome Biology, 2014. Purpose: highly accurate large-scale multiple sequence alignments, even in the presence of fragmentary sequences.
UPP = “Ultra-large multiple sequence alignment using Phylogeny-aware Profiles” Nguyen, Mirarab, and Warnow. Genome Biology, 2014. Purpose: highly accurate large-scale multiple sequence alignments, even in the presence of fragmentary sequences. Uses an ensemble of HMMs
Simple idea (not UPP) • Select random subset of sequences, and build “backbone alignment” • Construct a Hidden Markov Model (HMM) on the backbone alignment • Add all remaining sequences to the backbone alignment using the HMM
One Hidden Markov Model for the entire alignment?
Simple idea (not UPP) • Select random subset of sequences, and build “backbone alignment” • Construct a Hidden Markov Model (HMM) on the backbone alignment • Add all remaining sequences to the backbone alignment using the HMM
This approach works well if the dataset is small and has low evolutionary rates, but is not very accurate otherwise. • Select random subset of sequences, and build “backbone alignment” • Construct a Hidden Markov Model (HMM) on the backbone alignment • Add all remaining sequences to the backbone alignment using the HMM
One Hidden Markov Model for the entire alignment? HMM 1
Or 2 HMMs? HMM 1 HMM 2
Or 4 HMMs? HMM 1 HMM 3 HMM 2 HMM 4
Or all 7 HMMs? HMM 1 HMM 2 HMM 4 m HMM 7 HMM 3 HMM 5 HMM 6
UPP Algorithmic Approach 1. Select random subset of full-length sequences, and build “backbone alignment” 2. Construct an “Ensemble of Hidden Markov Models” on the backbone alignment 3. Add all remaining sequences to the backbone alignment using the Ensemble of HMMs
Evaluation • Simulated datasets (some have fragmentary sequences): – 10 K to 1, 000 sequences in RNASim – complex RNA sequence evolution simulation – 1000 -sequence nucleotide datasets from SATé papers – 5000 -sequence AA datasets (from Fast. Tree paper) – 10, 000 -sequence Indelible nucleotide simulation • Biological datasets: – Proteins: largest Bali. BASE and Hom. Fam – RNA: 3 CRW datasets up to 28, 000 sequences
RNASim: alignment error All methods given 24 hrs on a 12 -core machine Note: Mafft was run under default settings for 10 K and 50 K sequences and under Parttree for 100 K sequences, and fails to complete under any setting For 200 K sequences. Clustal-Omega only completes on 10 K dataset.
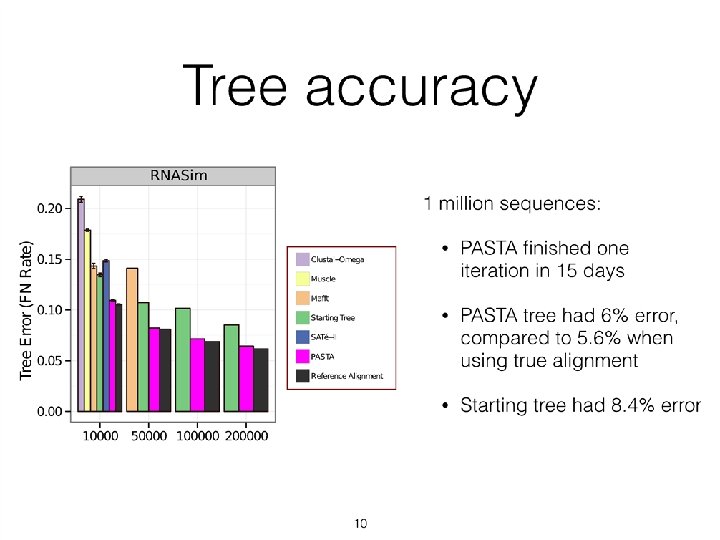
RNASim: tree error All methods given 24 hrs on a 12 -core machine Note: Mafft was run under default settings for 10 K and 50 K sequences and under Parttree for 100 K sequences, and fails to complete under any setting For 200 K sequences. Clustal-Omega only completes on 10 K dataset.
RNASim Million Sequences: alignment error Notes: • We show alignment error using average of SP-FN and SP-FP. • UPP variants have better alignment scores than PASTA. • (Not shown: Total Column Scores – PASTA more accurate than UPP) • No other methods tested could complete on these data • PASTA under-aligns: its alignment is 43 times wider than true alignment (~900 Gb of disk space). UPP alignments were closer in length to true alignment (0. 93
RNASim Million Sequences: tree error Using 12 processors: • UPP(Fast, No. Decomp) took 2. 2 days, • UPP(Fast) took 11. 9 days, and • PASTA took 10. 3 days
UPP vs. PASTA: impact of fragmentation Under high rates of evolution, PASTA is badly impacted by fragmentary sequences (the same is true for other methods). Under low rates of evolution, PASTA can still be highly accurate (data not shown). UPP continues to have good accuracy even on datasets with many fragments under all rates of evolution. Performance on fragmentary datasets of the 1000 M 2 model condition
UPP Running Time Wall-clock time used (in hours) given 12 processors
Co-estimation would be much better!!! S 1 S 2 S 3 S 4 = = AGGCTATCACCTGACCTCCA TAGCTATCACGACCGC TAGCTGACCGC TCACGACA S 1 S 4 S 1 S 2 S 3 S 4 S 2 S 3 = = -AGGCTATCACCTGACCTCCA TAG-CTATCAC--GACCGC-TAG-CT-------GACCGC----TCAC--GACCGACA
What about BAli-Phy? BAli-Phy (Redelings and Suchard): leading method for statistical co-estimation of alignments and trees Like Bayesian phylogeny estimation, it is expected to be the most rigorous and accurate technique for estimating trees and alignments!
BAli-Phy: Better than PASTA! Total-Column Score Alignment Accuracy (TC score) MAFFT 40% PASTA 30% BAli-Phy 20% 10% 0% # Taxa: Simulator 100 Indelible (DNA) 200 100 200 RNAsim (RNA) Simulated nucleotide datasets with 100 or 200 sequences (unpublished data from Mike Nute’s Ph. D dissertation). *Averages over 10 replicates
But: BAli-Phy is limited to small datasets From www. bali-phy. org/README. html, 5. 2. 1. Too many taxa? “BAli-Phy is quite CPU intensive, and so we recommend using 50 or fewer taxa in order to limit the time required to accumulate enough MCMC samples. (Despite this recommendation, data sets with more than 100 taxa have occasionally been known to converge. ) We recommend initially pruning as many taxa as possible from your data set, then adding some back if the MCMC is not too slow. ”
Re-aligning on a tree C A B D Decompose dataset Estimate ML tree on merged alignment ABCD A B C D Align subsets: MAFFT A B C D Merge subalignments
Re-aligning on a tree C A B D Decompose dataset Estimate ML tree on merged alignment ABCD A B C D Align subsets: BAli. Phy? ? A B C D Merge subalignments
Results on 1000 -sequence datasets (Comparing default PASTA to PASTA+BAli. Phy) Decomposition to 100 -sequence subsets, one iteration of PASTA+BAli-Phy
Results on 10, 000 -sequence datasets (Comparing UPP variants where the backbone alignment is computed using either default PASTA or PASTA+BAli-Phy)
Benchmarking Statistical Multiple Sequence Alignment Nute, Saleh, and Warnow 2018 Systematic Biology syy 068, 2018, doi: 10. 1093/sysbio/syy 068.
Study design • Goal: Evaluate Bali-Phy (Redelings and Suchard) on both biological and simulated datasets, in comparison to leading alignment methods on small protein sequence datasets (at most 27 sequences) • Metrics: Modeller score (precision), SP-score (recall), Expansion ratio (normalized alignment length), and running time • Datasets: 120 simulated datasets (6 model conditions) and biological datasets (4 biological benchmarks) 1192 • Specific note: For each dataset, Bali-Phy was run independently on 32 processors for 48 hours, the burn-in was discarded, and the posterior decoding (PD) alignment was then computed. These Bali-Phy analyses used 230 CPU years on Blue Waters (supercomputer at NCSA).
Modeler vs SP-Score on 120 Simulated Datasets BAli-Phy is best! Systematic Biology, Volume 68, Issue 3, May 2019, Pages 396– 411, https: //doi. org/10. 1093/sysbio/syy 068 The content of this slide may be subject to copyright: please see the slide notes for details.
Expansion Ratios on 120 Simulated Datasets BAli-Phy is best!
Modeler score vs SP-score on 1192 biological datasets T-Coffee and PROMALS are best! BAli-Phy good for Modeler score, but not so good for SP-Score (e. g. , MAFFT better) Systematic Biology, Volume 68, Issue 3, May 2019, Pages 396– 411, https: //doi. org/10. 1093/sysbio/syy 068 The content of this slide may be subject to copyright: please see the slide notes for details.
Modeler Score on 1192 Biological datasets BAli-Phy has the best modeler score
SP-score on 1192 Biological datasets BAli-Phy not competitive for SP-score (but best method depends on % ID)
Expansion Ratio on 1192 Biological datasets BAli-Phy under-aligns
Running Time on 4 biological datasets with 17 sequences each BAli-Phy benefits from a long running time. Therefore, we used >2 months for each dataset.
Observations • Bali-Phy is much more accurate than all other methods on simulated datasets • Bali-Phy is generally less accurate than the top half of these methods on biological datasets, especially with respect to SP-score (recall) • Average percent pairwise ID impacts all the measures of accuracy for all methods, and changes relative performance
We do not know why there is a difference in accuracy. Most likely not an issue of failure of the MCMC analyses to converge (48 hours, 32 processors, small numbers of sequences). Possible explanations: 1. Model misspecification (proteins don’t evolve under the Bali-Phy model) 2. Structural alignments and evolutionary alignments are different 3. The structural alignments are not correct (perhaps over-aligned) All these explanations are likely true, but the relative contributions are unknown.
Final comments • MSA is challenging, but algorithmic techniques can improve accuracy and scalability: – Dataset size can be addressed using good divide-andconquer approaches. – Heterogeneity in sequence length can be addressed using “local alignment” approaches, such as profile HMMs, with ensembles of profile HMMs providing improved accuracy. • Yet the differences between performance on biological and simulated datasets is troubling.
The Tree of Life: Multiple Challenges Scientific challenges: • • • Ultra-large multiple-sequence alignment Gene tree estimation Metagenomic classification Alignment-free phylogeny estimation Supertree estimation Estimating species trees from many gene trees Genome rearrangement phylogeny Reticulate evolution Visualization of large trees and alignments Data mining techniques to explore multiple optima Theoretical guarantees under Markov models of evolution Techniques: applied probability theory, graph theory, supercomputing, and heuristics Testing: simulations and real data
Acknowledgments PASTA and UPP: Nam Nguyen (now postdoc at UIUC) and Siavash Mirarab (now faculty at UCSD), undergrad: Keerthana Kumar (at UT-Austin) PASTA+BAli-Phy: Mike Nute (Ph. D student at UIUC) Evaluating BAli-Phy: Mike Nute and Ehsan Saleh (Ph. D students at UIUC) Current NSF grants: ABI-1458652 (multiple sequence alignment) Grainger Foundation (at UIUC), and UIUC TACC, UTCS, Blue Waters, and UIUC campus cluster PASTA, UPP, SEPP, and TIPP are available on github at https: //github. com/smirarab/; see also PASTA+BAli-Phy at http: //github. com/MGNute/pasta Papers available at http: //tandy. cs. illinois. edu/MSAproject. html