Third Year WMAP Results Dave Wilkinson WMAP A



- Slides: 51
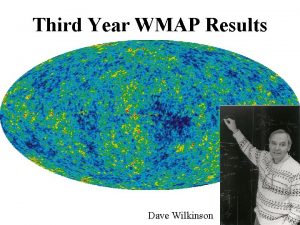
Third Year WMAP Results Dave Wilkinson
WMAP A partnership between NASA/GSFC and Princeton Science Team: NASA/GSFC Bob Hill Gary Hinshaw Al Kogut Michele Limon Nils Odegard Janet Weiland Ed Wollack Johns Hopkins Chuck Bennett (PI) Brown UCLA Greg Tucker Ned Wright UBC Chicago Mark Halpern Cornell Rachel Bean Stephan Meyer Hiranya Peiris Microsoft Chris Barnes CITA Penn UT Austin Olivier Dore Mike Nolta Licia Verde Eiichiro Komatsu Princeton Norm Jarosik Lyman Page David Spergel.
What’s New in the Measurement? Much better understanding of instrument, noise, gain, beams, and mapmaking. Direct measurement of CMB polarization. Three times as much data, sqrt(3) smaller errors in maps: more than 50 x reduction in model parameter space.
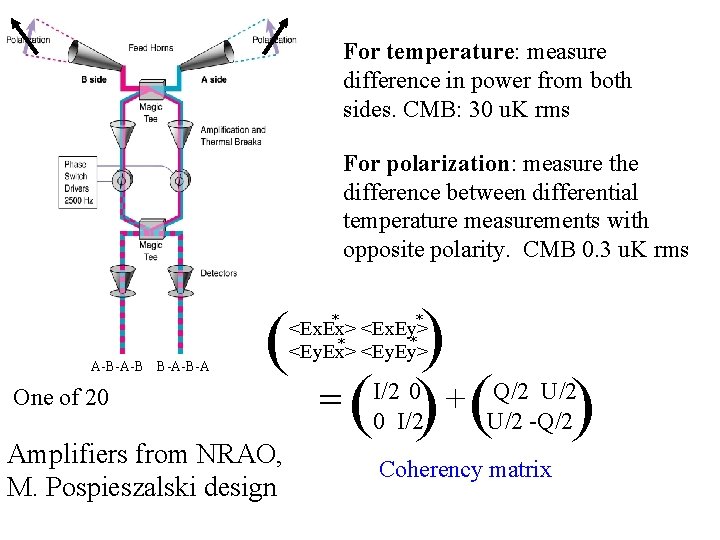
For temperature: measure difference in power from both sides. CMB: 30 u. K rms For polarization: measure the difference between differential temperature measurements with opposite polarity. CMB 0. 3 u. K rms A-B-A-B-A ( One of 20 Amplifiers from NRAO, M. Pospieszalski design ) = ( ) +( * * <Ex. Ex> <Ex. Ey> * * <Ey. Ex> <Ey. Ey> I/2 0 0 I/2 ) Q/2 U/2 -Q/2 Coherency matrix
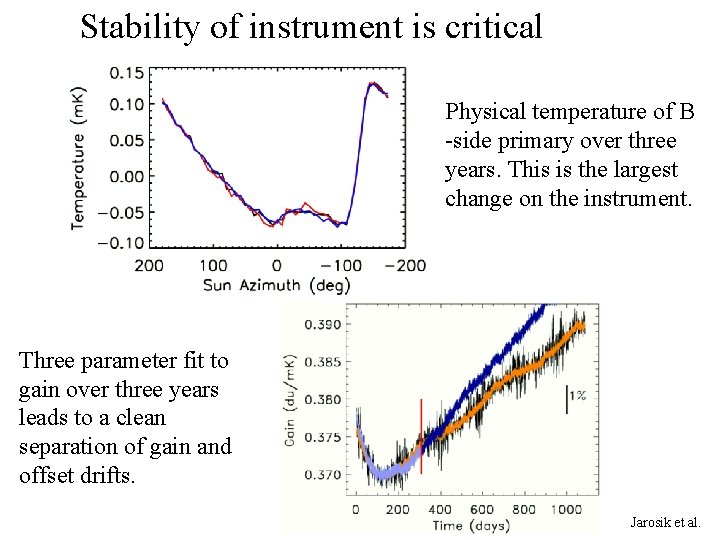
Stability of instrument is critical Physical temperature of B -side primary over three years. This is the largest change on the instrument. Three parameter fit to gain over three years leads to a clean separation of gain and offset drifts. Jarosik et al.
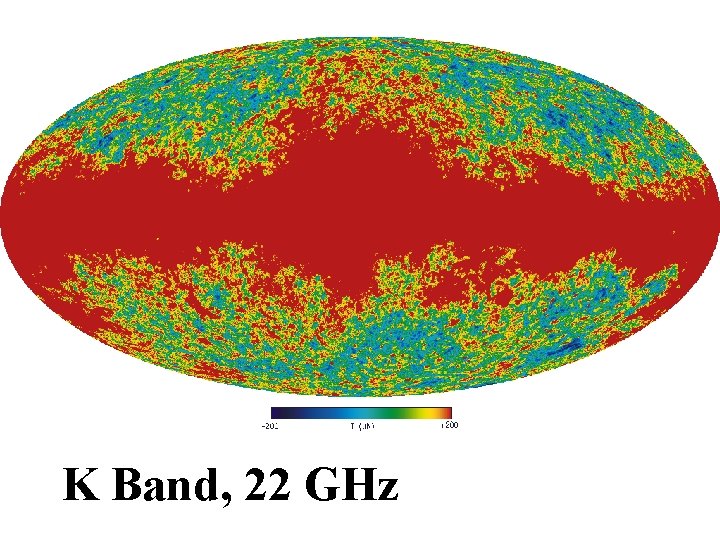
K Band, 22 GHz
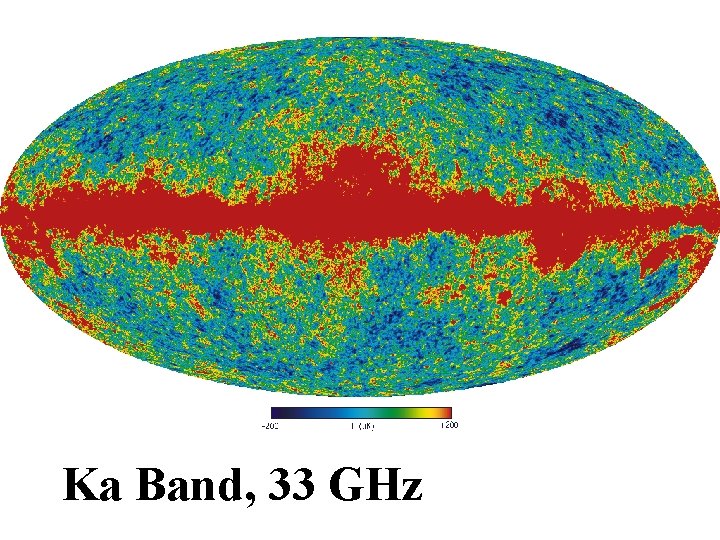
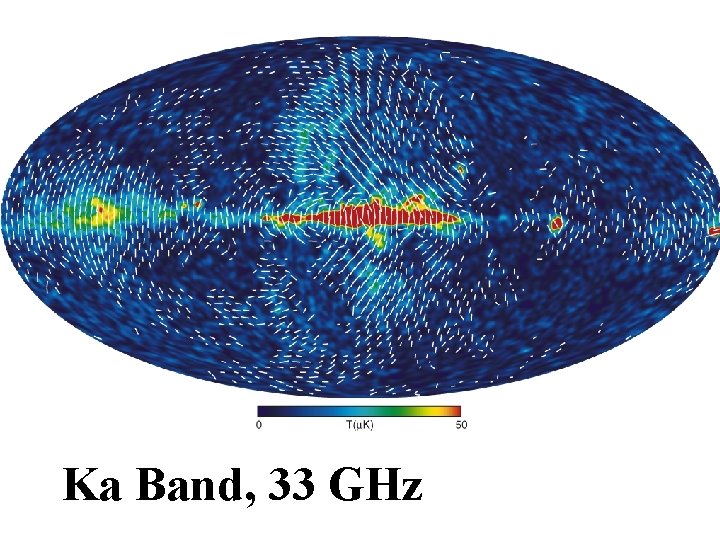
Ka Band, 33 GHz
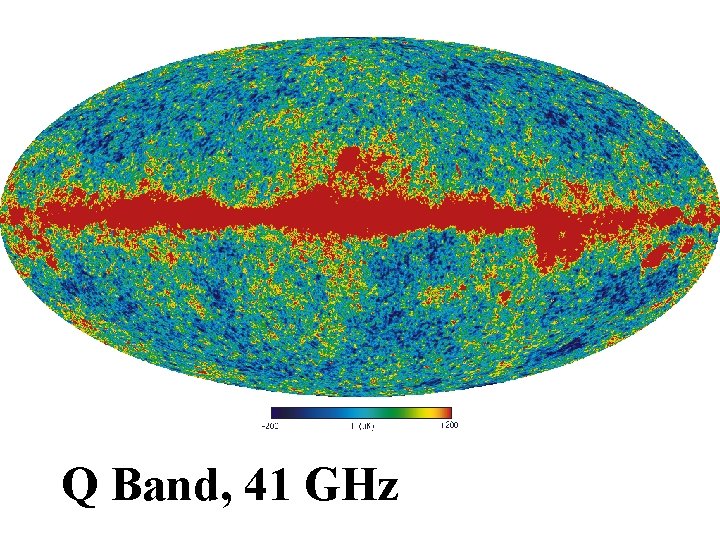
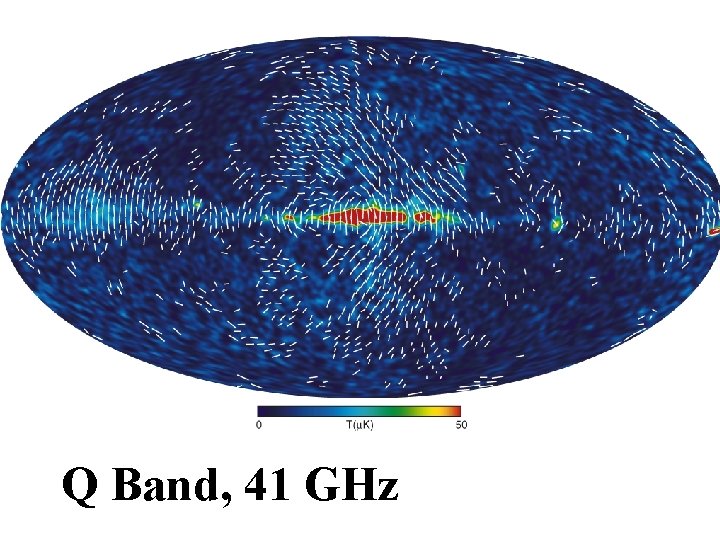
Q Band, 41 GHz
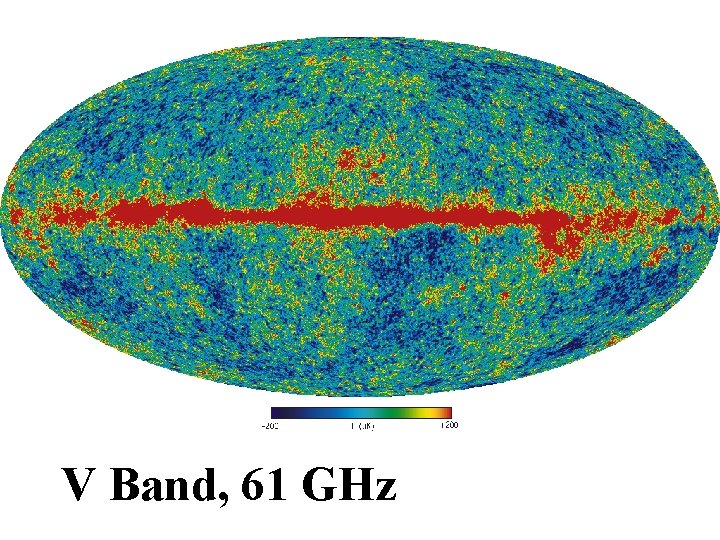
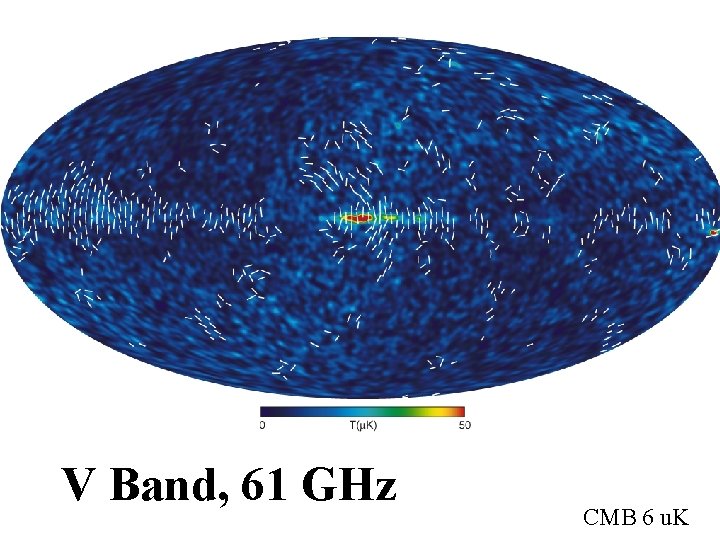
V Band, 61 GHz
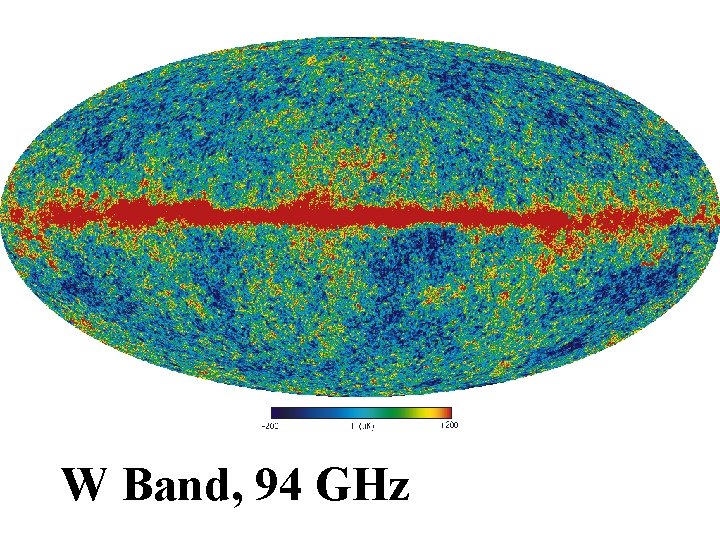
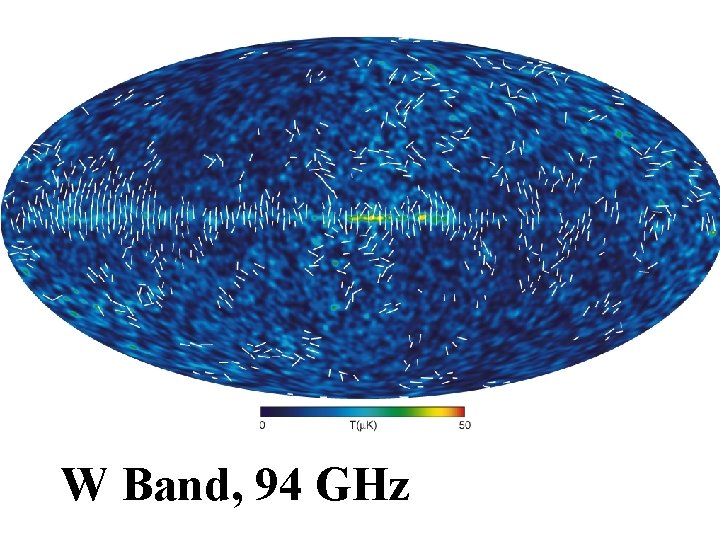
W Band, 94 GHz
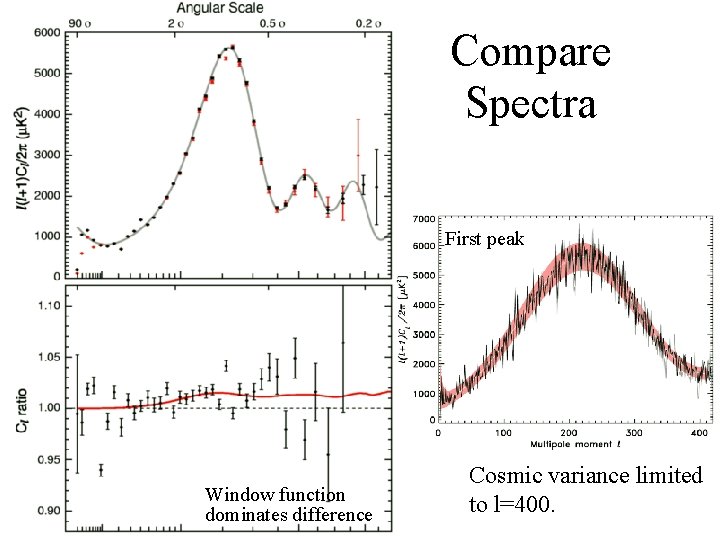
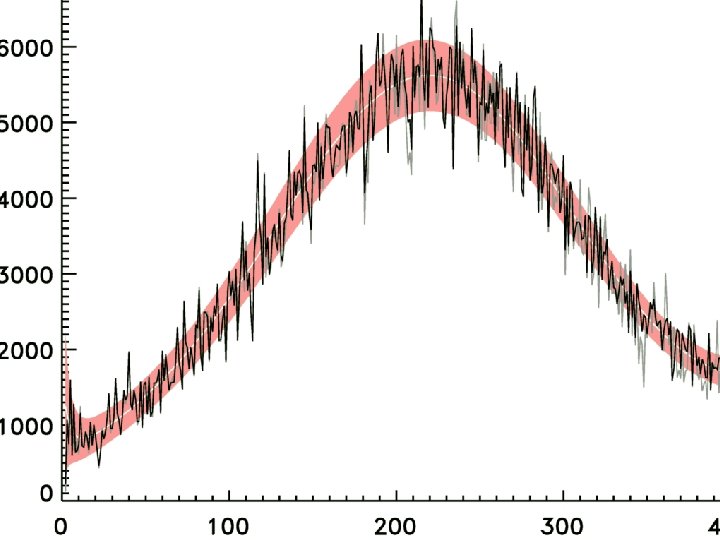
Compare Spectra First peak Window function dominates difference Cosmic variance limited to l=400.
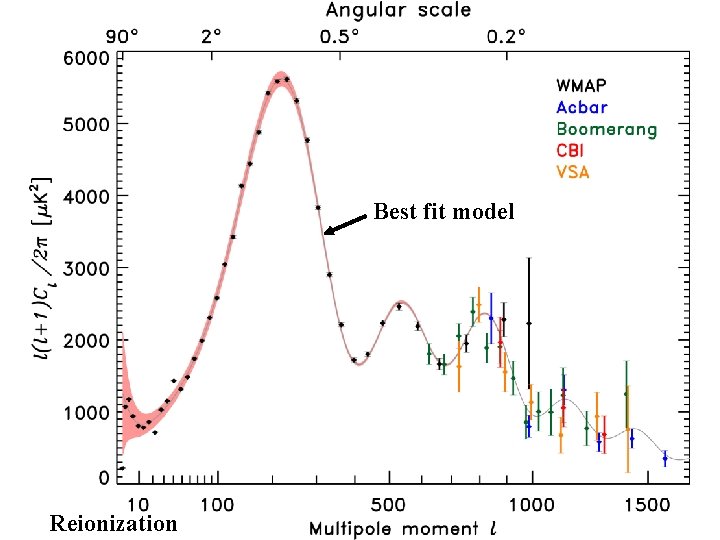
Best fit model Reionization
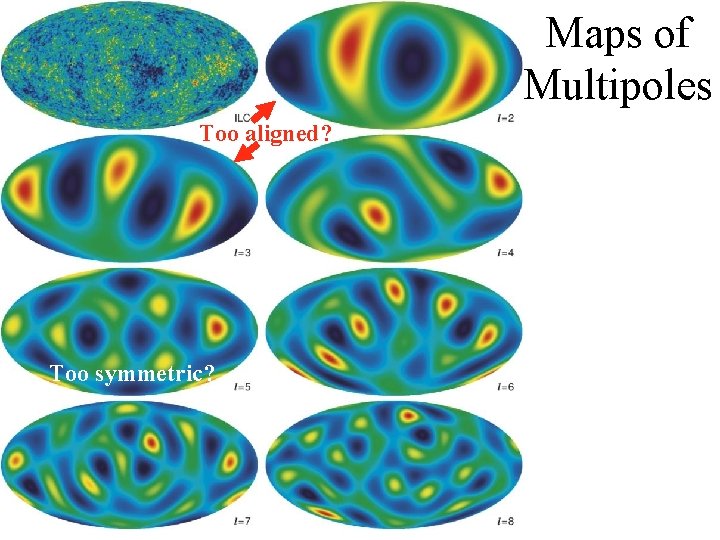
Maps of Multipoles Too aligned? Too symmetric?
Summary of Temperature Maps New improved power spectrum. No clear glitches, low-l less anomalous, clear second peak. Maximum likelihood for low l (Efstathiou, Seljak et al. ) Data + completely new pipeline consistent with first year. Calibration error still 0. 5%
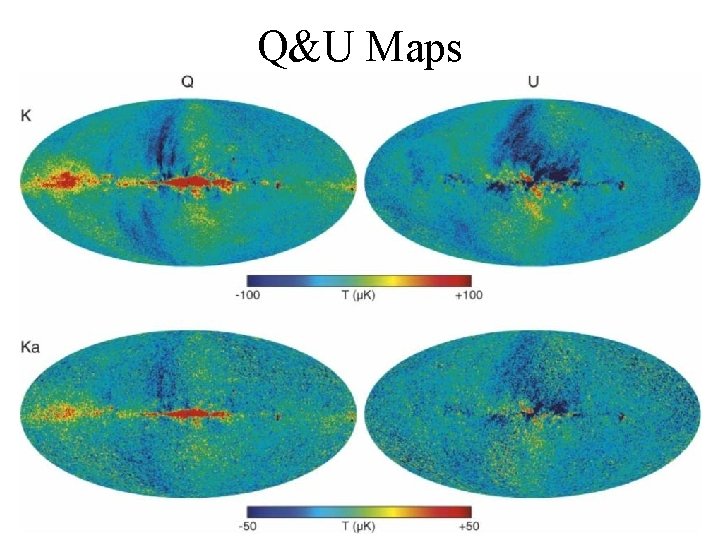
Polarization First all sky measurement of polarized foreground emission. New measurement of optical depth to the surface of last scattering. Direct measurement of low-l E modes.
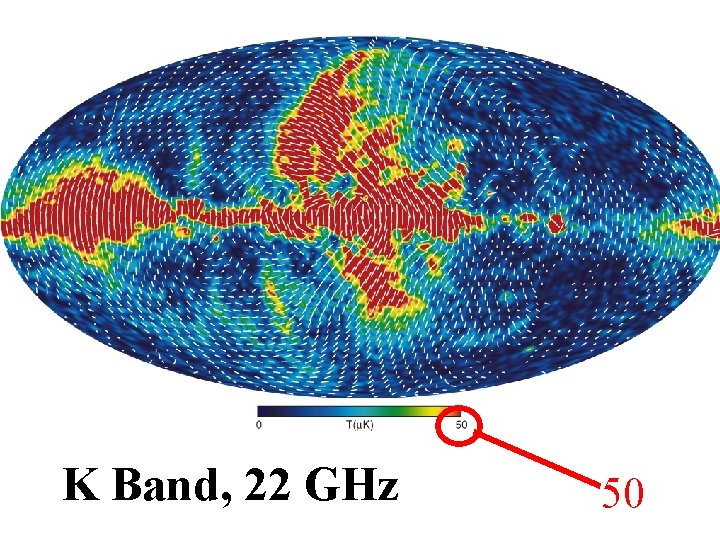
K Band, 22 GHz 50
Ka Band, 33 GHz
Q Band, 41 GHz
V Band, 61 GHz CMB 6 u. K
W Band, 94 GHz
Q&U Maps
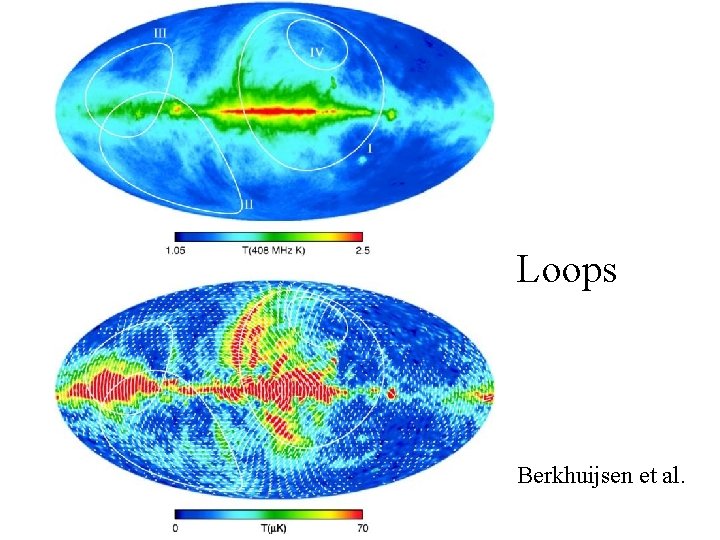
Blowouts Loops Berkhuijsen et al.
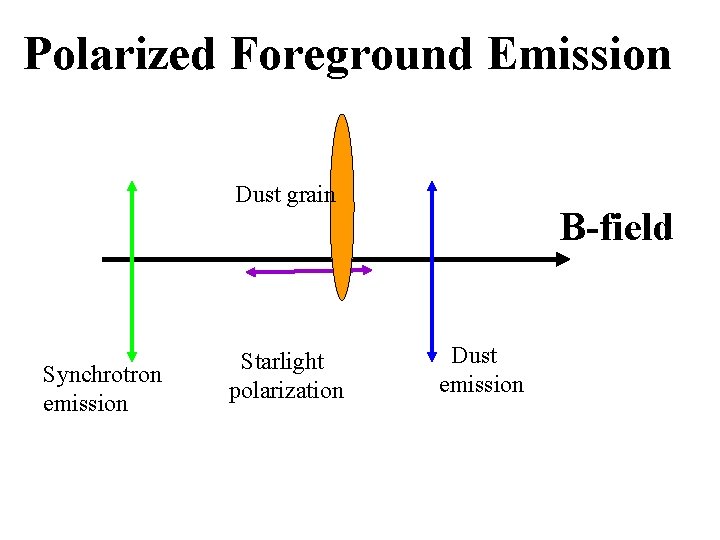
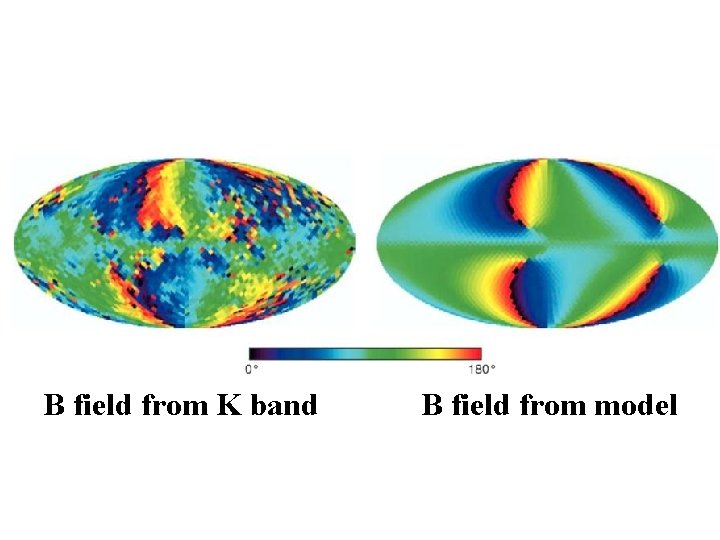
Polarized Foreground Emission Dust grain Synchrotron emission Starlight polarization B-field Dust emission
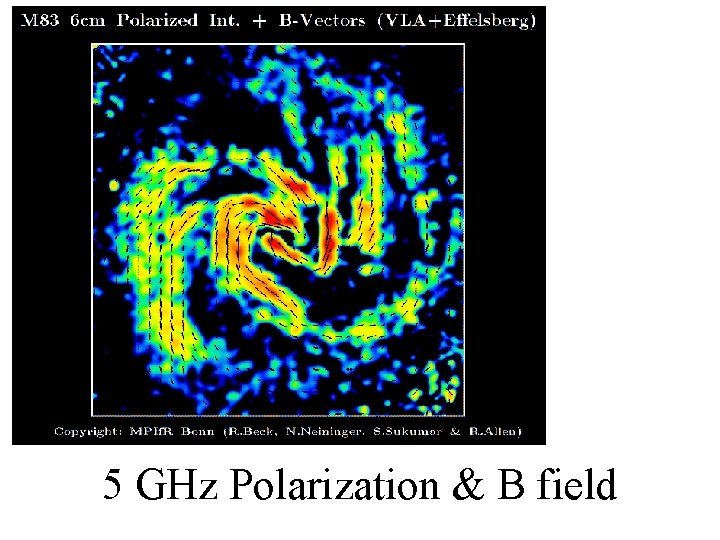
5 GHz Polarization & B field
B field from K band B field from model
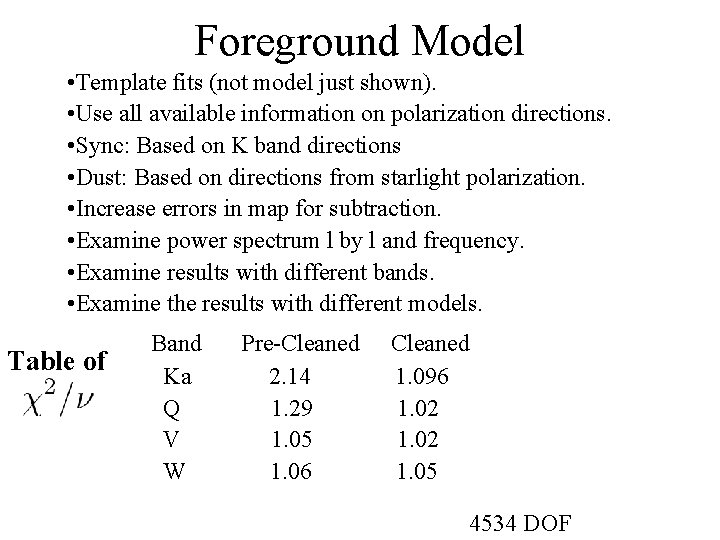
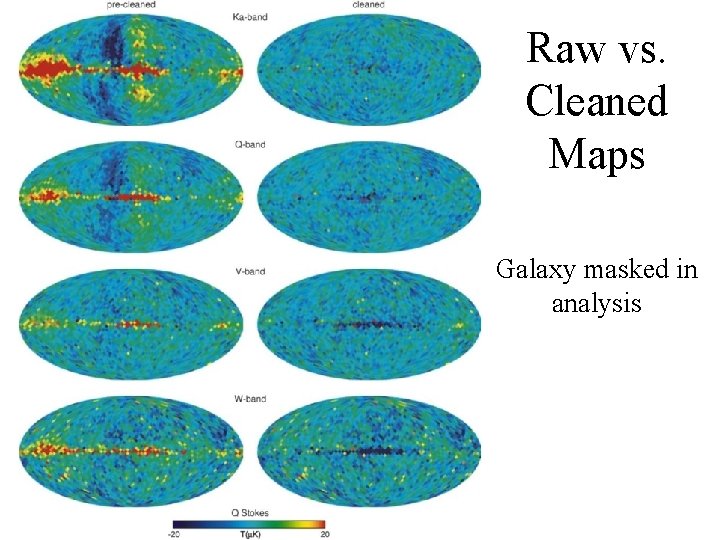
Foreground Model • Template fits (not model just shown). • Use all available information on polarization directions. • Sync: Based on K band directions • Dust: Based on directions from starlight polarization. • Increase errors in map for subtraction. • Examine power spectrum l by l and frequency. • Examine results with different bands. • Examine the results with different models. Table of Band Ka Q V W Pre-Cleaned 2. 14 1. 29 1. 05 1. 06 Cleaned 1. 096 1. 02 1. 05 4534 DOF
Raw vs. Cleaned Maps Galaxy masked in analysis
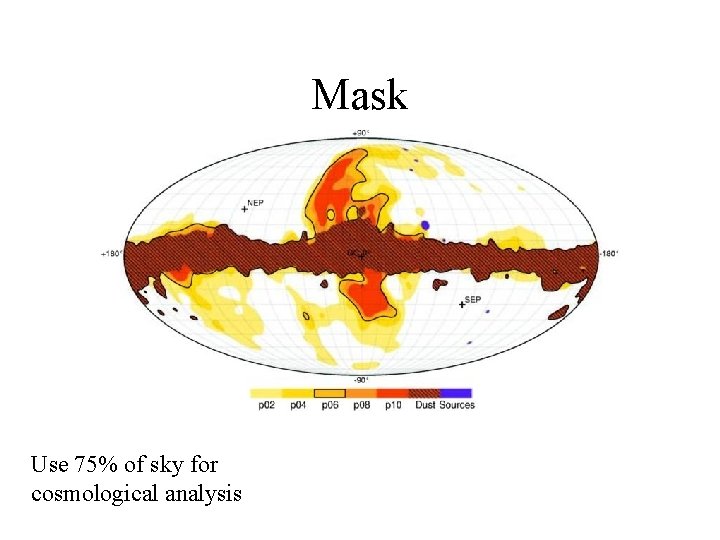
Mask Use 75% of sky for cosmological analysis
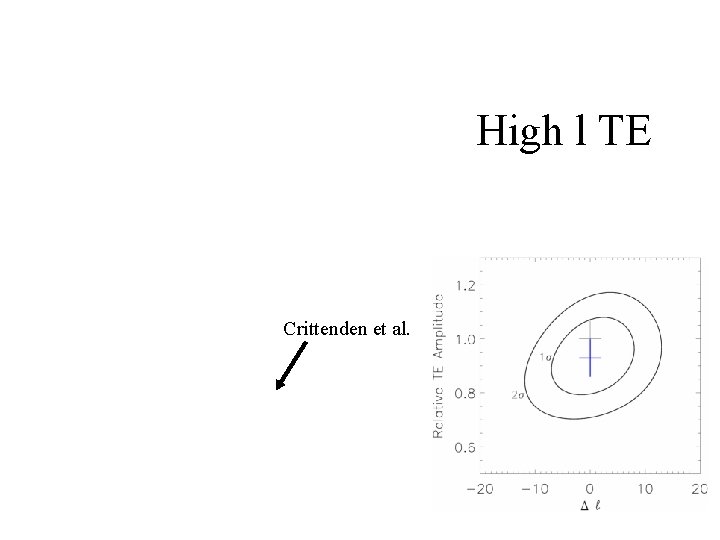
High l TE Crittenden et al.
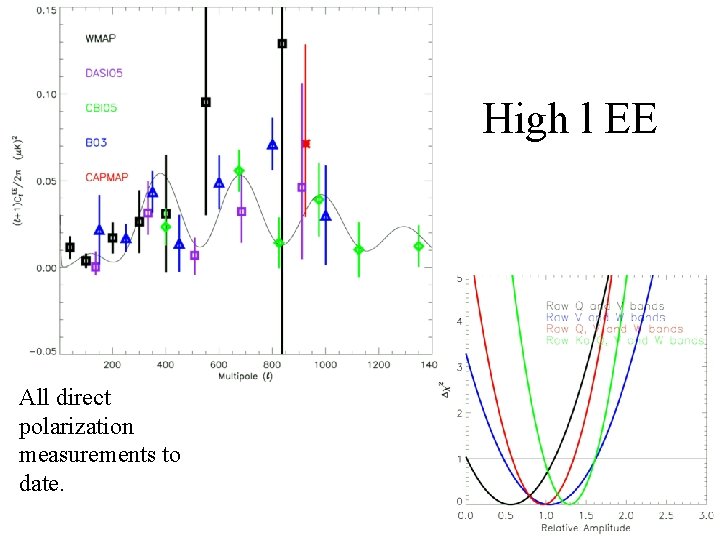
High l EE All direct polarization measurements to date.
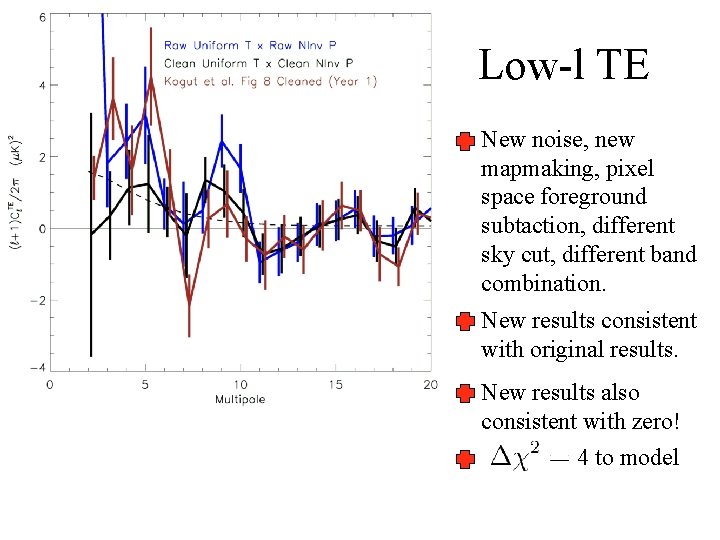
Low-l TE New noise, new mapmaking, pixel space foreground subtaction, different sky cut, different band combination. New results consistent with original results. New results also consistent with zero! 4 to model
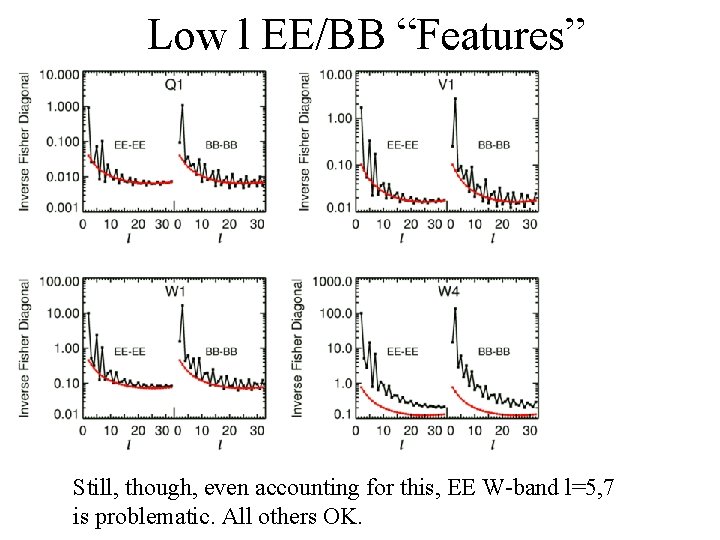
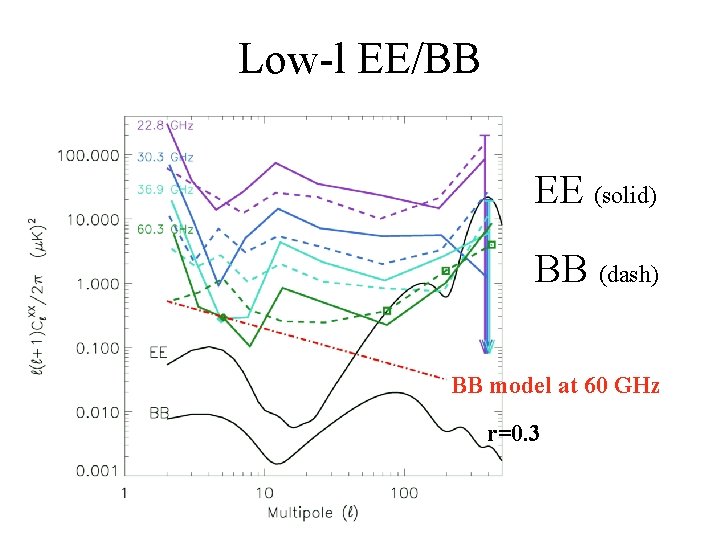
Low l EE/BB “Features” Still, though, even accounting for this, EE W-band l=5, 7 is problematic. All others OK.
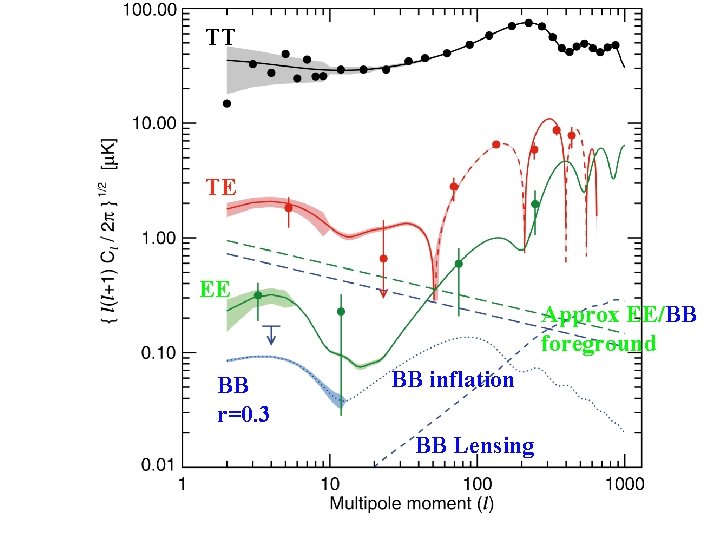
Low-l EE/BB EE (solid) BB (dash) BB model at 60 GHz r=0. 3
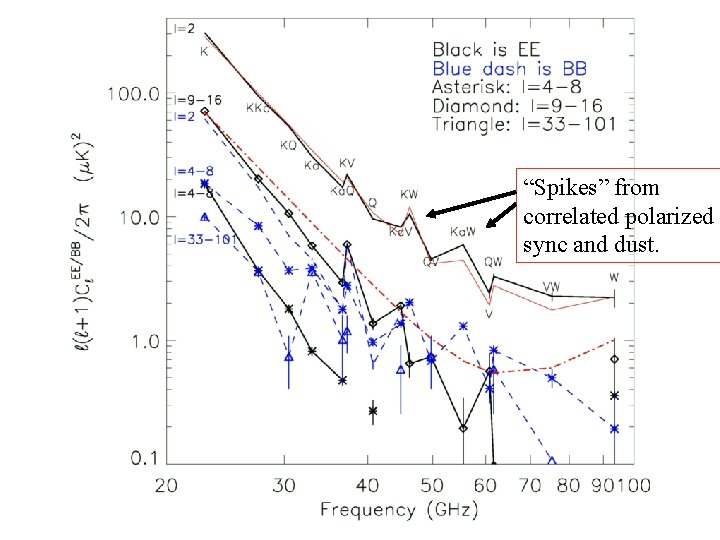
Frequency space “Spikes” from correlated polarized sync and dust.
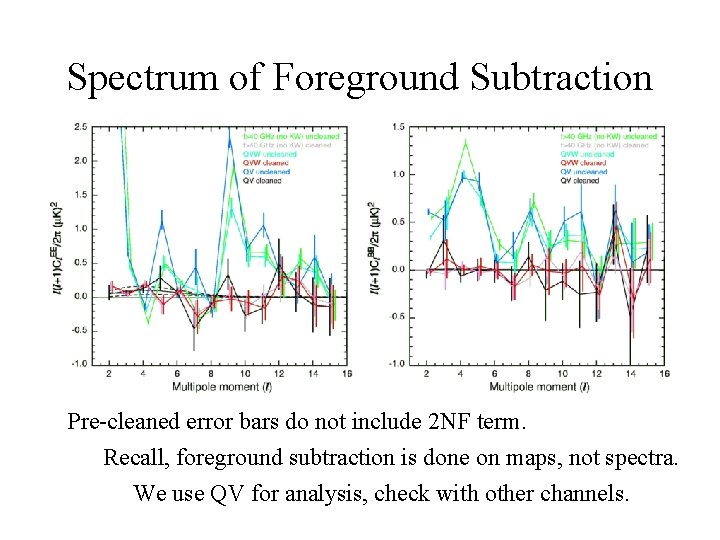
Spectrum of Foreground Subtraction Pre-cleaned error bars do not include 2 NF term. Recall, foreground subtraction is done on maps, not spectra. We use QV for analysis, check with other channels.
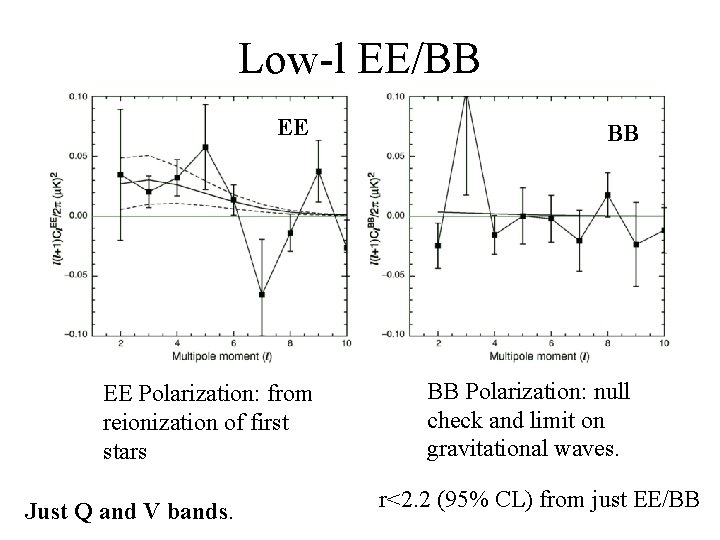
Low-l EE/BB EE EE Polarization: from reionization of first stars Just Q and V bands. BB BB Polarization: null check and limit on gravitational waves. r<2. 2 (95% CL) from just EE/BB
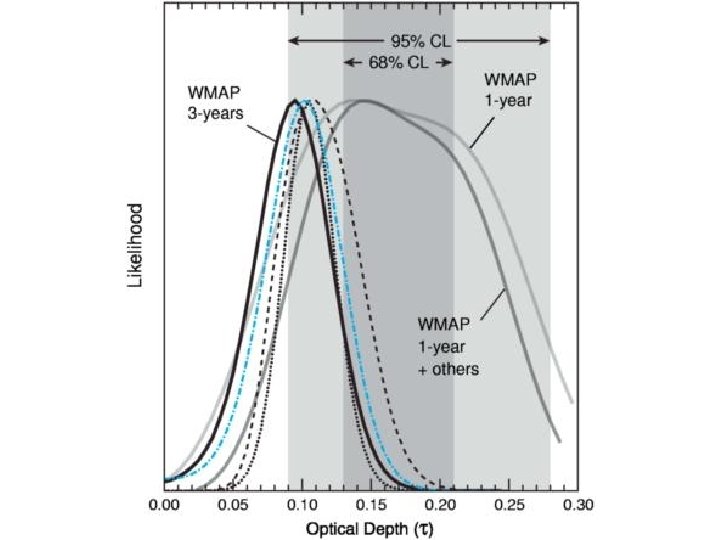
Optica. L Depth
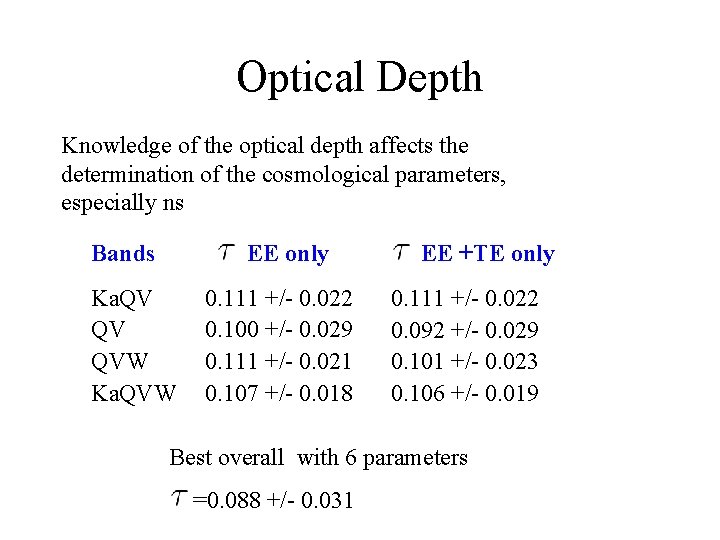
Optical Depth Knowledge of the optical depth affects the determination of the cosmological parameters, especially ns Bands EE only Ka. QV QV QVW Ka. QVW 0. 111 +/- 0. 022 0. 100 +/- 0. 029 0. 111 +/- 0. 021 0. 107 +/- 0. 018 EE +TE only 0. 111 +/- 0. 022 0. 092 +/- 0. 029 0. 101 +/- 0. 023 0. 106 +/- 0. 019 Best overall with 6 parameters =0. 088 +/- 0. 031
TT TE EE BB r=0. 3 Approx EE/BB foreground BB inflation BB Lensing
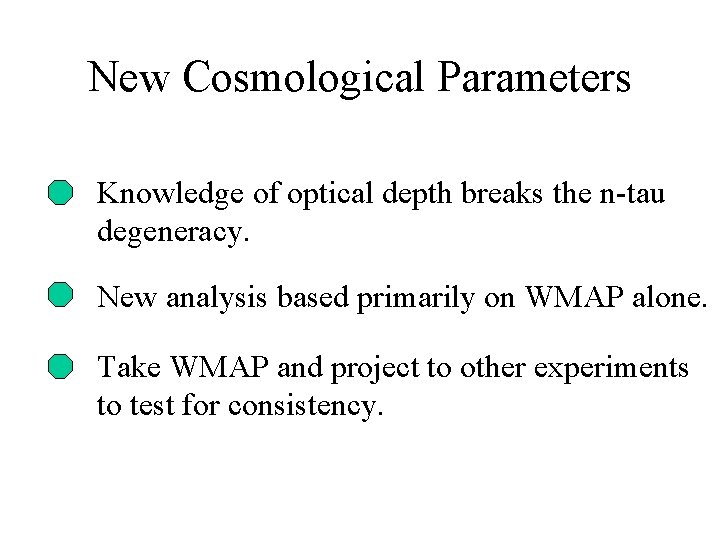
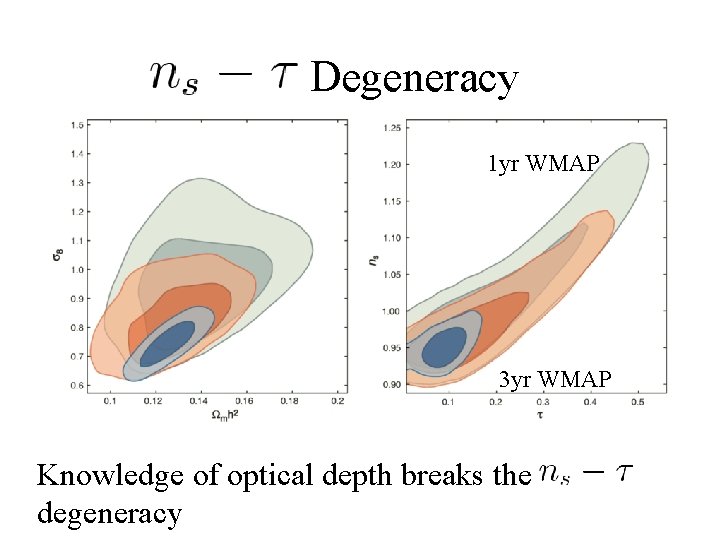
New Cosmological Parameters Knowledge of optical depth breaks the n-tau degeneracy. New analysis based primarily on WMAP alone. Take WMAP and project to other experiments to test for consistency.
Degeneracy 1 yr WMAP 3 yr WMAP Knowledge of optical depth breaks the degeneracy
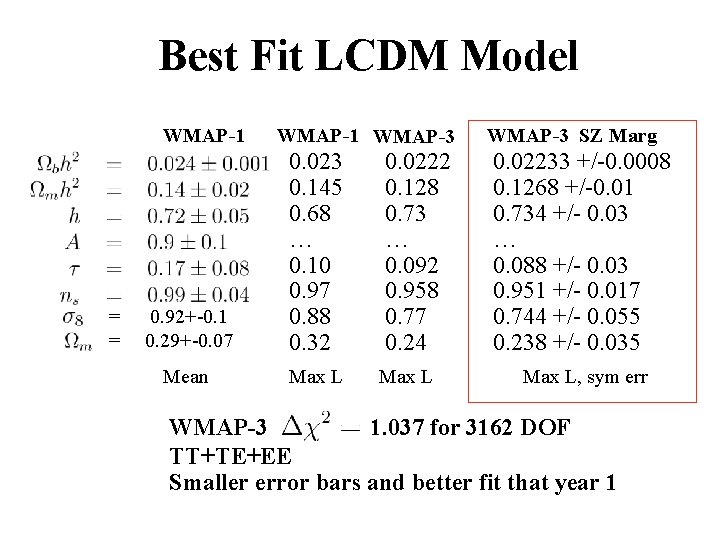
Best Fit LCDM Model WMAP-1 = = WMAP-1 WMAP-3 0. 92+-0. 1 0. 29+-0. 07 0. 023 0. 145 0. 68 … 0. 10 0. 97 0. 88 0. 32 0. 0222 0. 128 0. 73 … 0. 092 0. 958 0. 77 0. 24 Mean Max L WMAP-3 SZ Marg 0. 02233 +/-0. 0008 0. 1268 +/-0. 01 0. 734 +/- 0. 03 … 0. 088 +/- 0. 03 0. 951 +/- 0. 017 0. 744 +/- 0. 055 0. 238 +/- 0. 035 Max L, sym err WMAP-3 1. 037 for 3162 DOF TT+TE+EE Smaller error bars and better fit that year 1
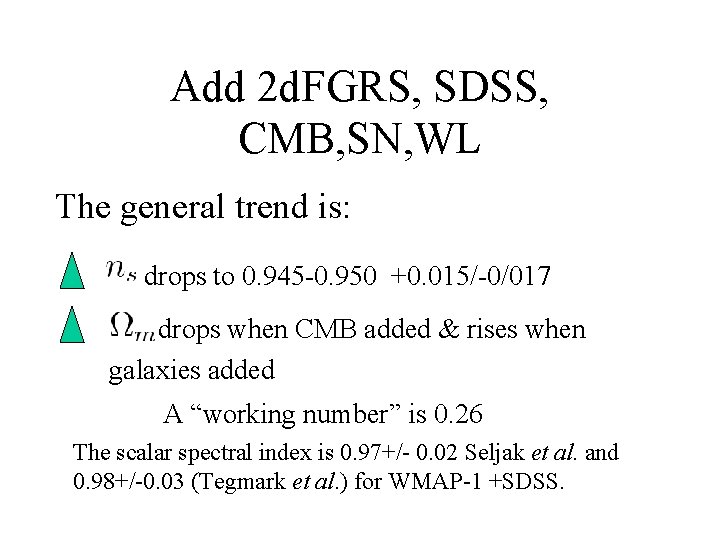
Add 2 d. FGRS, SDSS, CMB, SN, WL The general trend is: drops to 0. 945 -0. 950 +0. 015/-0/017 drops when CMB added & rises when galaxies added A “working number” is 0. 26 The scalar spectral index is 0. 97+/- 0. 02 Seljak et al. and 0. 98+/-0. 03 (Tegmark et al. ) for WMAP-1 +SDSS.
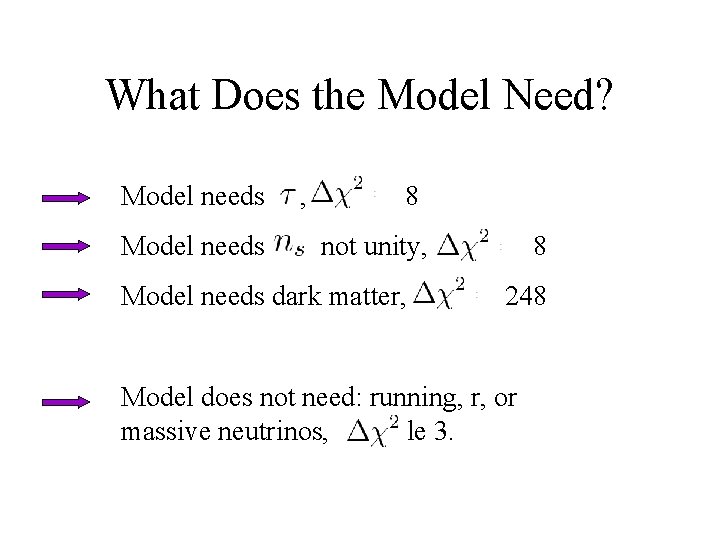
What Does the Model Need? Model needs , 8 not unity, Model needs dark matter, 8 248 Model does not need: running, r, or massive neutrinos, le 3.
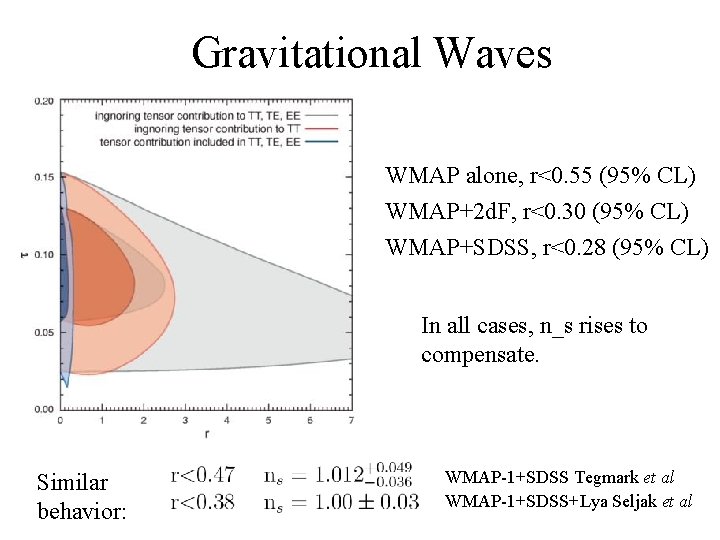
Gravitational Waves WMAP alone, r<0. 55 (95% CL) WMAP+2 d. F, r<0. 30 (95% CL) WMAP+SDSS, r<0. 28 (95% CL) In all cases, n_s rises to compensate. Similar behavior: WMAP-1+SDSS Tegmark et al WMAP-1+SDSS+Lya Seljak et al
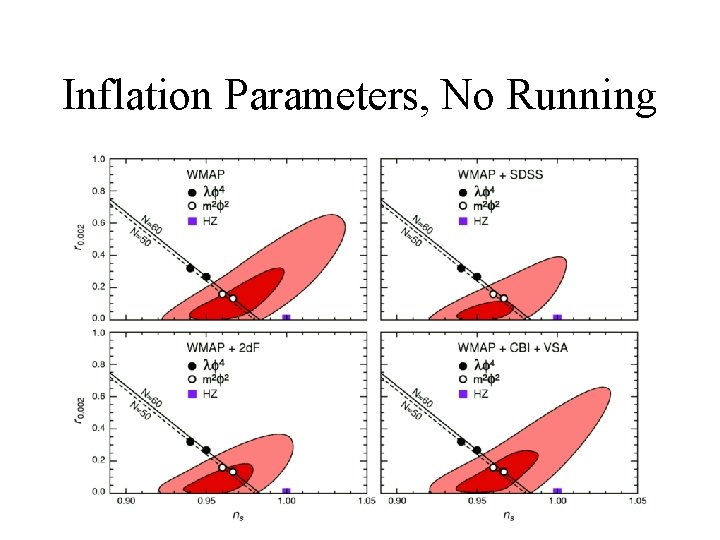
Inflation Parameters, No Running
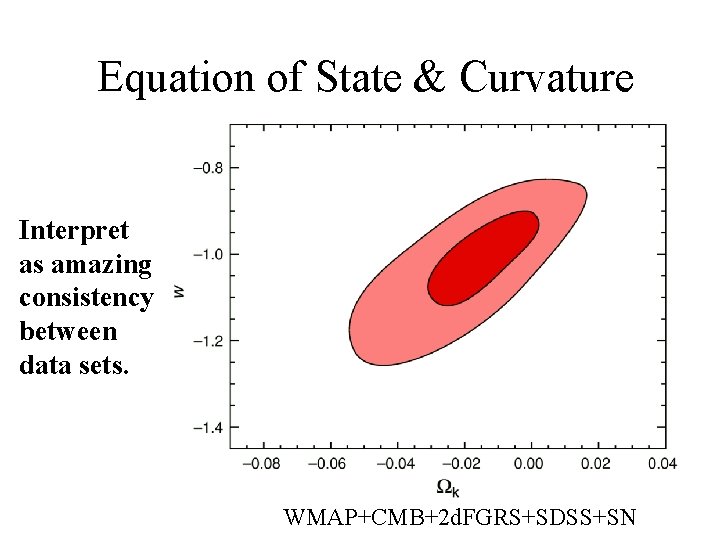
Equation of State & Curvature Interpret as amazing consistency between data sets. WMAP+CMB+2 d. FGRS+SDSS+SN
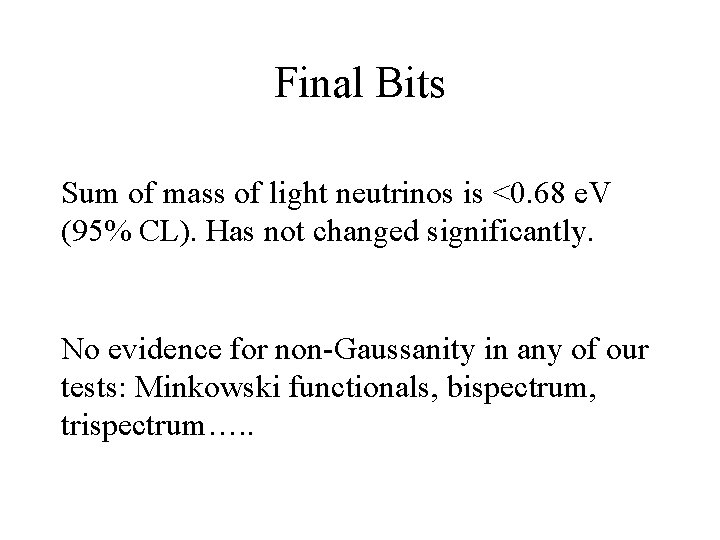
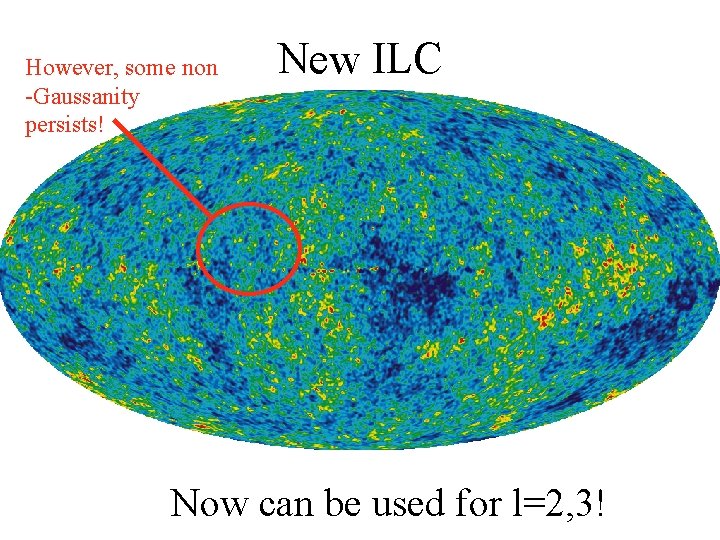
Final Bits Sum of mass of light neutrinos is <0. 68 e. V (95% CL). Has not changed significantly. No evidence for non-Gaussanity in any of our tests: Minkowski functionals, bispectrum, trispectrum…. .
However, some non -Gaussanity persists! New ILC Now can be used for l=2, 3!
THANK YOU