Testing Goodness of Fit Dr Wolfgang Rolke University


. \"On the Problem of the Most Efficient")


. \"Versuche über Pflanzenhybriden\", Verhandlungen des naturforschenden Vereines in")


 { O<-c(187, 168, 161, 147, 176, 161) E<-rep(1,")
 { crit 95<-c(10. 95,")


 Let X be a continuous random variable with distribution function")


- Slides: 55
Testing Goodness of Fit Dr. Wolfgang Rolke University of Puerto Rico - Mayaguez
Table of Content �
The Archetypical Statistics Problem: Ø There is a theory Ø There is data from an experiment Ø Does the data agree with theory?
Example: Is the die fair? � 1 2 3 4 5 6 187 168 161 147 176 161
Sir Karl Pearson 1900, “On the criterion that a given system of deviations from the probable in the case of correlated system of variables is such that it can be reasonably supposed to have arisen from random sampling”, Phil. Mag (5) 50, 157 -175
1 2 3 4 5 6 O 187 168 161 147 176 161 E 167 167 167 �
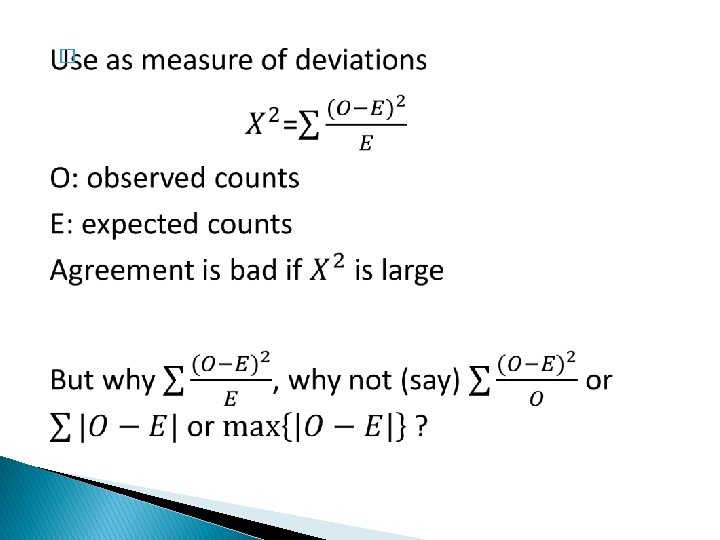
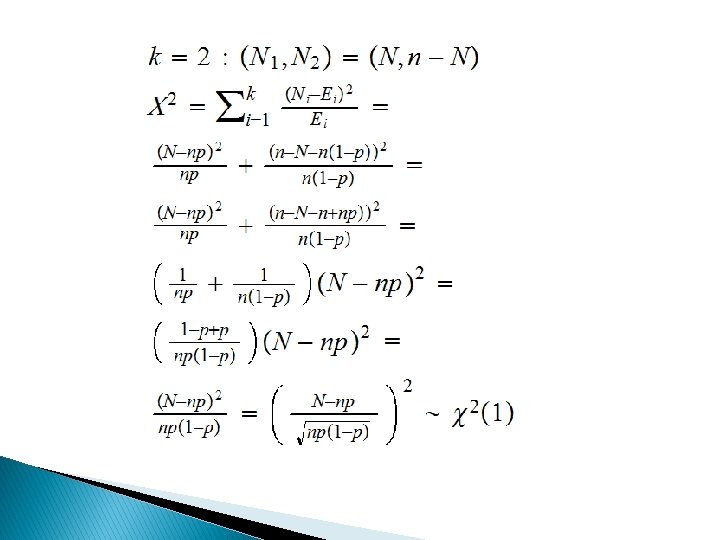
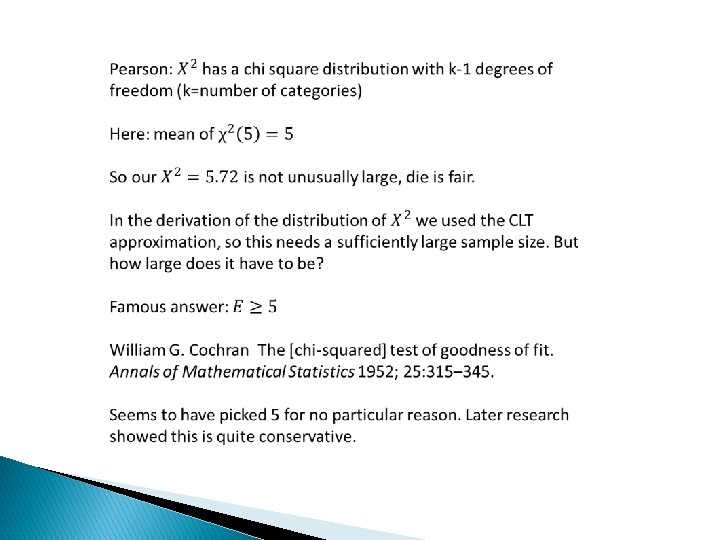
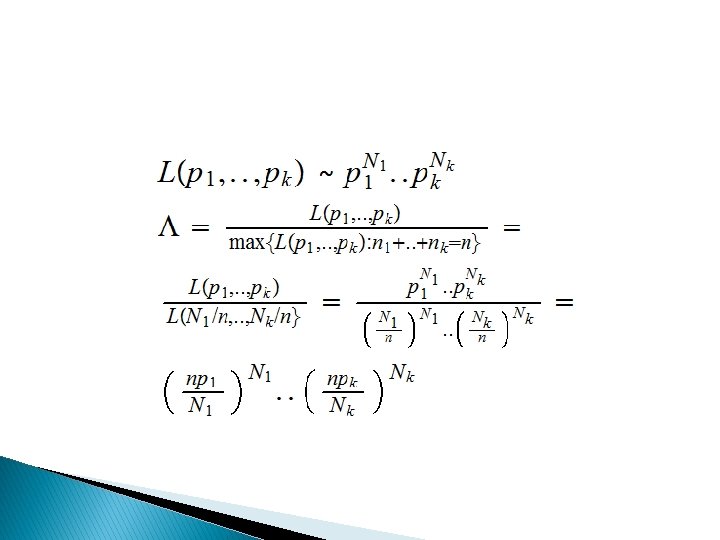
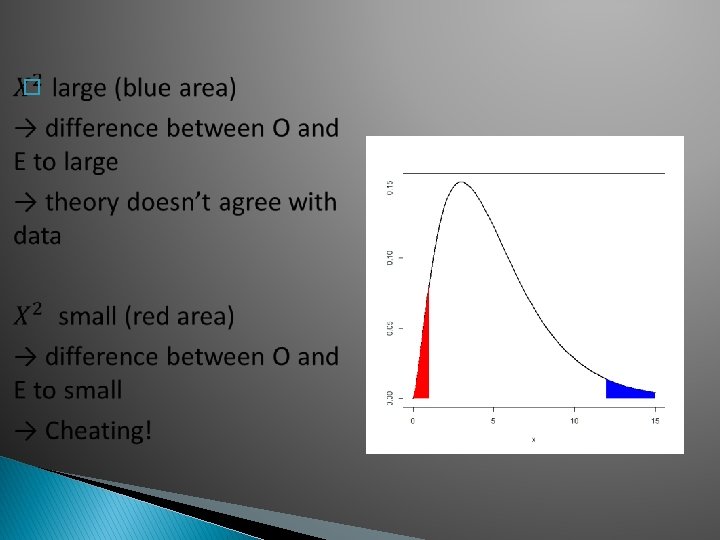
Pearson’s Reasoning
Hypothesis Testing Basics � Type I error: reject true null hypothesis � Type II error: fail to reject false null hypothesis 1: A HT has to have a true type I error probability no higher than the nominal one 2: The probability of committing the type II error should be as low as possible (subject to 1) Historically 1 was achieved either by finding an exact test or having a large enough sample.
Neyman, Jerzy; Pearson, Egon S. (1933). "On the Problem of the Most Efficient Tests of Statistical Hypotheses". Philosophical Transactions of the Royal Society A: Mathematical, Physical and Engineering Sciences. 231 (694– 706): In a test of a simple vs simple hypotheses likelihood ratio test is most powerful
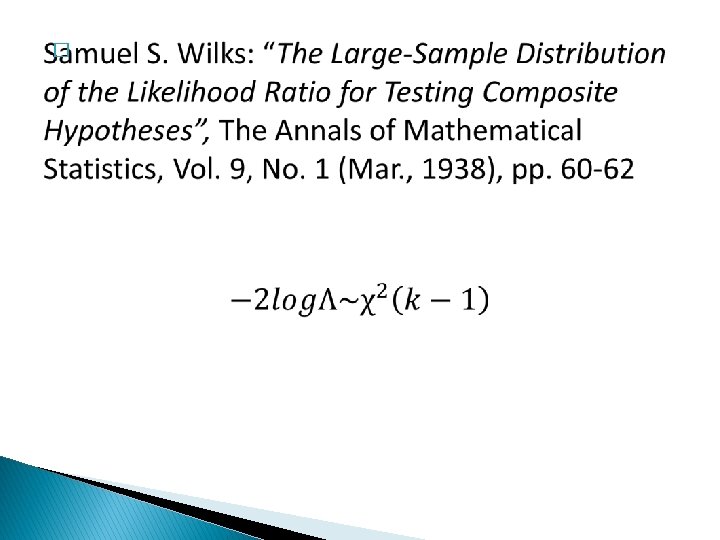
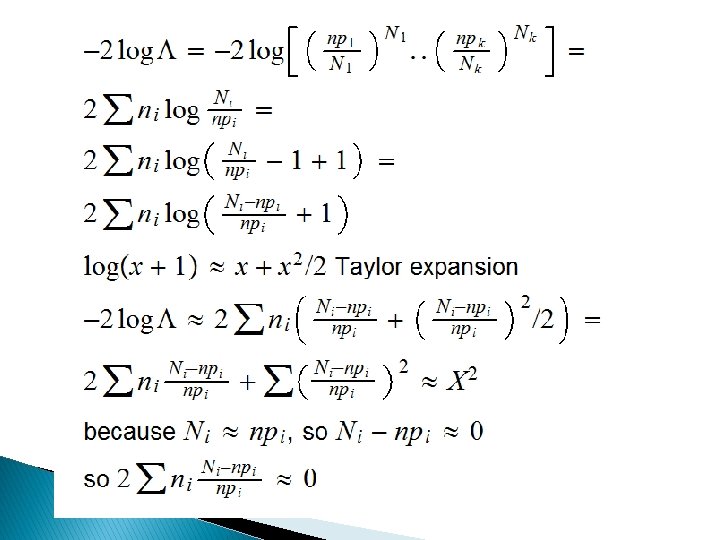
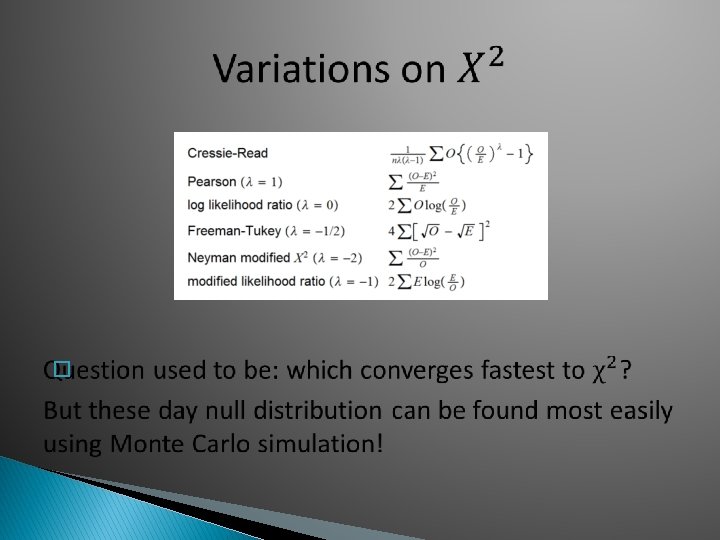
And that’s not all: �
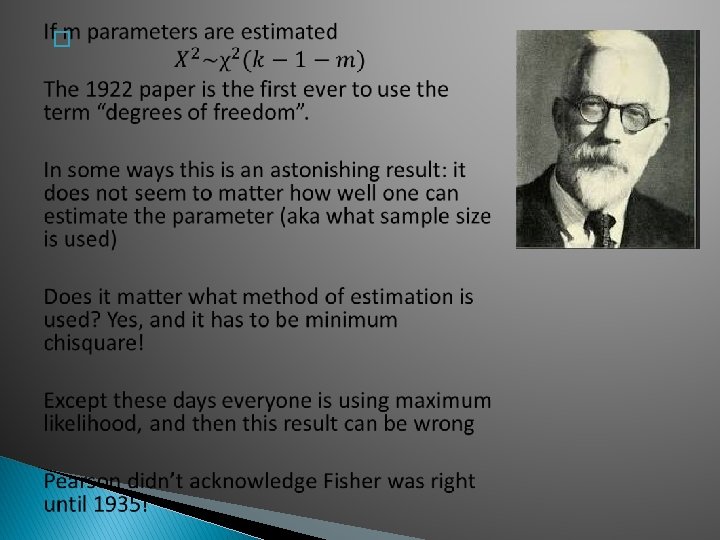
The Degree of Freedom Controversy �
Mendel-Fisher Controversy Mendel, J. G. (1866). "Versuche über Pflanzenhybriden", Verhandlungen des naturforschenden Vereines in Brünn, Bd. IV für das Jahr, 1865, Abhandlungen: 3– 47 Discovery of Mendelian inheritance Immediate impact on Science: ZERO! Darwin could have used this when he wrote On The Origin of Species. His cousin Francis Galton (inventor of regression!) could have told him.
More than 50 papers published since 1936 have tried to figure out what happened. For a long time: it was the Gardener! Another explanation, which seems to have gained momentum in recent years: It was early in the history of experimentation, modern ideas of how to avoid (even unconscious) biases were not yet developed. Allan Franklin, A. W. F. Edwards, Daniel J. Fairbanks, Daniel L. Hartl and Teddy Seidenfeld. “Ending the Mendel-Fisher Controversy”, University of Pittsburgh Press, 2008.
Monte Carlo Simulation function(B=1 e 4) { O<-c(187, 168, 161, 147, 176, 161) E<-rep(1, 6)/6*1000 TS. Data<-rep(0, 5) TS. Data[1]<-sum( (O-E)^2/E) TS. Data[2]<-2*sum(O*log(O/E)) TS. Data[3]<-4*sum( (sqrt(O)-sqrt(E))^2) TS. Data[4]<-sum( (O-E)^2/O) TS. Data[5]<-2*sum(E*log(E/O)) TS. Sim<-matrix(0, B, 5) for(i in 1: B) { O<-table(sample(1: 6, size=1000, replace=T)) TS. Sim[i, 1]<-sum( (O-E)^2/E) TS. Sim[i, 2]<-2*sum(O*log(O/E)) TS. Sim[i, 3]<-4*sum( (sqrt(O)-sqrt(E))^2) TS. Sim[i, 4]<-sum( (O-E)^2/O) TS. Sim[i, 5]<-2*sum(E*log(E/O)) } list(TS. Data, apply(TS. Sim, 2, quantile, 0. 95)) }
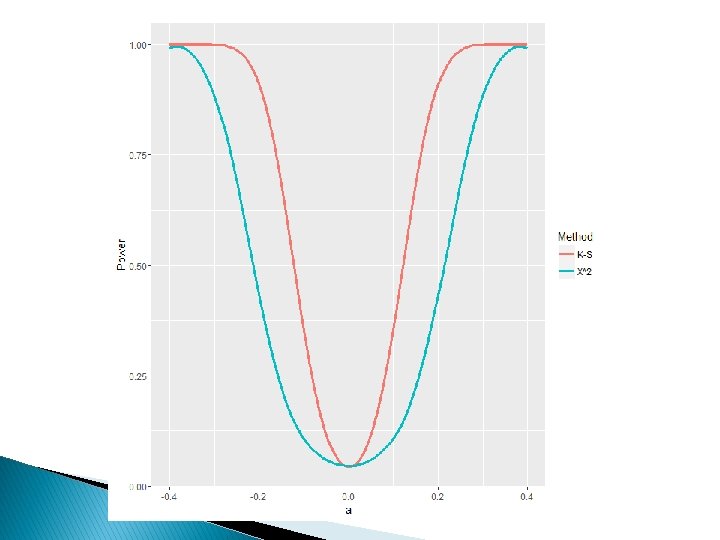
Question today: Which Method has highest Power? function(B=1 e 4) { crit 95<-c(10. 95, 10. 97, 10. 95, 11. 08, 11. 00) E<-rep(1, 6)/6*1000 TS. Sim<-matrix(0, B, 5) for(i in 1: B) { O<table(sample(1: 6, size=1000, replace=T, prob=c(1. 25, 1, 1, 1))) TS. Sim[i, 1]<-sum( (O-E)^2/E) TS. Sim[i, 2]<-2*sum(O*log(O/E)) TS. Sim[i, 3]<-4*sum( (sqrt(O)-sqrt(E))^2) TS. Sim[i, 4]<-sum( (O-E)^2/O) TS. Sim[i, 5]<-2*sum(E*log(E/O)) } power<-rep(0, 5) for(i in 1: 5) power[i]<s sum(TS. Sim[, i]>crit 95[i])/B power }
George Box: All models are wrong, but some are useful Probability models are theoretical constructs, one can not expect them to be perfect fits in real life (“there is no perfect circle in nature”) → how close an agreement between null and data is needed depends on context → related to choice of type I error probability ɑ, 5%? 1%?
Overfitting Usual question: is our theory a good enough model for the data? We also should worry about: is our model better than it should be? Ø Overfitting!
Continuous Data Need to bin the data In principle any binning is ok Two Questions: 1) 2) What kind of bins? How many bins?
What kind of bins? Equi-distant – Equi-probable
Most studies suggest equi-probable is better One advantage: E=1/k >> 5 for all bins, no need to adjust binning Major advantage: In general leads to tests with higher power Bins can be found easily as quantiles of F or as quantiles of data
How many bins? �
EDF Methods �
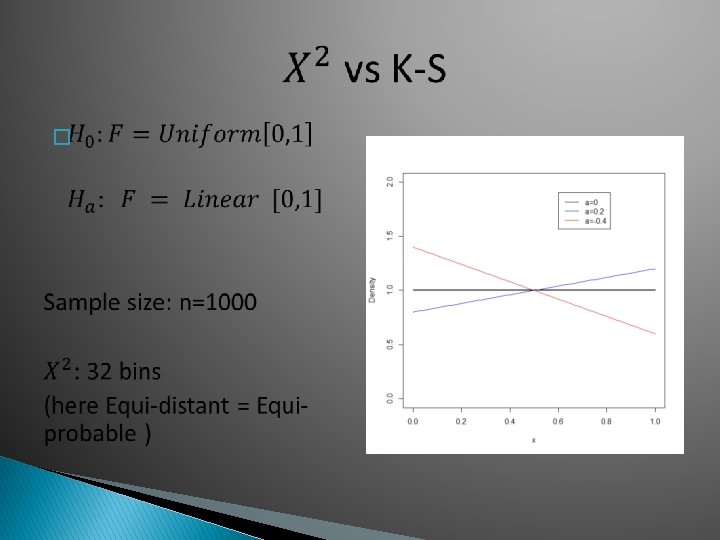
Theorem: (Probability Integral Transform) Let X be a continuous random variable with distribution function F, then the random variable Y = F(X) has a uniform (0, 1) distribution. Consequence: D is distribution free, aka does not depend on F. One table to rule them all! Except this does not work if parameters are estimated from data!
Kolmogorov-Smirnov �
Alternatives �
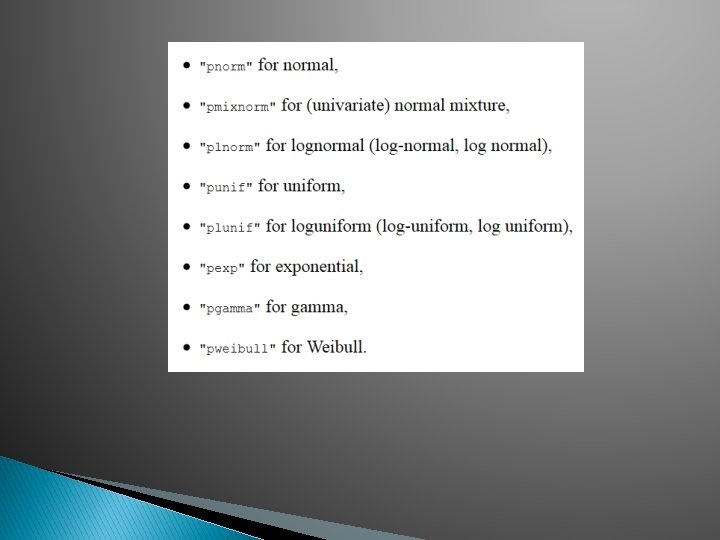
R package KScorrect Uses maximum likelihood to estimate parameters and Monte Carlo simulation to estimate null distribution Example: > x<-rexp(1000, 1) > Lc. KS(x, "pexp")$p. value [1] 0. 3998
Probability Plots Plot quantiles of F vs sample quantiles If F is correct model, points form a straight line
Turn this into a formal test �
Sivan Aldor-Noima, Lawrence D. Brown, Andreas Buja , Robert A. Stine and Wolfgang Rolke, “The Power to See: A New Graphical Test of Normality”, The American Statistician (2013), Vol 67/4 Andreas Buja, Wolfgang Rolke “Calibration for Simultaneity: (Re) Sampling Methods for Simultaneous Inference with Applications to Function Estimation and Functional Data”, Technical Report, Wharton School of Business, Univ. of Pennsylvania R routines: http: //academic. uprm. edu/wrol ke/research/publications. htm
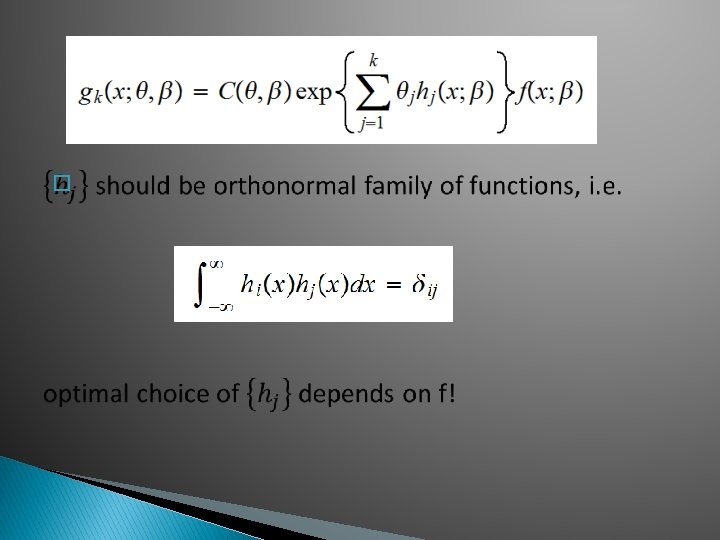
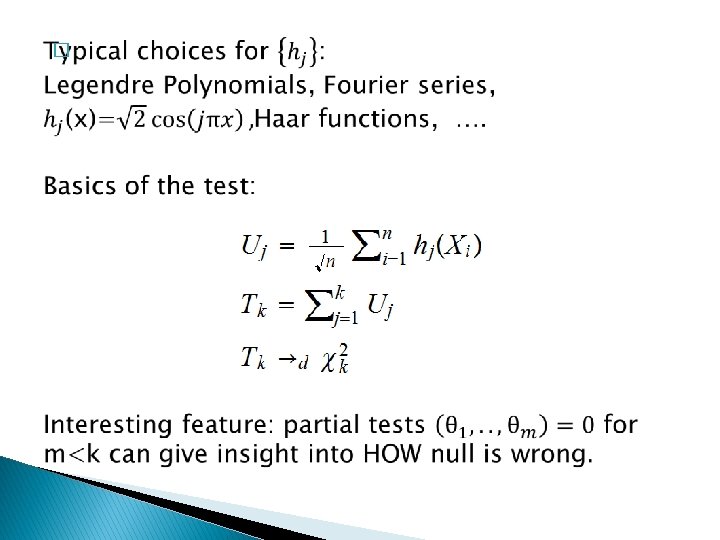
Smooth Tests �
testing composite hypotheses is possible Quite unusual: best method for estimating parameters: Mo. M (method of moments) Example:
And many more… � Tests based on moments � Tests specific for a distribution (Normal: more than 20 tests) �A good place to start: “Comparing Distributions”, Olivier Thais, Springer
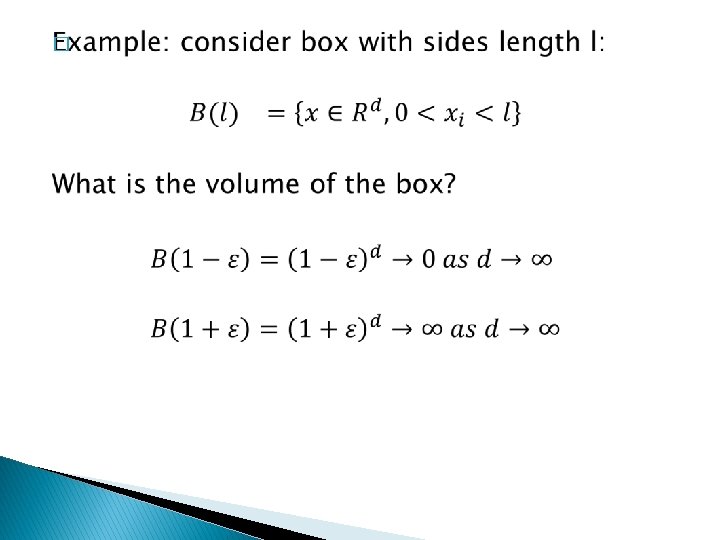
Multidimensional Data �
� d=1 99. 7% d=5 89. 1% d=10 46. 8% d=20 1. 7%
GOF tests beyond 2 or 3 dimensions unlikely to be very useful. At the very least will require gigantic data sets Still a wide open problem!
Thanks!