CHAPTER 11 Chi square goodness of fit Test


 • For all chi-square tests use the following: • df")


 2011(BBCOR Bats) Singles 672 (695. 26) 703 (679.")


- Slides: 64
CHAPTER 11 • Chi- square goodness of fit Test “GOF” • Chi-square Test for Homogeneity DONE SAME • Chi-square Test for Independence WAY • Symbol for Chi-Square is χ2
What’s the difference? • Goodness of Fit…. . how well does the observed data match the expected…. 2 rows or 2 columns • Homogeneity…. . More than one sample is taken with one categorical variable in mind • (2+ Samples, 1 category) • Independence/Association…. . Only one sample is taken and there are two or more categories. • (1 sample, 2+ categories)
Chi-Square Curve It is not a NORMAL CURVE!!! It is always skewed to the right some
Is your die fair—one more time. Roll your die 60 times. Write down the number for every roll.
Chi-Square GOF Test • If your die is fair you would expect to get 10 of each number in 60 rolls. • In this test we compare the EXPECTED results vs the OBSERVED results.
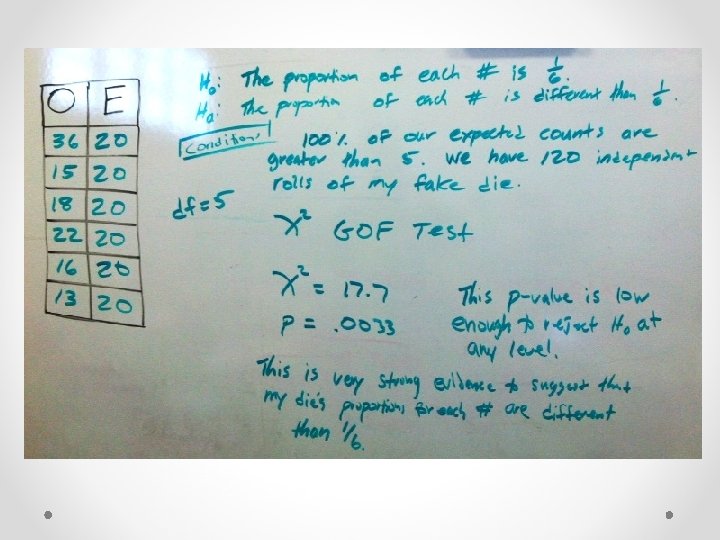
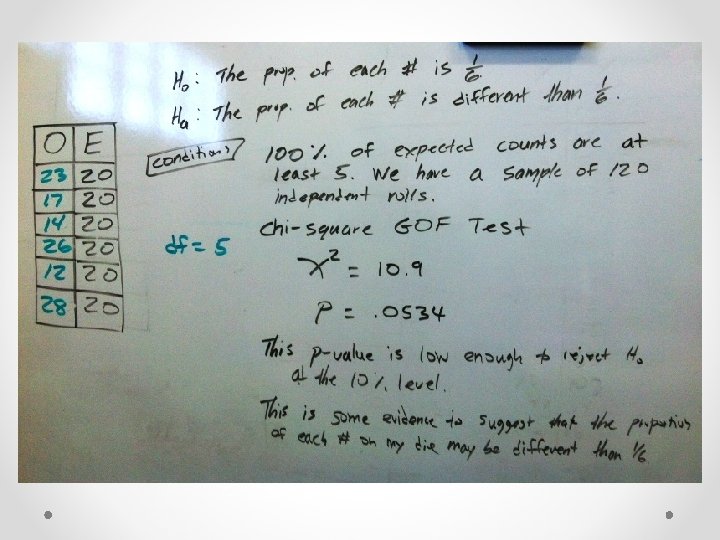
Hypotheses • Ho: The proportion of each number that occurs on my die is 1/6 • Ha: The proportion of each number that occurs on my die is different than 1/6 • There are no symbols for the chi-square. However, it is always one-sided, even though the word “different” is used.
Normal condition for 2 χ • 80% of the expected cells are greater than or equal to 5. (not observed cells—expected cells!)
Formula
Degrees of Freedom (df) • For all chi-square tests use the following: • df = (r – 1)(c – 1) • r is the row and c is the column
Ho: The distribution of my die results are as EXPECTED Ha: The distribution of my die results are different than EXPECTED O E Assumptions: We have an independent random sample of 60 rolls of my fake die. 100% of our expected cells are 5 or more. Chi-square GOF test X 2 = P-value = df = This p-value is ______to reject Ho at _______ level There is_______evidence to suggest that my die results are ______ than expected.
Ho: Each groups fastest time occurred on each lane as expected Ha: Each groups fastest time occurred on each lane differently than EXPECTED O Yellow 4 White 11 Green 5 Grey 1 E Assumptions: We have an independent random sample of 21 groups fastest time and the lane it occurred on. We can assume that there at least 210 cars of this type in the population. 100% of our expected counts are 5 or more. Chi-square GOF test X 2 = P-value = df = This p-value is ______to reject Ho at _______ level There is_______evidence to suggest that the lanes are different than expected.
Calculator steps TI-83+ Calculator Put your observed counts in L 1 and Expected in L 2 Tyoe the observed in L 1 and expected in L 2. Then click on the L 3 heading and type the formula(then click enter), then quit out to the main screen Then hit 2 nd and Stat Find the sum of L 3, your answer is the chi-square statistic
Calculator steps After your get the sum you need to obtain the p-value X 2 , UB , df This will give you the p-value
Calculator steps TI-84 calculator does most of the work for you Make sure you have typed your observed counts in L 1 and expected counts in L 2 5
Demographics. • Rancho is approximately 54. 4% Hispanic, 29. 7% Asian, 11. 4% white and 4. 5% other. (data as of 2013 -2014 school year) • Does Mr. Pines‘AP stats classes reflect this diversity? Run the appropriate test, verify your requirements, and write a conclusion.
2016 Demographics. Ho: The diversity in Mr. Pines classes is the same as Rancho’s diversity Ha: The diversity in Mr. Pines classes is different than Rancho’s diversity O Hispanic 48 Asian 45 White 4 Other 2 X 2 = P-value =. df = E Assumptions: We have an independent random sample of ___ students ethnicity. We can assume that there have been at least _____ students in Mr. Pines classes. 100% of our expected cells are 5 or more. Chi-square GOF test This p-value is_____to reject Ho at the _____ level This is _______evidence to suggest that Mr. Pines class diversity may be different than Rancho’s diversity.
2015 Demographics. Ho: The diversity in Mr. Pines classes is the same as Rancho’s diversity Ha: The diversity in Mr. Pines classes is different than Rancho’s diversity Assumptions: We have an independent random sample of 159 students ethnicity. We can assume that there have been at least 1590 students in Mr. Pines classes. 100% of our expected cells are 5 or more. Chi-square GOF test X 2 = 12. 38 P-value =. 0062 df = 3 This p-value is low enough to reject Ho at the 1% level This is strong evidence to suggest that Mr. Pines class diversity may be different than Rancho’s diversity.
Is there a difference…… • Do boys and girls prefer types of social media? • Please choose your favorite of the three below.
One Hundred Twenty Nine students were surveyed…………. We took a sample of 72 girls and a sample of 57 boys. Girls Boys c/o 2016 Instagram 19 15 Snapchat 38 23 Twitter 15 19
One Hundred Fifty Seven students were surveyed…………. We took a sample of 83 girls and a sample of 74 boys. Girls Boys c/o 2015 Instagram 36 19 Snapchat 25 36 Twitter 22 19
What’s the difference? • Goodness of Fit…. . how well does the observed data match the expected…. 2 rows or 2 columns • Homogeneity…. . More than one sample is taken with one categorical variable in mind • (2+ Samples, 1 category) • Independence/Association…. . Only one sample is taken and there are two or more categories. • (1 sample, 2+ categories)
Hypotheses for Chi-Square Test for Homogeneity Ho: There is no difference between gender and social media preference Ha: There is a difference between gender and social media preference OR Ho: The proportions of boys and girls who prefer each type of social media are the same Ha: The proportions of boys and girls who prefer each type of social media are different
Ho: There is no difference between gender and social media preference Ha: There is a difference between gender and social media preference Assumptions: We have two independent random samples of students social media preferences(72 girls and 57 boys). There are obviously more than 720 girls and 570 boys in the population sampled from who use social media. 100% of our expected cells are 5 or more. Chi-square test of homogeneity Instagram Snapchat Twitter Girls 19 38 15 Boys 15 23 19 This p-value is _______to reject Ho at _______ level X 2 = P-value =. df = There is______evidence to suggest that there may be a difference between gender and social media preference.
Period 1
Period 3
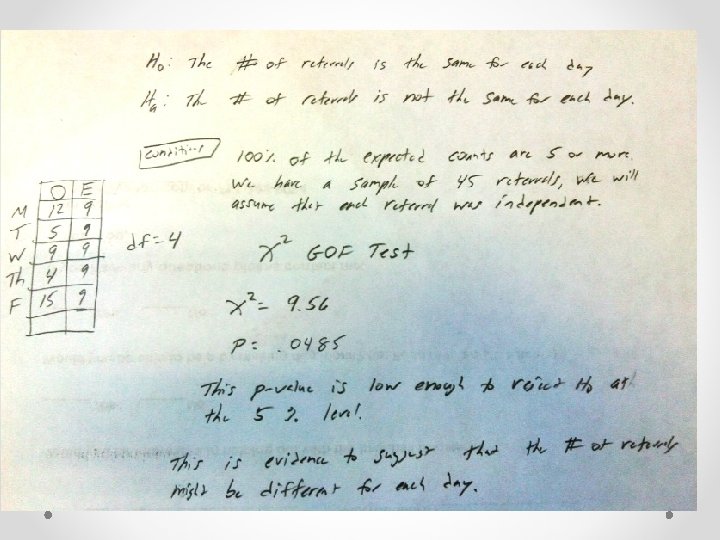
Referrals vs Days of week Monday Tuesday Wednesday Thursday Friday 12 5 9 4 15 The table shows the number of students referred for disciplinary reasons to the principals office, broken down by day of the week. Are referrals related to the day of the week?
BIRTHDAYS. • Are Mr. Pines students birth months distributed in proportion to the number of days in each month? • We can run a chi-square GOF based on the # of days in each month n = 153
C/O 2015 per 1 only H 0: Mr. Pines students birthday months are in proportion to the number of days in each month. H a: Mr. Pines students birthday months are different than the proportion of the number of days in each month. We have an independent sample of 53 students birth months. All births is obviously more than 10 x our sample. 100% of our expected counts are 5 or more. Chi-square GOF Test X 2 = 9. 81 P-value =. 5475 This p-value is too high to reject Ho df = 11 Based on this sample, there is NOT enough evidence to suggest that Mr. Pines students birthday months are different than the proportion of the number of days in each month.
BIRTHDAYS O E 9 7 12 11 14 16 20 12 11 12 12 17 n = 153 To figure out the expected we need to think about the number of days in each month. Jan 31 July 31 Feb 28 Aug 31 Mar 31 Sep 30 Apr 30 Oct 31 May 31 Nov 30 June 30 Dec 31 Total = 365 days
C/O 2016 H 0: Births are distributed according to the # of days in each month Ha: Births are not distributed according to the # of days in each month Assumptions: Jan 9 Feb 8 Mar 6 Apr 7 We have an independent sample of ____ students birth months. All births is obviously more than 10 x our sample. 100% of our expected counts are 5 or more. X 2 = P-value =. df = O E Chi-square GOF test May 15 Jun 8 Jul 11 Aug 10 Sep 6 This p-value is ____ to reject Ho at _______level. There is ______evidence to suggest that births are not uniformly distributed by the # of days in each month. Oct 7 Nov 6 Dec 10
C/O 2014 H 0: Births are uniformly distributed by the # of days in each month Ha: Births are not uniformly distributed by the # of days in each month CONDITIONS df = 11 We have an independent sample of 129 students birth months. All births is obviously more than 10 x our sample. 100% of our expected counts are 5 or more. X 2 = 7. 75 P =. 7355 O E 12 10. 956 5 9. 896 12 10. 956 12 10. 603 13 10. 956 7 10. 603 9 10. 956 14 10. 956 11 10. 603 This p-value is too high to reject Ho. 11 10. 956 There is not enough evidence to suggest that births are not uniformly distributed by the # of days in each month. 15 10. 956 8 10. 603
Chi-Square Test for Homogeneity • Data is given in a 2 -way table • Expected counts are found by using a matrix on your calculator or by multiplying the (ROW TOTAL)(COLUMN TOTAL)/GRAND TOTAL • Conditions and df are the same as GOF test
Is there a difference…… • Do boys and girls prefer different video game consoles? • Please choose your favorite console out of the 3?
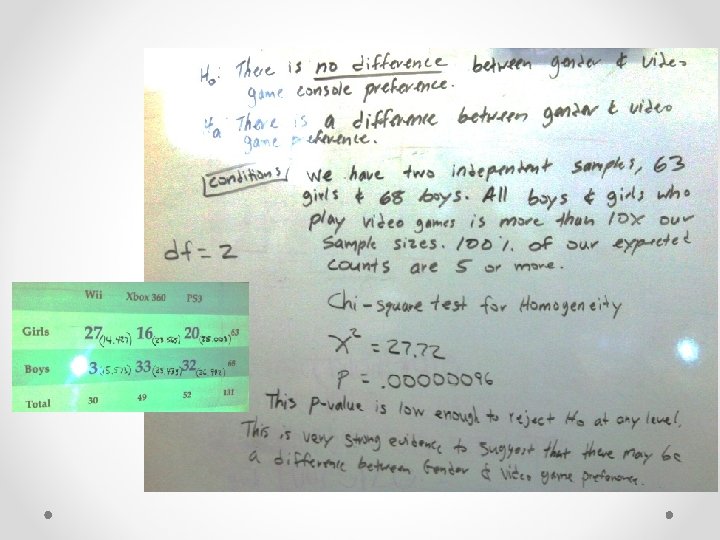
Hypotheses for Chi-Square Test for Homogeneity Remember Ha is always means different! Ho: There is no difference between gender and video game console preference Ha: There is a difference between gender and video game preference OR Ho: The proportions of boys and girls who prefer each type of console are the same Ha: The proportions of boys and girls who prefer each type of console are different
Why is this a Homogeneity Test? • Two samples were taken separately • Boys console preference • Girls console preference • There is ONE category of interest.
Two-Way Table 2013 VIDEO GAME CONSOLE PREFERENCE GEN DER Wii Xbox 360 PS 3 Girls 27 16 20 63 Boys 3 33 32 68 Total 30 49 52 131
Two-Way Table 2014 VIDEO GAME CONSOLE PREFERENCE GEN DER Wii Xbox Playstation Girls 19 10 32 61 Boys 6 21 34 61 Total 25 31 66 122
Quit to home screen, go to test menu Hit 2 nd Matrix, go to EDIT Should be already setup if you used A and B Set the appropriate matrix size Enter observed counts in matrix
You need the expected counts…. so go back to 2 nd matrix. Use NAMES and go down to Matrix B, calculator generates them after you run the test You will most likely have to scroll to the right to see all of the expected counts REMEMBER!. . EXPECTED COUNTS MUST BE ON YOUR PAPER!
What’s the difference? • Goodness of Fit…. . how well does the observed data match the expected…. 2 rows or 2 columns • Homogeneity…. . More than one sample is taken with one categorical variable in mind • (2+ Samples, 1 category) • Independence/Association…. . Only one sample is taken and there are two or more categories. • (1 sample, 2+ categories)
College Students’ Drinking In 1987, a random sample of undergraduate students at Rutgers University was sent a questionnaire that asked about their alcohol drinking habits. Here are the results displayed in a two-way table. Live on Campus Live Off Campus(Not with Parents) Live Off Campus with Parents Total 46 71 17 38 43 42 106 Light. Moderate 55 34 26 115 Moderate Heavy 63 24 15 102 Heavy 67 28 17 112 Total 302 141 143 586 Abstain Light Drinker 151
Chi-Square Test for Independence There was one sample taken and then data was broken down into different categories. When only one sample is taken we are doing a Chi-Square Test for Independence/Association
Hypotheses This is a chi-square test for Independence/Association, you have a few options for writing the hypotheses Ho: There is no association between students’ residence type and drinking habits. Ha There is an association between students’ residence type and drinking habits. OR Ho: Student drinking habits and residence type are independent Ha Student drinking habits and residence type are not independent
Full Moon Some people believe that a full moon elicits unusual behavior in people. The table shows the number of arrests made in a small town during the weeks of six full moons and six other randomly selected weeks in the same year. Is there evidence of a difference in the types of illegal activity that takes place. This is a chi-square test for Homogeneity Full Moon Not Full Violent (murder, assault, rape, etc. ) 2 3 Property(burglary, vandalism, etc. ) 17 21 Drugs/Alcohol 27 19 Domestic Abuse 11 14 Other offenses 9 6
Thanks To: Grace Montgomery
THANKS TO: Amy Nguyen
Testing M&M’s • The Mars company has always claimed that the color distribution of their M&M’s follow a certain proportion as follows: Brown Red Yellow Green Orange Blue 13% 14% 16% 20% 24% Check the M&M’s that were given to you. How many of each color do you have? We will run a Chi-Square GOF test to see if their claim is accurate. Do not eat your M&M’s until we have all observed and expected counts completed!
Hypotheses • Ho: My bag of M&M’s follow the same color distribution as the Mars company claim. • Ha: My bag of M&M’s follows a different color distribution as the Mars company claim.
Assumptions/Conditi ons • ___% of expected counts >5 • My bag of M&M’s can be considered an independent random sample of M&M’s
M&M Combined Results Colors Brown Red Yellow Green Orange Blue Claim % 13% 14% 16% 20% 24% Expected 728. 78 784. 84 896. 96 1121. 2 1345. 44 Observed 606 586 803 1101 1335 1175 There were a total of 5606 M&M’s sampled. We have a chi-square statistic of 157. 85 which gives a P-value of 0.
Mr. Pines Poker Chips • 44 white chips = 20 pts • 5 blue chips = 30 pts • 1 red chip = 50 pts
Mr. Pines Poker Chips • 44 white chips = 20 pts • 5 blue chips = 30 pts • 1 red chip = 50 pts There have been 135 attempts at randomly choosing poker chips out of the bag. A White chip has been pulled 301 times, a Blue chip 47 times, and the Red chip 16 times. Has this followed the expected probabilities? Run a chi-square GOF Test.
Baseball Bats • There have been some major bat changes for the 2011 season. Aluminum baseball bats have been regulated so that they meet certain safety standards. After 5 games this season, coach Pines has noticed significant reductions in power numbers such as 2 B’s, 3 B’s, and HR’s…. . Of course he would like to test his hypothesis.
Baseball Bats • Run a Chi-Squared two-way table test to see if there is an association between the power numbers and types of bats. • Also run a 2 -Prop. Z Test between the types of bats used. • If these are done correctly, Z 2 = X 2
Hypotheses • Ho: There is no association between type of bats and extra base hits • Ha: There is an association between type of bats and extra base hits
Assumptions/Conditi ons • E---All expected counts > 5 • S----We have a random sample of 23 schools hitting stats for the first 5 games of the 2010 and 2011 baseball seasons • I----We can assume that all stats are independent of other teams stats
Observed and Expected Counts 2010(BESR Bats) 2011(BBCOR Bats) Singles 672 (695. 26) 703 (679. 74) Extra Base Hits 313 (289. 74) 260 (283. 26)
• X 2 = 5. 35 • P-value =. 0207 • This p-value is low enough to reject at the 5% level. • There is evidence to suggest that there may be an association between the types of bats and extra base hits
Tootsie Pop Wrappers We are interested in whether or not the designs on the wrappings on Tootsie Roll Pops are independent of the flavor of the pop.
Hypotheses This is a chi-square test for Independence/Association, you have a few options for writing the hypotheses Ho: There is no association between pop flavor and designs on the wrapper. Ha There is an association between pop flavor and designs on the wrapper. OR Ho: Pop flavor and wrapper designs are independent. Ha Pop flavor and wrapper designs are not independent.