TECHNICAL ANALYSIS POOJA GUPTA What is Technical Analysis


- Slides: 65
TECHNICAL ANALYSIS POOJA GUPTA
What is Technical Analysis? n n A method of evaluating securities by analyzing statistics generated by market activity, such as past prices and volume It uses charts and other tools to identify patterns that can suggest future activity
Technical Analysis- Basic Assumptions n n n The markets discount everything Prices moves in trends History repeats itself
Determinants of Success at Technical Analysis If you decide to use a charting pattern or technical indicator, you need to be aware of the investor behavior that gives rise to its success. You can modify or abandon the indicator if the underlying behavior changes. It is important that you back-test your indicator to ensure that it delivers the returns that are promised. In running these tests, you should pay particular attention to the volatility in performance over time and how sensitive the returns are to holding periods. The excess returns on many of the strategies that we described in this chapter seem to depend upon timely trading. In other words, to succeed at some of these strategies, you may need to monitor prices continuously, looking for the patterns that would trigger trading. Building on theme of time horizons, success at charting can be very sensitive to how long you hold an investment. The strategies that come from technical indicators are generally shortterm strategies that require frequent and timely trading. Not surprisingly, these strategies also generate large trading costs that can very quickly eat into any excess returns you may have.
Technical Analysis : Fundamental Vs. Technical n n n Charts vs. Financial Statements Time Horizon Trading vs. Investing
Strengths of Technical Analysis n n Focus on Price Pictorial Price History Assist with entry point Support and Resistance level
Weakness of Technical Analysis n n n Analyst Bias Open to Interpretation Too Late Always another level Traders Remorse
The Basis for Price Patterns 1. Investors are not always rational in the way they set expectations. These irrationalities may lead to expectations being set too low for some assets at some times and too high for other assets at other times. Thus, the next piece of information is more likely to contain good news for the first asset and bad news for the second. 2. Price changes themselves may provide information to markets. Thus, the fact that a stock has gone up strongly the last four days may be viewed as good news by investors, making it more likely that the price will go up today then down.
The Empirical Evidence on Price Patterns � � � Investors have used price charts and price patterns as tools for predicting future price movements for as long as there have been financial markets. The first studies of market efficiency focused on the relationship between price changes over time, to see if in fact such predictions were feasible. Evidence can be classified into three classes n Studies that looks at the really short term (hourly, daily) price behavior n studies that focus on short-term (weekly, monthly price movements) price behavior and research that examines long-term (annual and five-year returns) price movements.
What are charts ? n A price chart is a sequence of prices plotted over a specific time frame
Bar Chart
Volume Indicators Some technical analysts believe that there is information about future price changes in trading volume shifts.
Point and Figure Charts
Candlestick Chart
Candlestick Chart • The signals are created by the change in investor sentiment
Common Candlestick Terminology White Candlestick Hammer Doji Line Spinning top Black Candlestick
Support and Resistance 1. 2. Support is the price level at which demand is thought to be strong enough to prevent the price from declining further Resistance is the price level at which selling is thought to be strong enough to prevent the price from rising further
Support and Resistance Chart
Trend Line n Trend line is a straight line that connects two or more price points and then extends into the future to act as a line of support or resistance
Types of Trends n n n Rising Trend or up trend – When prices make higher highs and higher lows it is a case of rising trends Falling Trend or down trend – When prices make lower highs and lower lows it is a case of falling trend Correction – A smaller price move which is opposite to prevailing trend
Trend Reversal n n When after consistently making higher highs and higher lows in a rising trend, the stock makes a lower high and lower low formation and vice versa Any price move supported with high volumes is suggestive of strong trend.
Chart Patterns n n n n Triangle Rectangle Flags and Pennants Double Top Double Bottom Head and Shoulders Pattern Inverted Head and Shoulders
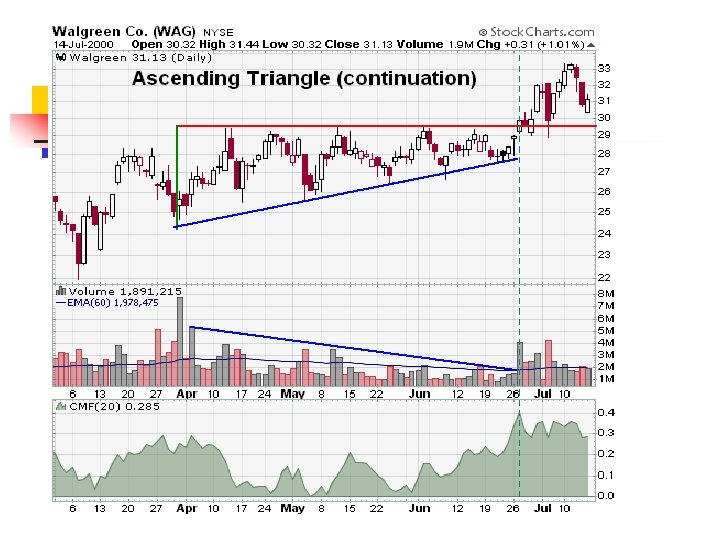
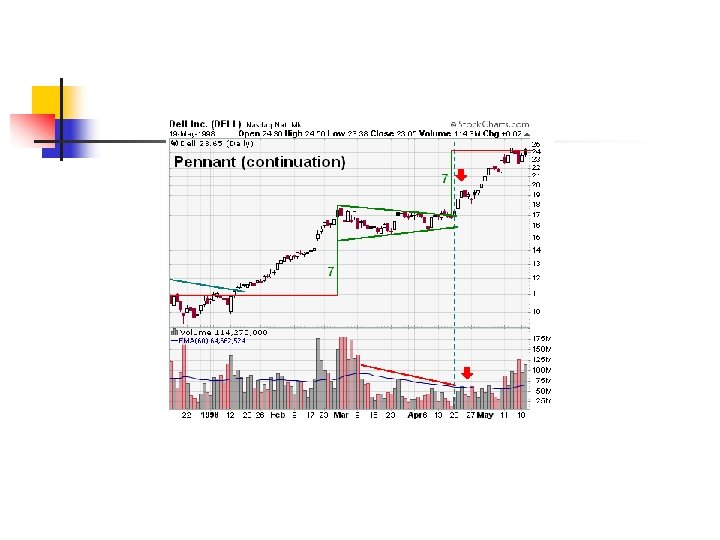
Triangle Price Pattern n Triangle price pattern is formed when, for a few days during an ongoing trend, prices form lower highs and higher lows. It indicates that after a consistent rise or fall, traders are pausing for a while to ‘rest’ and decide whether the price should go further in earlier direction or not.
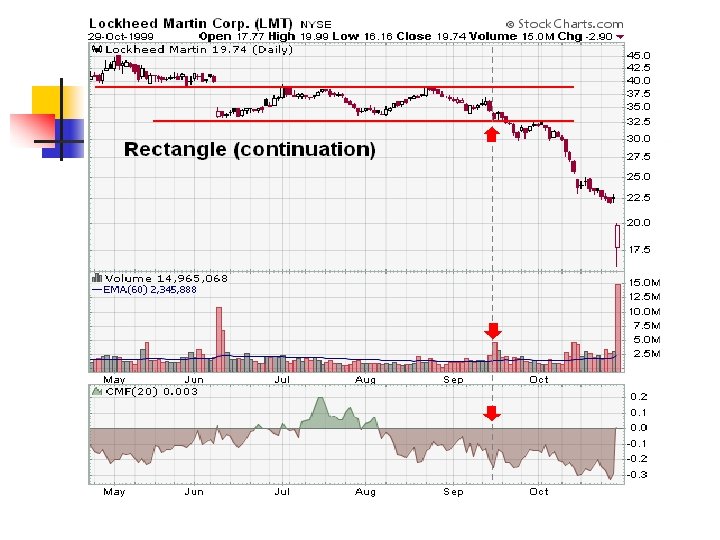
Rectangular Price Pattern n Rectangular price pattern is formed when, for a few days during an ongoing trend, prices form equal highs and equal lows. It indicates that after a consistent rise or fall, traders are pausing for a while to ‘rest’ and decide whether the price should go further in earlier direction or not.
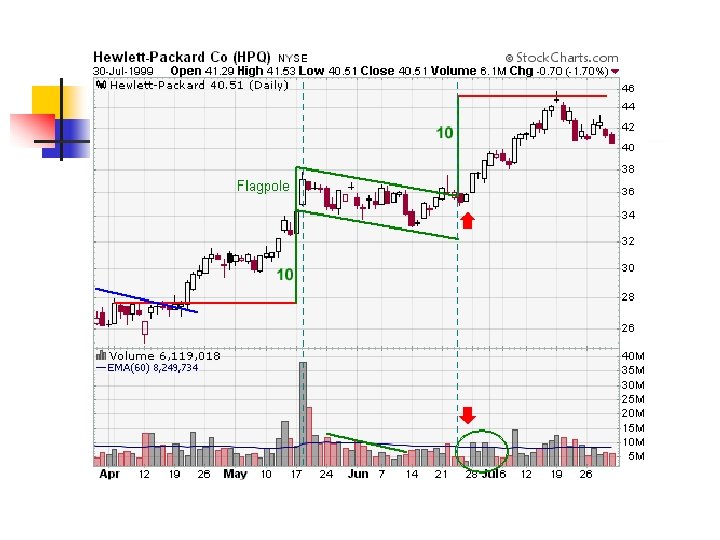
Bullish Flag n Bullish flag pattern is formed when during an ongoing trend, prices form lower highs coupled with lower lows. It indicates that after a consistent price rise, certain sections of the market are putting selling pressure on the price.
Bearish Flag n Bearish flag pattern is formed when during an ongoing down trend, prices form higher highs coupled with higher lows. It indicates that after a consistent price fall, certain sections of the market are putting buying pressure on the price.
Double Top Formation n Double top price pattern forms, when the price retests a previous high but is unable to go any higher. The stock finds more sellers than buyers at the previous high level. This usually occurs at the end of long up trend and cautions traders that a reversal may be due.
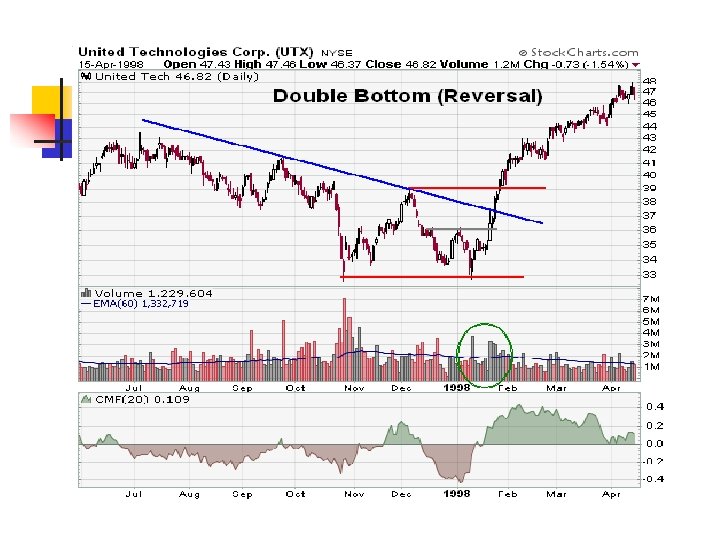
Double Bottom Formation n Double bottom price pattern forms, when the price retests a previous low but does not go any lower. The stock finds more buyers than sellers at the previous low level. This usually occurs at the end of long down trend and cautions traders that a reversal may be due.
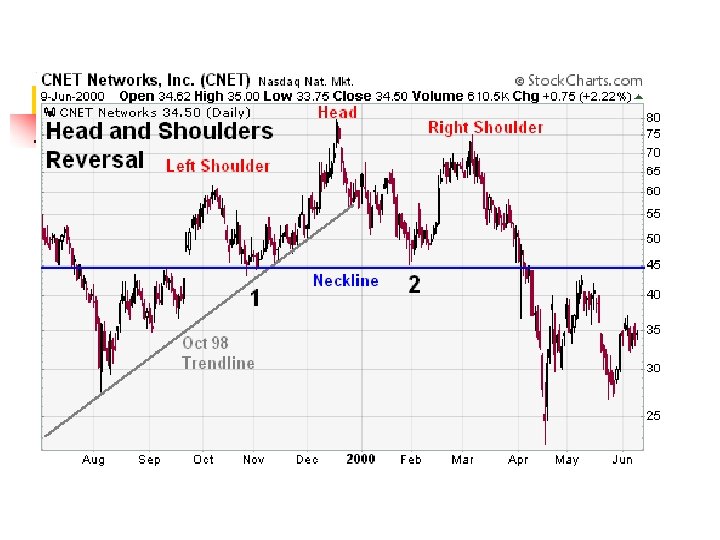
Head & Shoulders Formation n This pattern is similar to the human form of two shoulders and a head. The first shoulder (left) is formed in continuation of the ongoing up trend. A steep and fast rally then takes the price to new highs. Thereafter there is a cooling off period during which the price retraces to the neckline and subsequently makes a lower high.
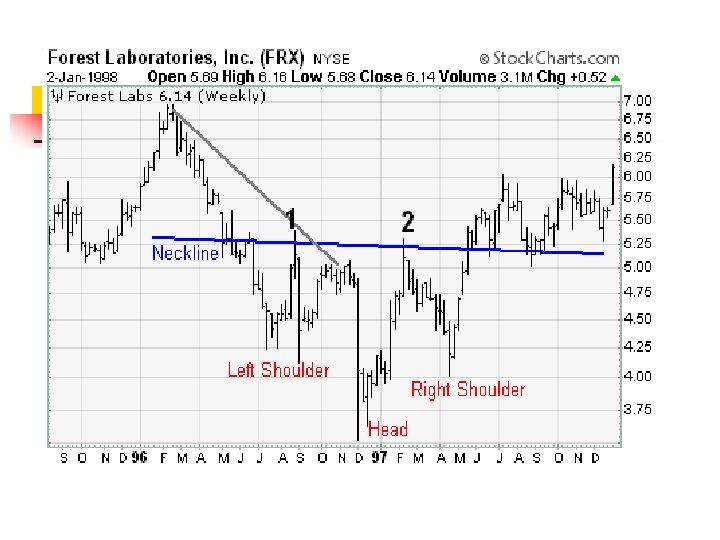
Inverse Head & Shoulders Formation n This pattern is similar to the inverted human form of two shoulders and a head. The first shoulder (left) is formed in continuation of the ongoing down trend. A steep and fast crash then takes the price to new lows. Thereafter there is a cooling off period during which the price retraces to the neckline and subsequently makes a lower low.
Testing for price patterns n n n Serial correlation, where you look at how price changes in a period are correlated with price changes in prior periods Runs tests, where you look at sequences of “up” or “down” periods and test them against randomness. Filter rules and relative strength, where you examine whether investment strategies based upon past price performance beat the market.
Serial correlation � � Serial correlation measures the correlation between price changes in consecutive time periods Measure of how much price change in any period depends upon price change over prior time period. 0: imply that price changes in consecutive time periods are uncorrelated with each other >0: evidence of price momentum in markets <0: Evidence of price reversals
Serial Correlation and Excess Returns � From viewpoint of investment strategy, serial correlations can be exploited to earn excess returns. n A positive serial correlation would be exploited by a strategy of buying after periods with positive returns and selling after periods with negative returns. n A negative serial correlation would suggest a strategy of buying after periods with negative returns and selling after periods with positive returns. n The correlations must be large enough for investors to generate profits to cover transactions costs.
Serial correlation in the short term n n As you move from hours and days to weeks or a month, there seems to be some evidence that prices reverse. In other words, stocks that have done well over the last month are more likely to do badly in the next one and stocks that have done badly over the last month are more likely to bounce back. The reasons given are usually rooted in market over reaction, i. e, . that the stocks that have gone up (down) the most over the most recent month are ones where markets have over reacted to good (bad) news that came out about the stock over the month. The price reversal than reflects markets correcting themselves.
“Evidence” on momentum n n Volume effect: Momentum accompanied by higher trading volume is stronger and more sustained than momentum with low trading volume. Size effect: While some of the earlier studies suggest that momentum is stronger at small market cap companies, a more recent study that looks at US stocks from 1926 to 2009 finds the relationship to be a weak one, though it does confirm that there are sub periods (1980 -1996) where momentum and firm size are correlated. Upside vs Downside: The conclusions seem to vary, depending on the time period examined, with upside momentum dominating over very long time periods (1926 -2009) and downside momentum winning out over some subperiods (such as the 1980 -1996). Growth effect: Price momentum is more sustained and stronger for higher growth companies with higher price to book ratios than for more mature companies with lower price to book ratios.
Long Term Serial Correlation � � � In contrast to the studies of short term correlation, there is evidence of strong correlation in long term returns. When long term is defined as months, there is positive correlation - a momentum effect. When long term is defined as years, there is negative correlation - reversal in prices. The effect is much stronger for smaller companies.
Blooper versus Bubble n Blooper n Rational markets can make mistakes. Assessments of value are based upon expectations, which are formed with the information that is available at the time of the assessments. You will be wrong a lot of the time and very wrong some of the time. n It is therefore entirely possible and very likely, even in an efficient market, to see significant pricing errors.
Blooper versus Bubble n n Bubble n A bubble is a willful error, suggestive of irrational behavior at some level. n This irrational behavior manifests itself as an unwillingness or incapacity on the part of investors in the market to face up to reality. Separating bloopers from bubbles is difficult. There is a tendency on the part of some (the anti-market efficiency crowd) to view all big price adjustments as evidence of bubbles, just as there is a tendency on the part of the others (the true believers in market efficiency) to view all big price adjustments as evidence of bloopers.
Deconstructing a Bubble � There are four phases in every bubble, though the length of each phase may vary from bubble to bubble. n n The The formation of the bubble sustenance of the bubble bursting of the bubble after-math
The Birth of a Bubble n n Most bubbles have their genesis in a kernel of truth. In other words, at the heart of each bubble is a perfectly sensible story. The bubble builds as n Positive reinforcement is provided to irrational or ill -thought out actions on the part of some investors. n News about the success of these investors is broadcast to the rest of the market. n Other investors imitate the first movers and create a self-fulfilling prophecy…
The Sustenance of a Bubble n Institutional Parasites: Institutions, individuals and other entities make money off the bubble and develop vested interests in preserving and expanding the bubble. These include n Investment bankers n Brokers n Portfolio managers
The Sustenance of a Bubble n Support is provided for the bubble by academics and intellectuals(well-meaning or otherwise) who n Proclaim that the old rules no longer apply because n Claim new paradigms… n Disparage those who do not buy into the bubble as being old-fashioned
The Bursting of a Bubble n n There is usually no single precipitating event that causes bubbles to burst, but a confluence of factors. n You run out of suckers. The investors who are your best targets are already fully invested in the bubble. n You become exhausted trying to explain the unexplainable… n Each new entry into the bubble is more outrageous than the previous one and more difficult to explain. The first hint of doubt among the true believers very quickly turns to panic as reality sets in…Well devised exit strategies break down as everyone heads for the exit doors at the same time.
The Aftermath o “I was smarter than the average investor” : You cannot find anyone who lost money when the bubble burst. They all claim either that they never invested in it ( denial) or that they saw the correction coming and got out in time (hindsight). n “It was the investment banker’s fault”: Investors look for someone to blame and the forces that sustain the bubble (the bubble parasites and intellectuals) become the obvious targets. n “I will never invest in a bubble again”: Everyone claims that they have learned their lessons and will not be taken in again.
Seasonal and Temporal Effects on Prices � Empirical studies indicate a variety of seasonal and temporal irregularities in stock prices. Among them are: n The January Effect: Stocks, on average, tend to do much better in January than in any other month of the year. n The Weekend Effect: Stocks, on average, seem to do much worse on Mondays than on any other day of the week. n The Mid-day Swoon: Stocks, on average, tend to do much worse in the middle of the trading day than at the beginning and end of the day.
The January Effect � � � Studies of returns in the United States and other major financial markets consistently reveal strong differences in return behavior across the months of the year. Returns in January are significantly higher than returns in any other month of the year. This phenomenon is called the year-end or January effect, and it can be traced to the first two weeks in January. The January effect is much more accentuated for small firms than for larger firms, and roughly half of the small firm premium, described in the prior section, is earned in the first two days of January.
Explanations for the January Effect n A number of explanations have been advanced for the January effect, but few hold up to serious scrutiny. n Tax loss selling by investors at the end of the year on stocks which have 'lost money' to capture the capital gain, driving prices down, presumably below true value, in December, and a buying back of the same stocks in January, resulting in the high returns. Since wash sales rules would prevent an investor from selling and buying back the same stock within 45 days, there has to be some substitution among the stocks. Thus investor 1 sells stock A and investor 2 sells stock B, but when it comes time to buy back the stock, investor 1 buys stock B and investor 2 buys stock A.
Explanations for the January Effect n A second rationale is that the January effect is related to institutional trading behavior around the turn of the years. It has been noted, for instance, that ratio of buys to sells for institutions drops significantly below average in the days before the turn of the year and picks to above average in the months that follow.
The Weekend Effect � � The weekend effect is another phenomenon that has persisted over long periods and over a number of international markets. It refers to the differences in returns between Mondays and other days of the week. Over the years, returns on Mondays have been consistently lower than returns on other days of the week.
The Weekend Effect in International Markets
The Weekend Effect: Explanations � � First, the Monday effect is really a weekend effect since the bulk of the negative returns is manifested in the Friday close to Monday open returns. The returns from intraday returns on Monday are not the culprits in creating the negative returns. Second, the Monday effect is worse for small stocks than for larger stocks. Third, the Monday effect is no worse following three-day weekends than two-day weekends.
The Weekend Effect: Explanations � There are some who have argued that the weekend effect is the result of bad news being revealed after the close of trading on Friday and during the weekend. Even if this were a widespread phenomenon, the return behavior would be inconsistent with a rational market, since rational investors would build in the expectation of the bad news over the weekend into the price before the weekend, leading to an elimination of the weekend effect.
Dow Theory n n Averages discount everything Market movement consist of three trends: n Primary Trend – Where prices are generally headed for n Secondary Trend – Intermittent correction in prices in the opposite direction of the trend n Minor Trend – Mainly day to day fluctuations
Dow Theory n Primary trends have three phases n n n First phase is beginning of bull market Second phase when corporate results start sowing signs of revival Third phase is of speculation and super speculation The various indices confirm to each other Volumes confirm the trend Trend remains intact until it gives a definite reversal
Technical Indicators n n Spread Moving Averages Volume Bollinger Bands – They attempt to capture the volatility of a security’s price movements, using moving average as basis. It consists of three lines. One is a pre defined moving average and the other two are the upper and lower bands of the moving average line. The two bands are calculated as mean +- 2 standard deviations.
Technical Indicators n Fibonacci Relevance – Theory used for defining moving average periods. An up or down trend generally reverses on Fibonacci days. Fibonacci ratios are used by technical analysts to determine possible support and resistance areas.
Technical Indicators n n Short Interest Ratio- No. of shares sold short divided by Average Daily trading volume Confidence Index- Ratio of group of lower grade bonds to a group of higher grade bonds Advance Decline Ratio Market Breadth Index