SPECTRAL RESPONSE AT VARIOUS TARGETS Mirza Muhammad Waqar


; the")


 allow")


 Moisture Contents Beyond 1300 nm incident energy upon vegetation")


- Slides: 43
SPECTRAL RESPONSE AT VARIOUS TARGETS Mirza Muhammad Waqar Contact: mirza. waqar@ist. edu. pk +92 -21 -34650765 -79 EXT: 2257 RG 610 Course: Introduction to RS & DIP
Outlines Satellite Sensor Pushbroom vs Wiskbroom Sensors Spectral Signature Spectral Reflectance Curve of Snow Spectral Reflectance Curve of Vegetation Spectral Reflectance Curve of Soil, Water and Cloud
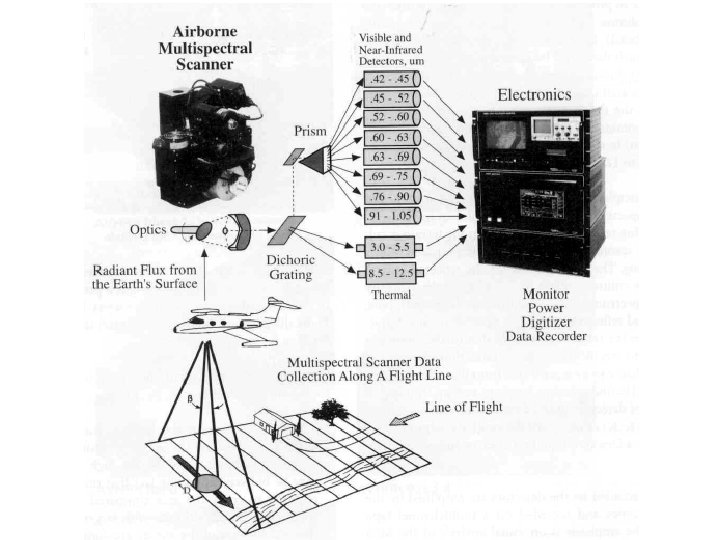
Pushbroom vs Wiskbroom Sensors Spectrometer
Hyperspectral Image Acquisition
Spectral Signature Every natural and synthetic object on the earth’s surface and near surface � Reflects & Emits EMR over a range of wavelengths in its own characteristic way according to its � Chemical composition � Physical state.
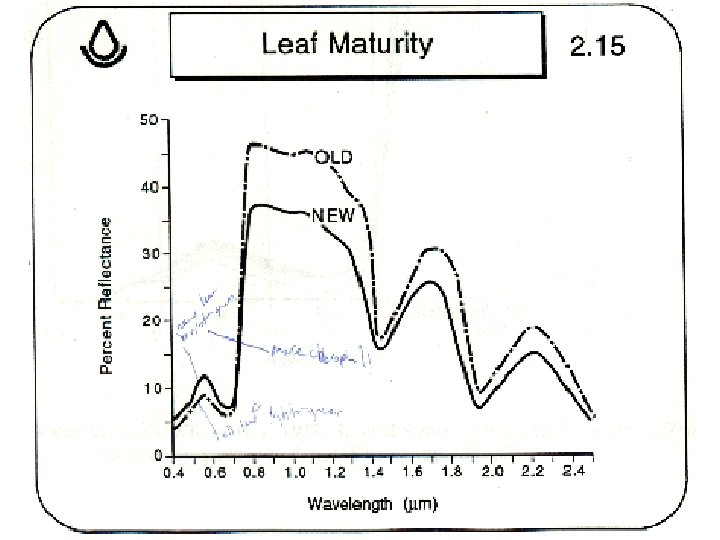
Spectral Signature q Spectral characteristics do not remain static rather change with q Geographic location q Time. For example, forest canopy may be green in July, red, yellow or brown in September.
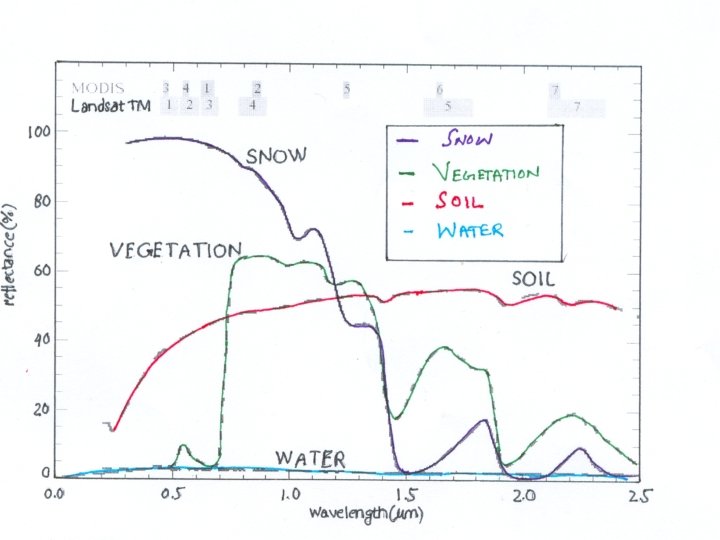
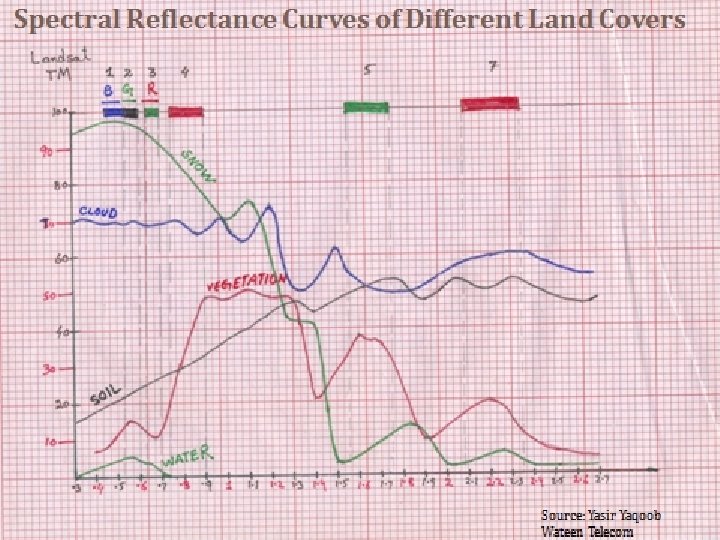
Spectral Reflectance Curves / Signatures Spectral reflectance curves are graphical representations of the spectral response of a certain type of features as a function of wavelength. 1. Each feature has its own unique spectral reflectance curve. 2. These curves are defined by the varying percent of reflectance.
Spectral Signature – Image Interpretation Plotting the spectral reflectance curves in graphic format will allow us � To determine which bands are most useful for discriminating certain type of features. The higher the contrast (gaps) between the signature curves of any two types of features: � The easier it should be to distinguish them � The greater the potential is for fast and accurate image interpretation and mapping.
Spectral Reflectance Curve of Snow
What is Snow? q q Snow is actually a form of precipitation in the form of ice crystals. These ice crystals are hexagonal prisms. Snowflakes -- Collections of snow crystals Rime -- Super cooled tiny water droplets that quickly freeze onto whatever they hit. Grapuel -- Loose collections of frozen water droplets, Hail -- Large, solid chunks of ice
Spectral Properties of Snow It depends upon the following snow parameters ; Grain Size and Shape Impurity Contents Near Surface Liquid Water Content Depth And Surface Roughness Solar elevation
Spectral Properties of Snow Fresh fallen snow has a very high reflectance in the visible wavelengths. As snow ages, the reflectivity of snow decreases in the visible and specially in the NIR wavelengths. This decrease in reflection is due to melting and refreezing with in the surface layers and to the natural addition of impurities. Melting of snow increase the mean grain size and density.
Continued… In the wavelength region between approximately (0. 65 -1. 4 micro m); the difference in snow crystal radius leads to the greater difference in the reflection. The greater the size of grain the greater will be the decrease in the reflection. The reflection of glacier ice is quite low. But the glacier ice covered with snow increases the reflection. Presence of melt water decreases the reflection.
Spectral Signature of Snow & Ice
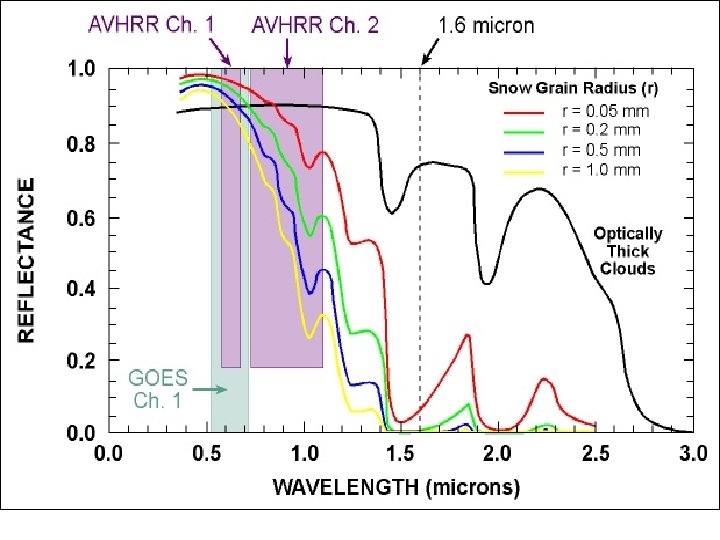
Distinguishing Snow and Cloud q q q Snow and cloud has same reflectance in visible portion of the spectrum. So how can we discriminate between these two features …? ? ?
Continued… q Snow can be distinguished From Cloud in middle infrared band At the wavelength of 1. 6 m, snow has very low reflectance, while the reflectance of clouds remains high.
Spectral Reflectance Curve of Vegetation
Vegetation • • • Vegetation covers a large portion of the Earth's land surface. Obtaining quantitative information about vegetation with remote sensing has proven difficult All vegetation is chemically similar, and most healthy plants are green showing absorption bands.
Types of vegetation Broad leaf Conifers Shrubs & herbs Grasses
Structure of Leaf
Internal structure of leaf q q Epidermis: protects the leaf and is transparent to let light through. Palisade mesophyll : cells are tall and closely packed to absorb maximum light. They contain many chloroplasts. Most photosynthesis takes place in the palisade cells.
Contd. . q q Spongy mesophyll: also captures light and makes food. Spongy mesophyll cells have air spaces between them to allow easy gas exchange. Veins : contain xylem (top part of vein) for water transport and phloem (lower part of vein) to take away dissolved food.
Contd. . • • Stomata : (mostly on the underside of the leaf) allow gas exchange; since a lot of water vapor can be lost through the stomata they only open for photosynthesis in daylight. At night they close to reduce loss of water vapour.
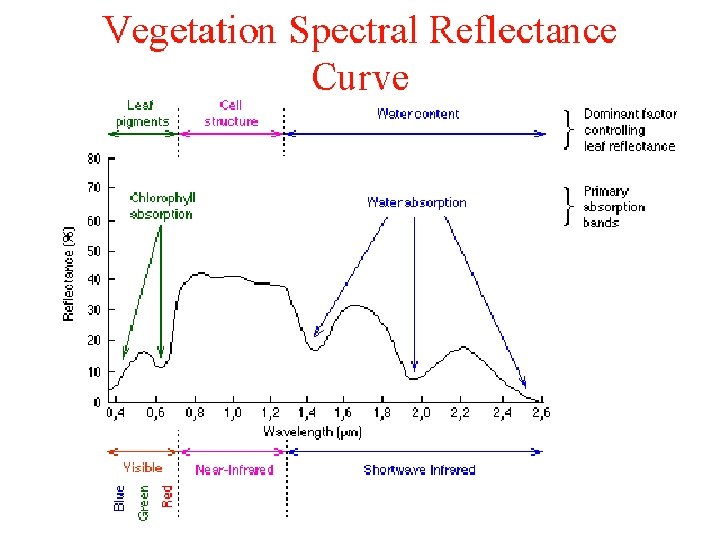
Major factors of Vegetation Mapping q q q Chlorophyll and other pigments Structural biochemical molecules Water absorption bands
Leaf Structure
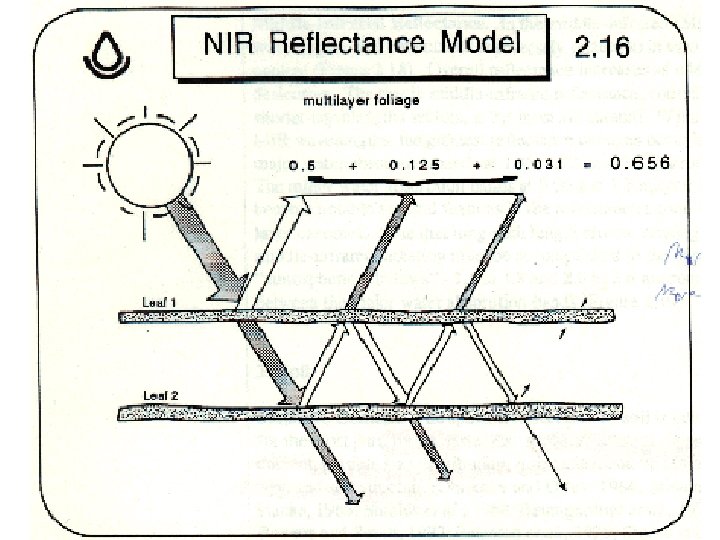
Mesophyll vs NIR Reflectance Lots of palisade mesophyll = low NIR reflectance Lots of spongy mesophyll = higher NIR reflectance
Leaf Water Content
The Red Edge
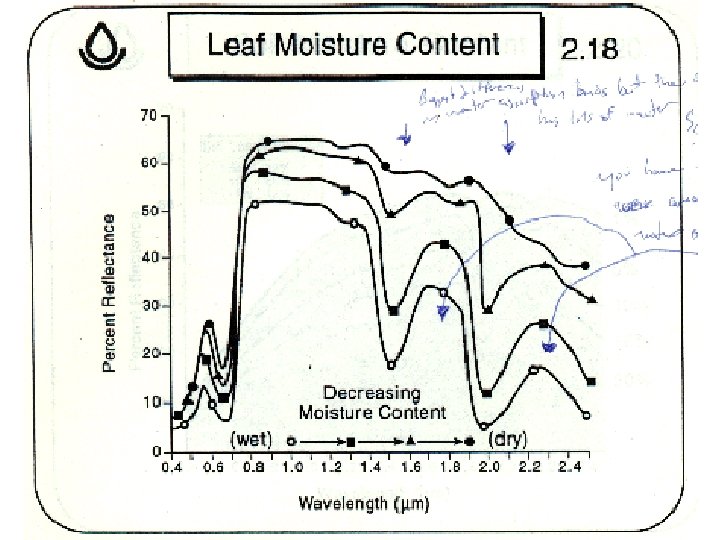
MIR REGION (1350 -2500 nm) Moisture Contents Beyond 1300 nm incident energy upon vegetation is essentially absorbed or reflect. The dips in the reflectance occur at 1400, 1900 and 2700 nm; because water in the leaves strongly absorb energy in these wavelengths; often known as “WATER ABSORPTION BANDS”. The peaks in this region occur at 1600 & 2200 nm.
Healthy, Stressed & Severely Stressed Vegetation
Snow, vegetation, rock: spectra of mixed pixels
Spectral Characteristics Viewer http: //landsat. usgs. gov/tools_viewer. php
Questions & Discussion