screen get0 Screen Size W screen3 H screen4
; W = screen(3); H = screen(4); figure('Color', [1, 1,")
,并建立一个与之相 联系的快捷菜单,用以控制曲线的线型和曲线宽度。 x = 0: pi/100: 2*pi; y =")
![hf = figure('Color', [0, 1, 1], 'Position', [100, 200, 400, 200], . . .](https://slidetodoc.com/presentation_image/31fe62d2bb5f22377b9b82cb9878b41a/image-12.jpg "hf = figure('Color', [0, 1, 1], 'Position', [100, 200, 400, 200], . . .")
![clf; set(gcf, 'Unit', 'normalized', 'Position', [0. 2, 0. 3, 0. 65, 0. 35]); set(gcf,](https://slidetodoc.com/presentation_image/31fe62d2bb5f22377b9b82cb9878b41a/image-15.jpg "clf; set(gcf, 'Unit', 'normalized', 'Position', [0. 2, 0. 3, 0. 65, 0. 35]); set(gcf,")
 reference: getstart. pdf, chapter 6,")


 template. Click OK")
的GUI组件的 名称, 选择 File → Preferences→ Show names in component palette")


- Slides: 53
screen = get(0, 'Screen. Size'); W = screen(3); H = screen(4); figure('Color', [1, 1, 1], 'Position', [0. 2*H, 0. 6*W, 0. 4*H], . . . 'Name', '图形演示系统', 'Number. Title', 'off', 'Menu. Bar', 'none'); %定义Plot菜单项 hplot = uimenu(gcf, 'Label', '&Plot'); uimenu(hplot, 'Label', 'Sine Wave', 'Call', ['t=-pi: pi/20: pi; ', 'plot(t, sin(t)); ', . . . 'set(hgon, ''Enable'', ''on''); ', 'set(hgoff, ''Enable'', ''on''); ', . . . 'set(hbon, ''Enable'', ''on''); ', 'set(hboff, ''Enable'', ''on''); ']); uimenu(hplot, 'Label', 'Cosine Wave', 'Call', ['t=-pi: pi/20: pi; ', 'plot(t, cos(t)); ', . . . 'set(hgon, ''Enable'', ''on''); ', 'set(hgoff, ''Enable'', ''on''); ', . . . 'set(hbon, ''Enable'', ''on''); ', 'set(hboff, ''Enable'', ''on''); ']); %定义Option菜单项 hoption = uimenu(gcf, 'Label', '&Option'); hgon = uimenu(hoption, 'Label', '&Grig on', 'Call', 'grid on', 'Enable', 'off'); hgoff = uimenu(hoption, 'Label', '&Grig off', 'Call', 'grid off', 'Enable', 'off'); hbon = uimenu(hoption, 'Label', '&Box on', 'separator', 'on', 'Call', 'box on', 'Enable', 'off'); hboff = uimenu(hoption, 'Label', '&Box off', 'Call', 'box off', 'Enable', 'off'); hfigcor = uimenu(hoption, 'Label', '&Figure Color', 'Separator', 'on'); uimenu(hfigcor, 'Label', '&Red', 'Accelerator', 'Call', 'set(gcf, ''Color'', ''r''); uimenu(hfigcor, 'Label', '&Blue', 'Accelerator', 'b', 'Call', 'set(gcf, ''Color'', ''b''); uimenu(hfigcor, 'Label', '&Yellow', 'Call', 'set(gcf, ''Color'', ''y''); uimenu(hfigcor, 'Label', '&White', 'Call', 'set(gcf, ''Color'', ''w''); %定义Quit菜单项 uimenu(gcf, 'Label', '&Quit', 'Call', 'close(gcf)');
例5. 2 绘制曲线y=2 e-0. 5 xsin(2πx),并建立一个与之相 联系的快捷菜单,用以控制曲线的线型和曲线宽度。 x = 0: pi/100: 2*pi; y = 2*exp(-0. 5*x). *sin(2*pi*x); hl = plot(x, y); hc = uicontextmenu; %建立快捷菜单 hls = uimenu(hc, 'Label', '线型'); %建立菜单项 hlw = uimenu(hc, 'Label', '线宽'); uimenu(hls, 'Label', '虚线', 'Call', 'set(hl, ''Line. Style'', '': ''); uimenu(hls, 'Label', '实线', 'Call', 'set(hl, ''Line. Style'', ''-''); uimenu(hlw, 'Label', '加宽', 'Call', 'set(hl, ''Line. Width'', 2); '); uimenu(hlw, 'Label', '变细', 'Call', 'set(hl, ''Line. Width'', 0. 5); '); set(hl, 'UIContext. Menu', hc); %将该快捷菜单和曲线对象联系起来
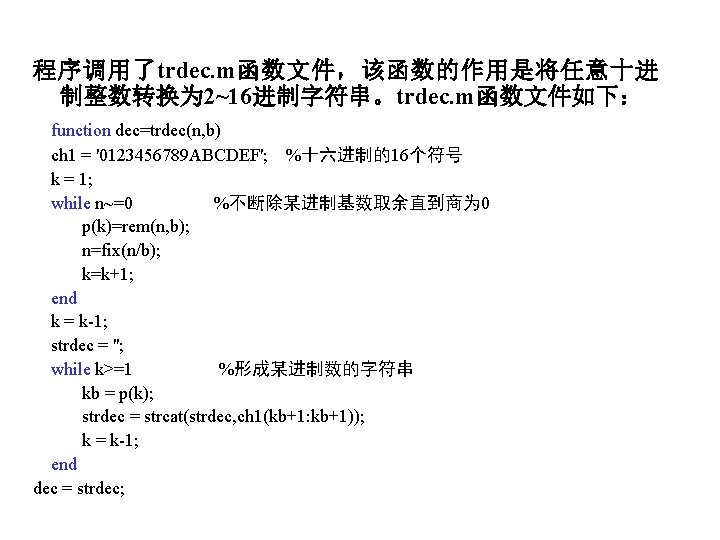
hf = figure('Color', [0, 1, 1], 'Position', [100, 200, 400, 200], . . . 'Name', '数制转换', 'Number. Title', 'off', 'Menu. Bar', 'none'); uicontrol(hf, 'Style', 'Text', 'Units', 'normalized', 'Position', [0. 05, 0. 8, 0. 45, 0. 1], 'Horizontal', 'center', . . . 'String', '输 入 框', 'Back', [0, 1, 1]); uicontrol(hf, 'Style', 'Text', 'Position', [0. 5, 0. 8, 0. 45, 0. 1], 'Units', 'normalized', 'Horizontal', 'center', . . . 'String', '输 出 框', 'Back', [0, 1, 1]); uicontrol(hf, 'Style', 'Frame', 'Position', [0. 04, 0. 33, 0. 45], 'Units', 'normalized', 'Back', [1, 1, 0]); uicontrol(hf, 'Style', 'Text', 'Position', [0. 05, 0. 6, 0. 25, 0. 1], 'Units', 'normalized', 'Horizontal', 'center', . . . 'String', '十进制数', 'Back', [1, 1, 0]); uicontrol(hf, 'Style', 'Text', 'Position', [0. 05, 0. 4, 0. 25, 0. 1], . . . 'Units', 'normalized', 'Horizontal', 'center', 'String', '2~ 16进制', 'Back', [1, 1, 0]); he 1 = uicontrol(hf, 'Style', 'Edit', 'Position', [0. 25, 0. 6, 0. 2, 0. 1], 'Units', 'normalized', 'Back', [0, 1, 0]); he 2 = uicontrol(hf, 'Style', 'Edit', 'Position', [0. 25, 0. 4, 0. 2, 0. 1], 'Units', 'normalized', 'Back', [0, 1, 0]); uicontrol(hf, 'Style', 'Frame', 'Position', [0. 52, 0. 33, 0. 45], 'Units', 'normalized', 'Back', [1, 1, 0]); ht = uicontrol(hf, 'Style', 'Text', 'Position', [0. 6, 0. 5, 0. 3, 0. 1], . . . 'Units', 'normalized', 'Horizontal', 'center', 'Back', [0, 1, 0]); COMM = ['n=str 2 num(get(he 1, ''String'')); ', 'b=str 2 num(get(he 2, ''String'')); ', . . . 'dec=trdec(n, b); ', 'set(ht, ''string'', dec); ']; uicontrol(hf, 'Style', 'Push', 'Position', [0. 18, 0. 1, 0. 2, 0. 12], . . . 'String', '转 换', 'Units', 'normalized', 'Call', COMM); uicontrol(hf, 'Style', 'Push', 'Position', [0. 65, 0. 1, 0. 2, 0. 12], . . . 'String', '退 出', 'Units', 'normalized', 'Call', 'close(hf)');
clf; set(gcf, 'Unit', 'normalized', 'Position', [0. 2, 0. 3, 0. 65, 0. 35]); set(gcf, 'Menubar', 'none', 'Name', '图形演示', 'Number. Title', 'off'); axes('Position', [0. 05, 0. 15, 0. 55, 0. 7]); uicontrol(gcf, 'Style', 'text', 'Unit', 'normalized', . . . 'Posi', [0. 63, 0. 85, 0. 2, 0. 1], 'String', '输入绘图命令', 'Horizontal', 'center'); hedit=uicontrol(gcf, 'Style', 'edit', 'Unit', 'normalized', 'Posi', [0. 63, 0. 15, 0. 2, 0. 68], . . . 'Max', 2); %Max取 2,使Max-Min>1,从而允许多行输入 hpopup=uicontrol(gcf, 'Style', 'popup', 'Unit', 'normalized', . . . 'Posi', [0. 85, 0. 8, 0. 15], 'String', 'Spring|Summer|Autumn|Winter'); hlist=uicontrol(gcf, 'Style', 'list', 'Unit', 'normalized', . . . 'Posi', [0. 85, 0. 55, 0. 15, 0. 25], 'String', 'Grid on|Grid off|Box on|Box off'); hpush 1=uicontrol(gcf, 'Style', 'push', 'Unit', 'normalized', . . . 'Posi', [0. 85, 0. 35, 0. 15], 'String', '绘 图'); uicontrol(gcf, 'Style', 'push', 'Unit', 'normalized', . . . 'Posi', [0. 85, 0. 15, 0. 15], 'String', '关 闭', 'Call', 'close all'); set(hpush 1, 'Call', 'COMM(hedit, hpopup, hlist)'); set(hlist, 'Call', 'COMM(hedit, hpopup, hlist)'); set(hpopup, 'Call', 'COMM(hedit, hpopup, hlist)'); %COMM. m函数文件: function COMM(hedit, hpopup, hlist) com=get(hedit, 'String'); n 1=get(hpopup, 'Value'); n 2=get(hlist, 'Value'); if ~isempty(com) %编辑框输入非空时
5. 3 用户界面设计 具 (Graphical user interface development environment) reference: getstart. pdf, chapter 6, pp. 197
The Layout Editor with a blank GUI template
drag a push button into the layout area
GUI FIG-Files and M-Files GUIDE stores a GUI in two files, which are generated the first time you save or run the GUI: l A FIG-file, with extension. fig, which contains a complete description of the GUI layout and the components of the GUI: push buttons, menus, axes, and so on. l A M-file, with extension. m, that contains the code that controls the GUI, including the callbacks for its components. These two files correspond to the tasks of laying out and programming the GUI. When you lay out of the GUI in the Layout Editor, your work is stored in the FIG-file. When you program the GUI, your work is stored in the M-file
Creating Graphical User Interfaces • Designing the GUI • • Laying Out the GUI Setting Properties for GUI Components Programming the GUI Saving and Running a GUI
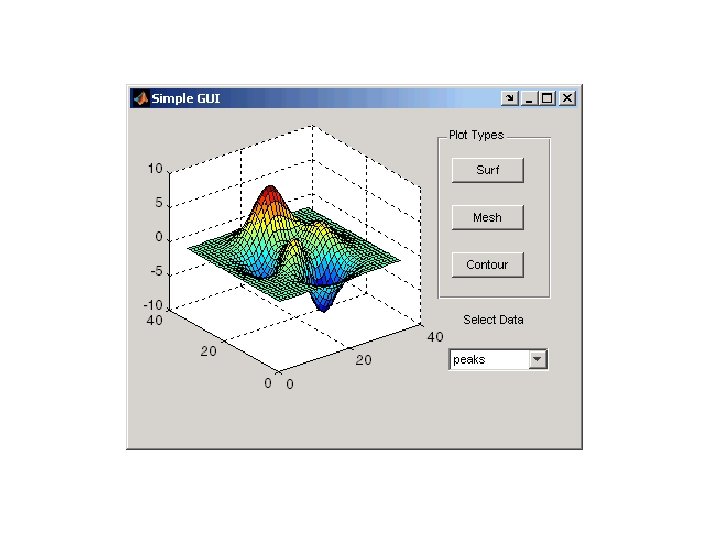
Designing the GUI üAn axes that displays plot of the data üThree push buttons that enable you to select the type of plot you want. üThe pop-up menu contains three strings -- peaks, membrane, and sinc, which correspond to MATLAB functions. You can select the data to plot from this menu.
Laying Out the GUI Ø Open a New GUI in the Layout Editor Ø Set the GUI Figure Size. Ø Add the Components Ø Align the Components.
>> guide
Select the Blank GUI (default) template. Click OK
若要显示组件面板(component palette)的GUI组件的 名称, 选择 File → Preferences→ Show names in component palette
Set the GUI Figure Size
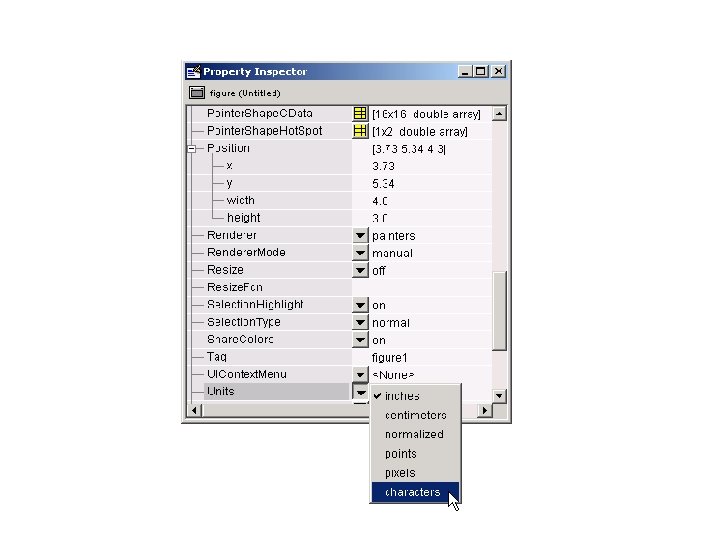
l If you want to set the position or size of the GUI to an exact value: 1. Select Property Inspector from the View menu. 2. Select the button next to Units and then select inches from the pop-up menu 3. Click the + sign next to Position. 4. Type the x and y coordinates of the point where you want the lower left corner of the GUI to appear, and its width and height, as shown in the following figure. 5. Reset the Units property to characters.
Add the Components 1. Add the panel and push buttons to the GUI.
Add the remaining components to the GUI: a static text , a pop-up menu, an axes
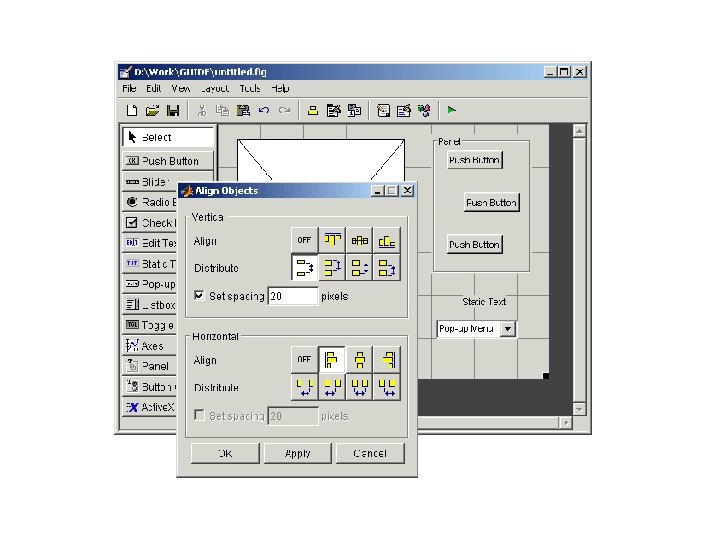
Align the Components Alignment Tool : 将有同一父代的组件对齐 如:将上面的三个push buttons对齐 1. pressing Ctrl and clicking them. 2. Tools menu → Align Objects , 出现 Alignment Object. 3. 本例中采用如下设置: ü 20 pixels spacing between push buttons in the vertical direction. ü Left-aligned in the horizontal direction.
Setting Properties for GUI Components View →Property Inspector from the menu to display the Property Inspector dialog box l l l Name Property Title Property String Property for Push Buttons and Static Text String Property for Pop-Up Menus Callback Properties The Tag Property
l Name Property
l Title Property l String Property for Push Buttons and Static Text
l String Property for Pop-up Menus
the current layout of the GUI appears as :
l Callback Properties Components use callbacks to do their work. Each component and menu item has properties that specify its callbacks. When you create a GUI, you must program the callbacks you need to control operation of the GUI l The Tag Property The Tag property provides a string as a unique identifier for each component. GUIDE uses this identifier to construct unique callback names for the different components in the GUI
When you save or run the GUI, GUIDE sets the name of the callback subfunction in the pop-up menu Callback property to plot_popup_Callback.
Programming the GUI • • • Creating the GUI M-File Opening the GUI M-File Sharing Data Between Callbacks Adding Code to the Opening Function Adding Code to the Callbacks Using the Object Browser to Identify Callbacks
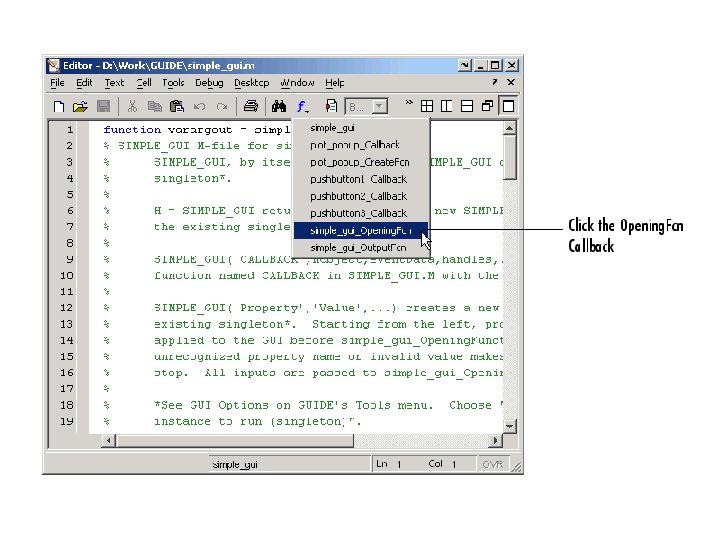
Opening the GUI M-File üAdd code to the callbacks for the three push buttons and the pop-up menu. üopen the created M-file by clicking the M-file Editor icon on the toolbar. In the editor, move the cursor to a specific callback by clicking the function icon on the toolbar, then selecting the callback you want in the pop-up menu that displays.
Sharing Data Between Callbacks Ø Storing the data in the MATLAB handles structure. All components in a GUI share the same handles structure. Eg. Store vector X in the handles structure: 1. Choose a name for the field of the handles structure where you want to store the data, for example, handles. my_data 2. Add the field to the handles structure: handles. my_data = X; 3. Save the handles structure with the guidata function: guidata(h. Object, handles) h. Object is the handle to the component object that executes the callback. Ø h. Object and handles are input arguments for all the callbacks generated by GUIDE
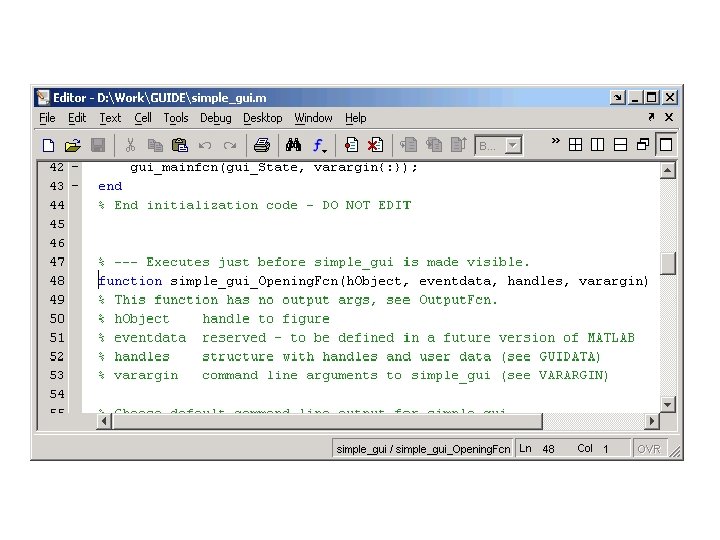
Adding Code to the Opening Function Ø The Opening Function: is the first callback in every GUI M-file. ØName: GUI M-文件的名字_Opening. Fcn,例如: simple_gui_Opening. Fcn ØEg. Add code that creates three data sets in the opening function, using peaks, membrane, and sinc.
% --- Executes just before simple_gui is made visible. function simple_gui_Opening. Fcn(h. Object, eventdata, handles, varargin) % This function has no output args, see Output. Fcn. % h. Object handle to figure % eventdata reserved - to be defined in a future version of MATLAB % handles structure with handles and user data (see GUIDATA) % varargin command line arguments to untitled (see VARARGIN) Autogenerated code % Create the data to plot handles. peaks=peaks(35); handles. membrane=membrane; Add this code [x, y] = meshgrid(-8: . 5: 8); r = sqrt(x. ^2+y. ^2) + eps; sinc = sin(r). /r; handles. sinc = sinc; handles. current_data = handles. peaks; surf(handles. current_data)
Adding Code to the Callbacks Push Button Callbacks
Push Button Callbacks % --- Executes on button press in surf_pushbutton. function surf_pushbutton_Callback(h. Object, eventdata, handles) % h. Object handle to surf_pushbutton (see GCBO) % eventdata reserved - to be defined in a future version of MATLAB % handles structure with handles and user data (see GUIDATA) % Display surf plot of the currently selected data surf(handles. current_data); Autogenerated code Add this code
Add this code to the Mesh push button callback: % Display mesh plot of the currently selected data mesh(handles. current_data); Add this code to the Contour push button callback: % Display contour plot of the currently selected data contour(handles. current_data);
Pop-up Menu Callback % --- Executes on selection change in plot_popup. function plot_popup_Callback(h. Object, eventdata, handles) % h. Object handle to plot_popup (see GCBO) % eventdata reserved - to be defined in a future version of MATLAB % handles structure with handles and user data (see GUIDATA) val = get(h. Object, 'Value'); str = get(h. Object, 'String'); switch str{val}; Add this code case 'peaks' % User selects peaks handles. current_data = handles. peaks; case 'membrane' % User selects membrane handles. current_data = handles. membrane; case 'sinc' % User selects sinc handles. current_data = handles. sinc; end guidata(h. Object, handles) Autogenerated code
Using the Object Browser to Identify Callbacks Ø In a complicated GUI, keeping track of callbacks can be difficult. To identify the component corresponding to a callback, select Object Browser from the View menu. Ø The Object Browser lists the tag and string properties of each component of the GUI.
Using the Object Browser to Identify Callbacks