Quality Control Definitions Quality think of excellent product


 QC Tools")


 - As x increase, y will tend to")


- Slides: 38
Quality Control
Definitions Quality – think of excellent product or service that fulfills or exceeds expectations. Quality can define in 2 meanings: 1) Characteristics of product/service that bear on it’s ability to satisfy stated or implied needs 2) Product/service that is free of deficiencies
In ISO 9000 – the degree which set of inherent characteristics fulfill requirements. Degree – quality can be used as adjectives, such as poor, good or excellent Quality control – the used of technique and activities to achieve and sustain the quality of product/service.
• Statistical Quality Control –the collection, analysis and interpretation of data for use in quality activities.
Why need Quality tools? • Most decision point and root causes remain unclear until valid data are studied analyzed. • Collecting and analyzing data using total quality tools make the task easy for everyone.
Why need Quality tools? • No matter where you fit into organization in future, you may use all or some of these tool and employers will serve you well for better prospects. • This chapter will explain the most widely used of quality tools.
What is the Quality Tools? • The Seven Basic Tools of Quality is a designation given to a fixed set of graphical techniques identified as being most helpful in troubleshooting issues related to quality.
7 Basic (Old) QC Tools
1. PARETO DIAGRAM • • A graph that ranks data classification in descending order from left to right. Other possible data classifications are quality areas, inventory, maintenance, safety, etc. Sometimes necessary to combine some of the useful many into one classification called Other and labeled O in the figure. When the other category is use, it is always on the far right. Used to identify vital few that needs attention and can compare ‘before’ and ‘after’ improvement effect using Pareto.
• Pareto used to identify ‘vital few’ from 2 types; 1. Phenomenon is concern with undesirable results, examples: - Quality: defects, failures, warranty claims, rework items - Delivery: late part delivery, stock shortages, poor suppliers - Safety: accident types, breakdowns - Cost: amount of monetary loss, expenses 2. Causes is concern with causes in the process – to find major causes of problem - Operator: group, age, experience, individuals - Machines: types, brands, models - Raw Material: batch, suppliers, lots, type - Method: different method • Different between Pareto and Histogram it’s horizontal scale of Pareto is categorical, whereas the scale for the histogram is numerical
Constructing a Pareto Diagram 1. Determine problem to be studied and method of collecting data 2. Design data check sheet for data collection. Decide time period (e. g. 2 days study, 2 weeks, etc. ) 3. Collect data, fill in tally (check) mark and calculate totals 4. Make Pareto Summary Form. List individual items total, calculate; - cumulative total - percentage of total - cumulative percentage 5. Draw two vertical axis. Rank in decreasing order. Place others item last - Left side: Mark from 0 to overall total - Right side: Mark from 0 to 100% - Label axis (e. g. no. of rejects) - Draw horizontal axis: Divide according to number of item classified
6. Draw bars for each classification. Label each item under the horizontal axis 7. Draw the cumulative curve (line). Write cumulative percentage at RHS of bar (if needed). Connect the lines 8. Title graph, write source of data, the process, place of investigation, total samples (data) collected and other info DEFECT DETECTED NUMBER OF REJECT White Spot 5 No Clean-Up 1 Handling Damage 18 Others 3 Grinder Grit 2 Centerless Lines 9 Defect Data for Strut Rod Rejects
PARETO DIAGRAM
Example
2. CAUSE-and-EFFECT DIAGRAM • A picture composed of lines and symbols designed to represent a meaningful relationship between an effect and its causes. • Used to investigate either a “bad” effect and to take action to correct the causes or a “good” effect and to learn those causes responsible. • The effect is the quality characteristics that needs improvement. • Causes are usually broken down into the major causes of work methods, materials, machines, people, environment, etc. Each major causes is further subdivided into numerous minor causes.
Basic Types of Cause-and-Effect Diagram 1. Cause Enumeration - most commonly used. - generally using five cause category. (Man, Machine, Method, Material, Environment) 2. Production Process Classification - need to write each step of the process. - assembling, continuous process, etc. - production processes. (e. g. Raw material Cutting Welding Fitting/Assembling Finishing/Buffing Paint) - easy to construct, simple to understand. - applicable to service processes as well.
3. Dispersion Analysis - different approach in construction of diagram. - each major branch is filled in completely before starting work on any of the other branches. - objective is to analyze the causes of variability or dispersion. • The cause-and-effect diagram has nearly unlimited application in research, manufacturing, marketing, office operation, etc. The diagrams are useful in; • Analyzing actual condition for the purpose of product quality improvement, more efficient use of resource , and reduce costs. • Elimination of conditions causing nonconforming product and customer complaints. • Standardization of existing and proposed operations. • Education and training of personnel in decision-making and corrective-action activities.
Procedure for Making Cause-and-Effect Diagram 1. Determine quality characteristic or quality problem to study. 2. Determine main factors or primary causes. 3. Determine secondary causes which affects primary causes and also ‘small bones’ which is affecting secondary causes. 4. Assign importance level, mark particular factor that may have significant effect for solving problem. 5. Write down important information (e. g. date, place, members, department, etc. ).
Figure 1: Cause-and-Effect Diagram
Example
3. CHECK SHEET • To ensure that the data are collected carefully and accurately by operating personnel for process control and problem solving • Data should be presented in such a form that it can be quickly and easily used analyzed • The form of the check sheet is individualized for each situation and is designed by the project team • Check Sheet used to record data about a process • Purpose – easily collect and compile data Types of Check Sheet • Production Process Distribution Check Sheet • Defective Item Check Sheet • Defect Location Check Sheet • Defect Cause Check Sheet
Production Process Distribution Check Sheet • To study distribution of a process characteristics values • To find variation of a measured item - example: variation in diameter of rubber hose • Similar to a histogram • Simple way to classify data exactly at time of collection • Prepared in advance. Symbols (e. g. X) placed in a box each time measurement made • When stratification required on single sheet – use different colour or symbol/mark Check Sheet for Production Process Distribution
Defective Item Check Sheet • To investigate total number of different types of defects occurring • Can give clue to where improvements needed since it shows type of defect most frequent • Incorporate stratification into check sheet design (e. g. morning shift, evening shift, lines, machines, etc. ) • Must understand how to record defects. Can have 2 or more defects in one defective part Defect Item Check Sheet
Defect Location Check Sheet • Visual or appearance factors affecting finished • e. g. Scratches, dents, dirt spots, print defect • Need to know location of occurrence • Defect location – sketch or expanded view of product • Mark location to find pattern of defect occurrence • Once location known – finding causes of defects is easier • e. g. casting blowhole positions, paints chipping, dents, etc. Defect Location Check Sheet
Defect Cause Check Sheet • Need stratification of data to find possible causes of defects • Understand type of defects and possible causes - which machine ? - which worker ? - shift, time, day of week ? • Can take countermeasures immediately Defect Cause Check Sheet
4. PROCESS FLOW DIAGRAM • A schematic diagram that shows the flow of the product or service as it moves through the various processing stations or operations • It easy to visualize the entire system, identify potential trouble spots, and locate control activities • Improvements to the process can be accomplished by eliminating steps, combining steps, or making frequently occurring steps more efficient Flow Chart Symbol Definition Flow Chart for Buying a New Car
5. SCATTER DIAGRAM • A simplest way to determine if a cause-andeffect relationship exists between two variables is to plot a scatter diagram • Figure shows the relationship between automotive speed and gas mileage • Automotive speed is independent variable and gas mileage it’s dependent, or response, variable • e. g. cutting speed (independent) and tool life (dependent), temperature (independent) and viscosity (dependent) • The two variables can be - a quality characteristics and an effect - two related quality characteristics - two different factors affecting one quality characteristics
Common Types of Scatter Diagram (a) - As x increase, y will tend to increase (b) - As x increase, y will tend to decrease (c) - x has no relationship with y (d) and (e) - Possible relationship exist, as x increase y appears to increase or as x increase y appears to decrease (f) – have a curvilinear relationship rather than a linear
6. HISTOGRAM • A bar graph with a measurement scale on one axis and a frequency or percentage scale on the other • The adjacent bars share a common side and all bars are of equal width • A picture of a frequency distribution and is generally used to show the distribution pattern of a large sample of data Histogram for Hole Location
Example
7. CONTROL CHARTS • Control charts are an outstanding technique for problem solving and the resulting quality improvement • Quality improvement occurs in two situations: 1. First time using control charts usually the process is unstable. As assignable causes for out-of-control conditions are identified and corrective action taken, the process becomes stable, with a resulting quality improvement 2. Concerns the testing or evaluation of ideas. Control charts are excellent decision makers because the pattern of the plotted points will determine if the idea is a good one, poor one, or has no effect on the process Control Charts (X-Bar and R) X-Bar and R charts, showing Quality Improvement
Example
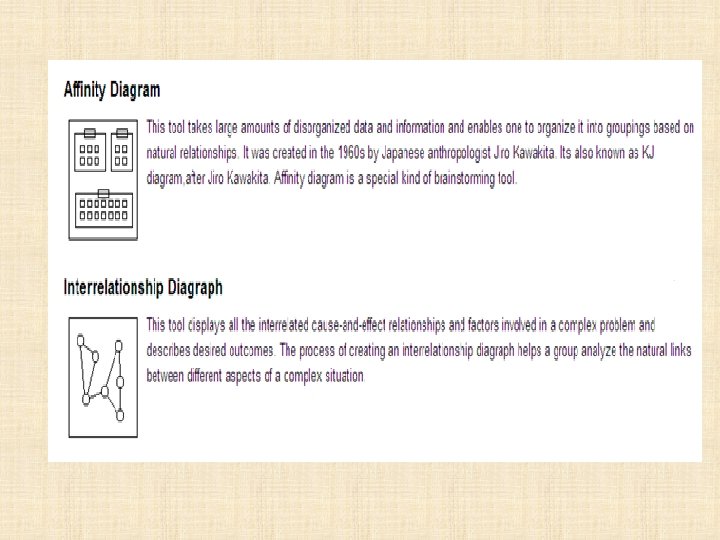
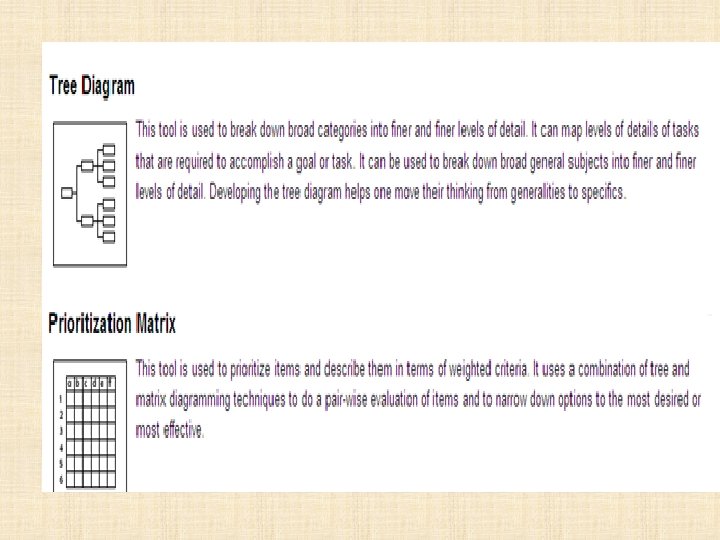
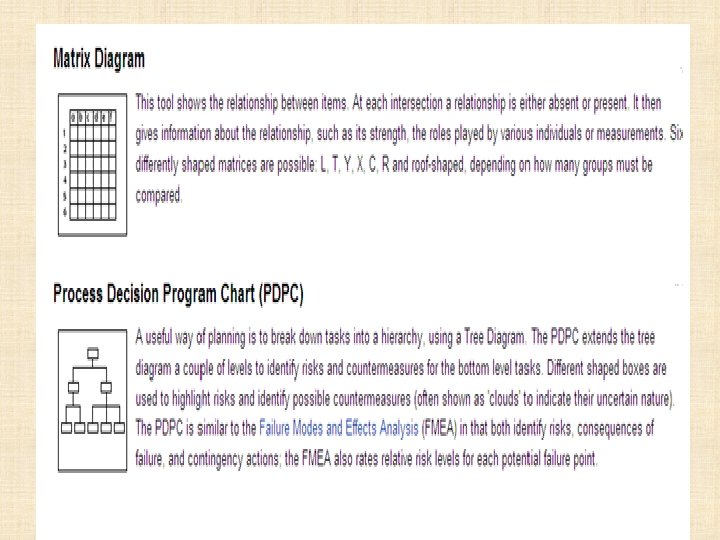
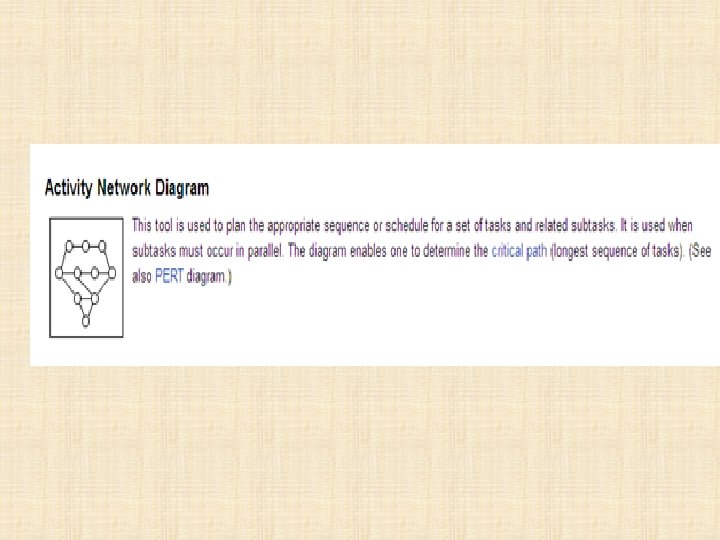
7 New QC Tools