q Chapter 2 Signals and Spectra This chapter


에 의한 sinusoidal")


 Rectangular pulse train Figure 2. 1 -7 11")

 1. harmonics of fundamental frequency . 2.")
 Amplitude (b) Phase")


 = A sinc ƒ Figure 2. 2 -2 24")


 RF pulse (b) Amplitude spectrum Figure 2. 3 -3 29")


 37")


")
- Slides: 42
q Chapter 2. Signals and Spectra Ø This chapter reviews one of the two pre-requisites for communications research. v. Signals and Systems v. Probability, Random Variables, and Random Processes Ø We use linear, particularly LTI, systems to develop theory for communications. Ø Outline v 2. 1 Line Spectra and Fourier Series v 2. 2 Fourier Transform and Continuous Spectra v 2. 3 Time and Frequency Relations v 2. 4 Convolution v 2. 5 Impulses and Transforms in the Limit v 2. 6 Discrete Time Signals and the Discrete Fourier Transform 1
o Communication Engineering 통신공학 Step 1. Given a communication medium, we first analyze the channel and build a mathematical model. 주어진 통신 매체에 따라 Channel 을 분석하고 모형을 만든다. Step 2. Using the model, we design the pair of a transmitter and a receiver that best exploits the channel characteristic. Channel 에 가장 효과적 신호처리를 할 수 있도록 Transmitter 와 Receiver를 설계한다. ex) Modulation (변조)과 Demodulation (복조) Encoding 과 Decoding Multiplexing 과 Demultiplexing 2
o Mathematical Tool for Signal Processing: Fourier Analysis time domain frequency domain analysis, synthesis, design q 2. 1 Line Spectra and Fourier Series o Linear Time-Invariant system 3
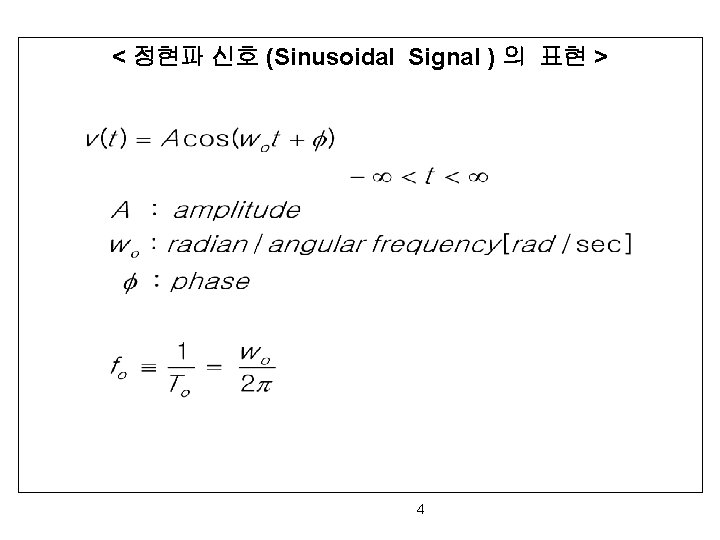
Line spectrum of periodic signals Amplitude A phase 복소지수 (Complex exponential)에 의한 sinusoidal wave정현파 신호 의 표현 복소수? Euler’s theorem/identity 6
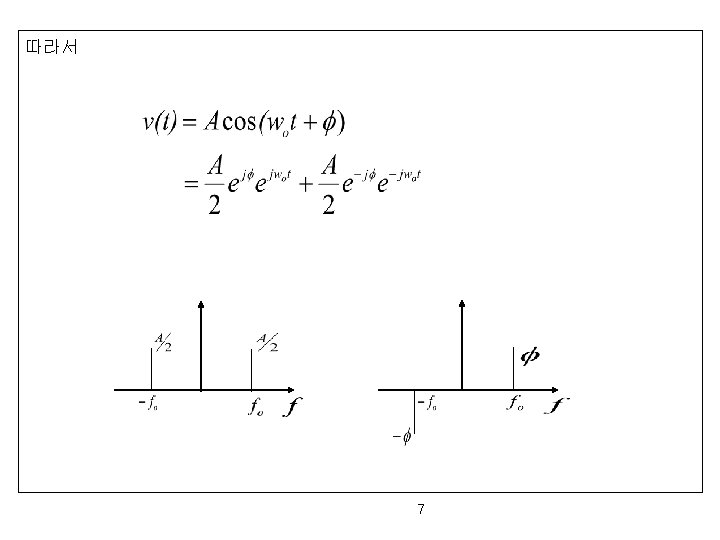
Phasor를 이용한 정현파 신호의 표현 허수축 실수축 Phasor representation is useful when sinusoidal signal is processed by real-in real-out LTI systems. 8
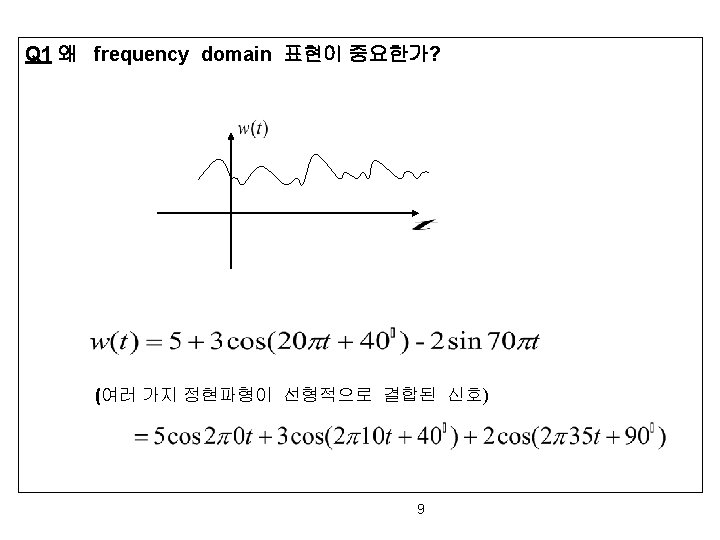
A 1 Line Spectrum Phase Amplitude 90 5 3 0 10 40 2 0 35 10 35 Frequency content “왜 Phase는 Amplitude보다 덜 중요한가? (phase time delay ) “모든 주기적 신호는 정현파 신호의 선형적 결합으로 표현될 수 있다. ” 10
o Periodic Signals (주기 신호) Rectangular pulse train Figure 2. 1 -7 11
o Fourier Series 어떠한 periodic signal 정현파 신호의 선형적 집합 Where Phasor표현 two-sided line spectrum 12
주기함수의 주파수 특성 (Spectrum of periodic signals) 1. harmonics of fundamental frequency . 2. 3. 실함수 는 13
Spectrum of rectangular pulse train with ƒ 0 = 1/4 (a) Amplitude (b) Phase Figure 2. 1 -8 14
trigonometric Fourier series for real signals 매우 중요한 함수 15
Fourier-series reconstruction of a rectangular pulse train Figure 2. 1 -9 16
Fourier-series reconstruction of a rectangular pulse train Figure 2. 1 -9 c 17
Gibbs phenomenon at a step discontinuity Figure 2. 1 -10 18
Average Power of Periodic Signal 19
Ø Parseval’s Power Theorem 20
q 2. 2 Fourier Transforms and Continuous Spectra Ø Fourier Transform 비주기 신호 or Energy signal Definition called the analysis equation. 21
Ø Inverse Fourier Transform called the synthesis equation. 22
Ex 1 Rectangular pulse 23
Rectangular pulse spectrum V(ƒ) = A sinc ƒ Figure 2. 2 -2 24
Ø Rayleigh’s Energy Theorem Generally Also called Parseval’s relation/theorem. 25
Ø Duality Theorem 26
q 2. 3 Time and Frequency Relations Ø Superposition Property useful tool for linear systems Ø Time Delay linear phase Ø Time Scale Change Slow Playback Fast Playback Low Tone High Tone 27
Ø Frequency Translation/Shift and Modulation 28
continued (a) RF pulse (b) Amplitude spectrum Figure 2. 3 -3 29
Ø Differentiation and Integration Principle of FM demodulator differentiator In general Example. Triangular pulse 30
q 2. 4 Convolution Ø Convolution Integral Graphical interpretation of convolution Figure 2. 4 -1 31
Result of the convolution in Fig. 2. 4 -1 Figure 2. 4 -2 In general, convolution is a complicated operation in the TD. 32
Ø Convolution Theorems 33
q 2. 5 Impulses and Transforms in the Limit Ø Dirac delta function Thus 34
Two functions that become impulses as 0 Figure 2. 5 -2 35
Properties 36
Ø 실제적 함수 (Practical Impulses) 37
Ø Fourier Transform of Power Signals infinite energy 38
Ø From Fourier Series , Other periodic signals 39
q 2. 6 Discrete Time Signals and Discrete Fourier Transform Ø DT signal Ø DT periodic signal and DFTS v. Analysis equation v. Synthesis equation Ø DFT, IDFT v. Periodic extension and Fourier Series Ø DTFT v. Analysis equation v. Synthesis equation 40
Ø Convolution using the DFT v. Q. We are given a convolution sum of two finite-length DT signals. Each signal has support N_1, N_2. Find the finitelength (at most N_1+N_2 -1) output of the convolution using DFT. v. A. Choose N>= N_1+N_2 -1. Compute DFT(x) and DFT(h). Perform entry-by-entry multiplication. Apply the inverse DFT. Done. 41
q HW #1 (Due on Next Tuesday 9/22. Please turn in handwritten solutions. ) Ø 2. 7 Questions v 3 v 4 v 6 v 2. 1 -9, 13 v 2. 2 -7, 10 v 2. 3 -8, 14 v 2. 4 -8, 15 v 2. 5 -10 v 2. 6 -4, 6 42