Principles of Epidemiology Dona Schneider Ph D MPH

- Slides: 45
Principles of Epidemiology Dona Schneider, Ph. D, MPH, FACE
Epidemiology Defined n Epi + demos + logos = “that which befalls man” n The study of the distribution and determinants of disease frequency in human populations (Mac. Mahon and Pugh, 1970) Epidemiology (Schneider)
Epidemiology Defined n The study of the distribution and determinants of health-related states or events in specified populations and the application of this study to the control of health problems (John Last, 1988) Epidemiology (Schneider)
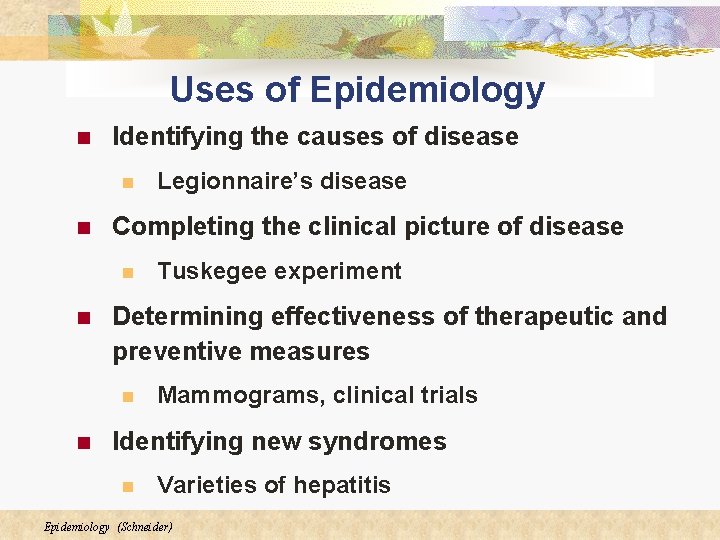
Uses of Epidemiology n Identifying the causes of disease n n Completing the clinical picture of disease n n Tuskegee experiment Determining effectiveness of therapeutic and preventive measures n n Legionnaire’s disease Mammograms, clinical trials Identifying new syndromes n Varieties of hepatitis Epidemiology (Schneider)
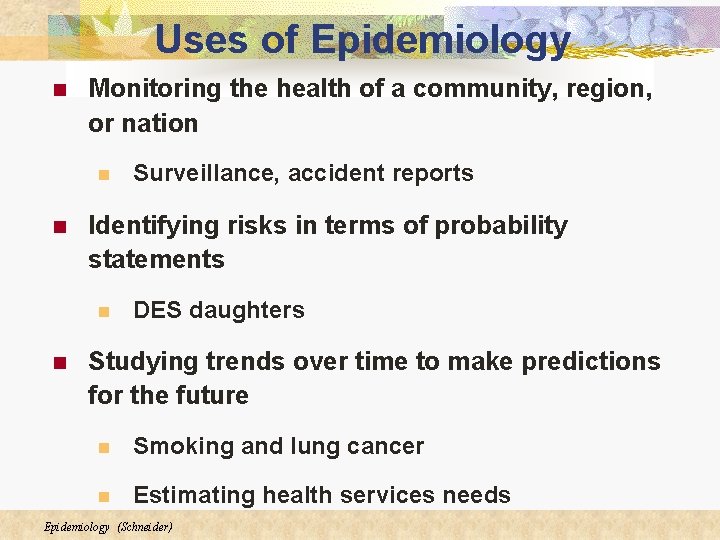
Uses of Epidemiology n Monitoring the health of a community, region, or nation n n Identifying risks in terms of probability statements n n Surveillance, accident reports DES daughters Studying trends over time to make predictions for the future n Smoking and lung cancer n Estimating health services needs Epidemiology (Schneider)
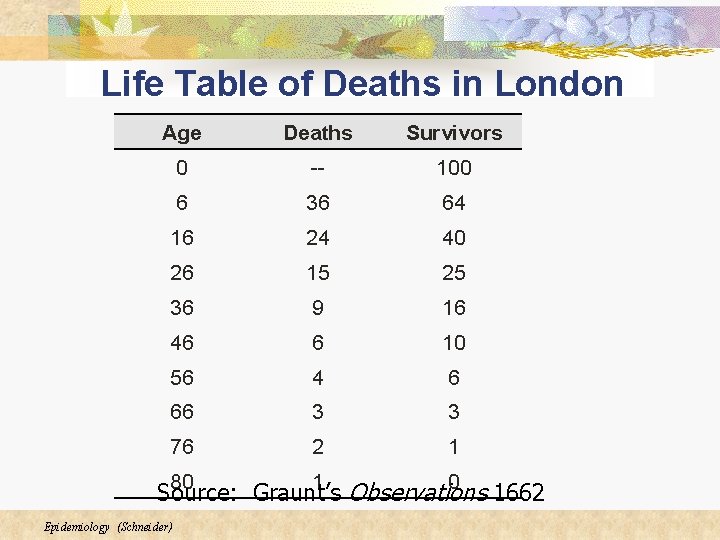
Life Table of Deaths in London Age Deaths Survivors 0 -- 100 6 36 64 16 24 40 26 15 25 36 9 16 46 6 10 56 4 6 66 3 3 76 2 1 80 1 0 Source: Graunt’s Observations 1662 Epidemiology (Schneider)
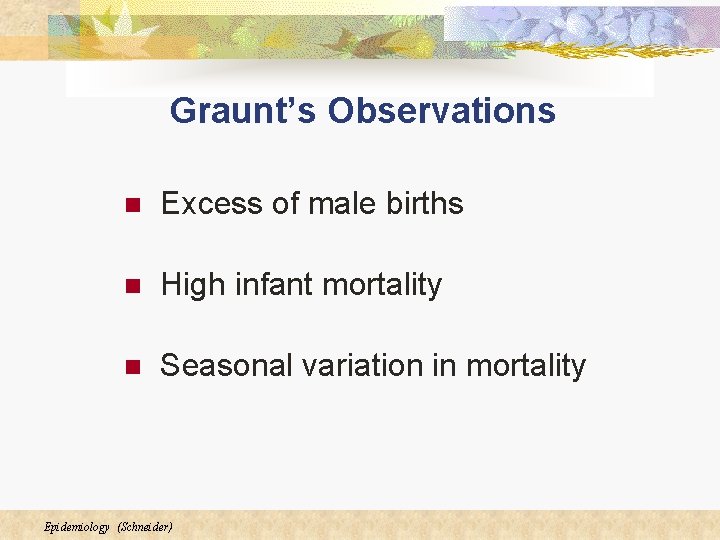
Graunt’s Observations n Excess of male births n High infant mortality n Seasonal variation in mortality Epidemiology (Schneider)
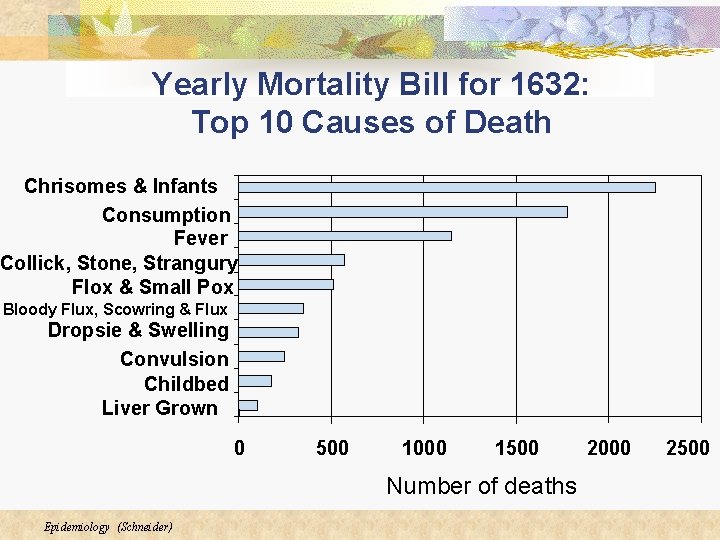
Yearly Mortality Bill for 1632: Top 10 Causes of Death Chrisomes & Infants Consumption Fever Collick, Stone, Strangury Flox & Small Pox Bloody Flux, Scowring & Flux Dropsie & Swelling Convulsion Childbed Liver Grown 0 500 1000 1500 Number of deaths Epidemiology (Schneider) 2000 2500
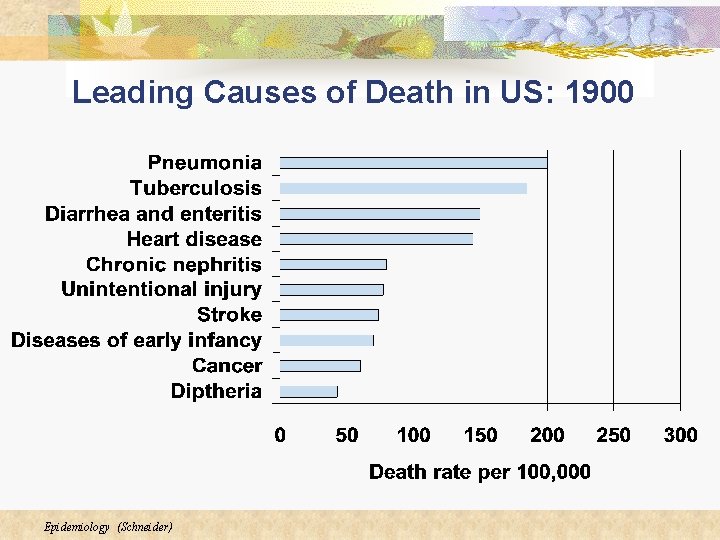
Leading Causes of Death in US: 1900 Epidemiology (Schneider)
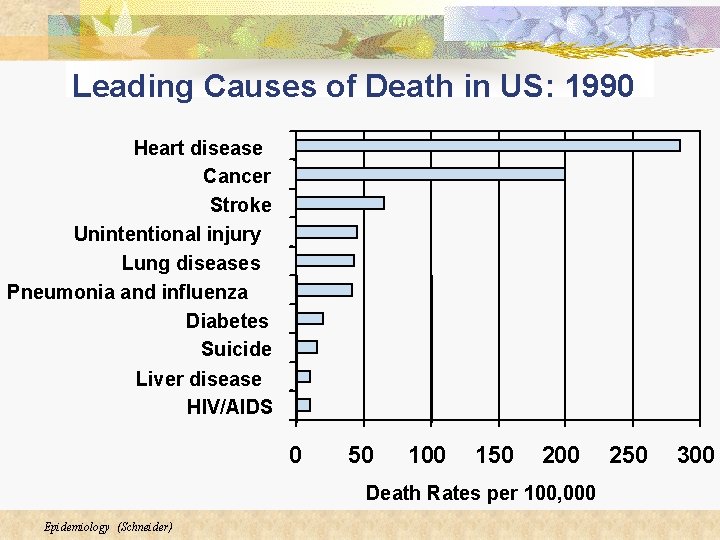
Leading Causes of Death in US: 1990 Heart disease Cancer Stroke Unintentional injury Lung diseases Pneumonia and influenza Diabetes Suicide Liver disease HIV/AIDS 0 50 100 150 200 Death Rates per 100, 000 Epidemiology (Schneider) 250 300
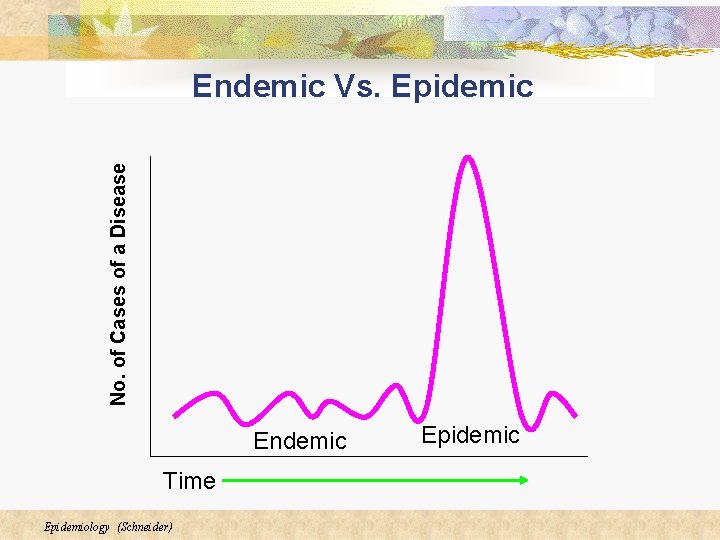
No. of Cases of a Disease Endemic Vs. Epidemic Endemic Time Epidemiology (Schneider) Epidemic
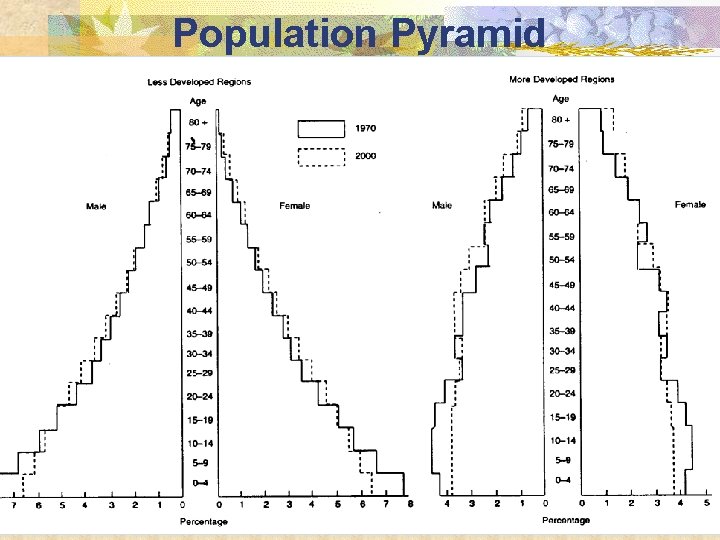
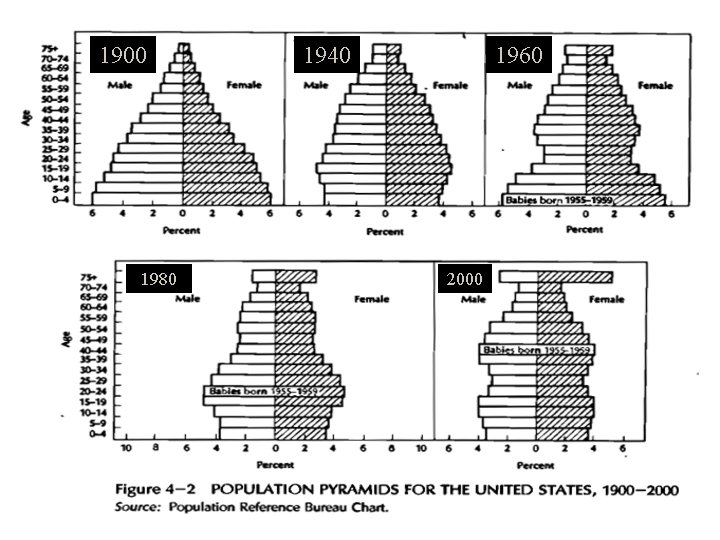
Population Pyramid Epidemiology (Schneider)
1900 1980 Epidemiology (Schneider) 1940 1960 2000
Statistics n Statistics: A branch of applied mathematics which utilizes procedures for condensing, describing, analyzing and interpreting sets of information n Biostatistics: A subset of statistics used to handle health-relevant information Epidemiology (Schneider)
Statistics (cont. ) n n Descriptive statistics: Methods of producing quantitative summaries of information n Measures of central tendency n Measures of dispersion Inferential statistics: Methods of making generalizations about a larger group based on information about a subset (sample) of that group Epidemiology (Schneider)
Populations and Samples n Before we can determine what statistical test to use, we need to know if our information represents a population or a sample n A sample is a subset which should be representative of a population Epidemiology (Schneider)
Samples n A sample should be representative if selected randomly (i. e. , each data point should have the same chance for selection as every other point) n In some cases, the sample may be stratified but then randomized within the strata Epidemiology (Schneider)
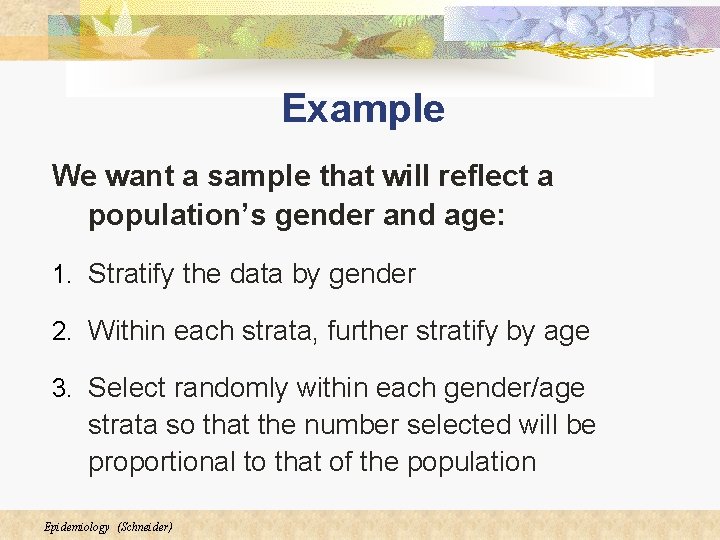
Example We want a sample that will reflect a population’s gender and age: 1. Stratify the data by gender 2. Within each strata, further stratify by age 3. Select randomly within each gender/age strata so that the number selected will be proportional to that of the population Epidemiology (Schneider)
Populations and Samples n You can tell if you are looking at statistics on a population or a sample n Greek letters stand for population parameters (unknown but fixed) n Arabic letters stand for statistics (known but random) Epidemiology (Schneider)
Classification of Data Qualitative or Quantitative n Qualitative: non-numeric or categorical n n Examples: gender, race/ethnicity Quantitative: numeric n Examples: age, temperature, blood pressure Epidemiology (Schneider)
Classification of Data Discrete or Continuous n Discrete: having a fixed number of values n n Examples: marital status, blood type, number of children Continuous: having an infinite number of values n Examples: height, weight, temperature Epidemiology (Schneider)
Hint n Qualitative (categorical) data are discrete n Quantitative (numerical) data may be n discrete n continuous Epidemiology (Schneider)
Qualitative Data: Nominal n Data which fall into mutually exclusive categories (discrete) for which there is no natural order n Examples: n Race/ethnicity n Gender n Marital status n ICD-10 codes n Dichotomous data such as HIV+ or HIV-; yes or no Epidemiology (Schneider)
Qualitative Data: Ordinal n Data which fall into mutually exclusive categories (discrete data) which have a rank or graded order n Examples: n Grades n Socioeconomic status n Stage of disease n Low, medium, high Epidemiology (Schneider)
Quantitative Data: Interval n Data which are measured by standard units n The scale measures not only that one data point is different than another, but by how much n Examples n Number of days since onset of illness (discrete) n Temperature in Fahrenheit or Celsius (continuous) Epidemiology (Schneider)
Quantitative Data: Ratio n Data which are measured in standard units where a true zero represents total absence of that unit n Examples n Number of children (discrete) n Temperature in Kelvin (continuous) Epidemiology (Schneider)
Review of Descriptive Biostatistics n Mean n Median n Mode and range n Variance and standard deviation n Frequency distributions n Histograms Epidemiology (Schneider)
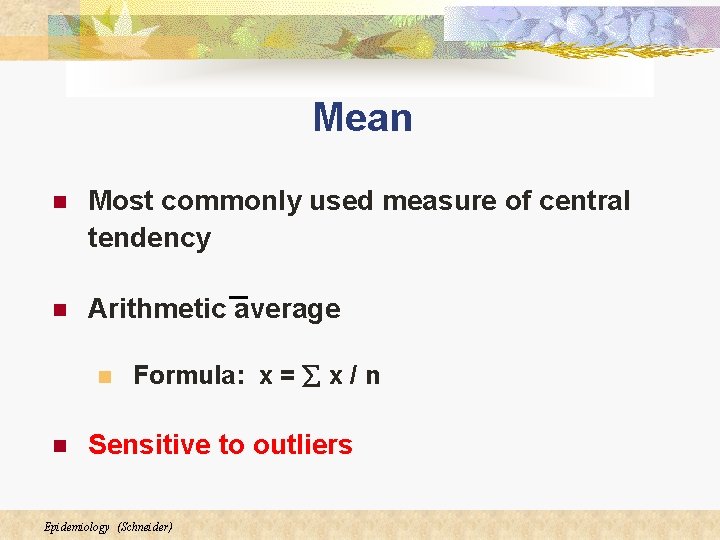
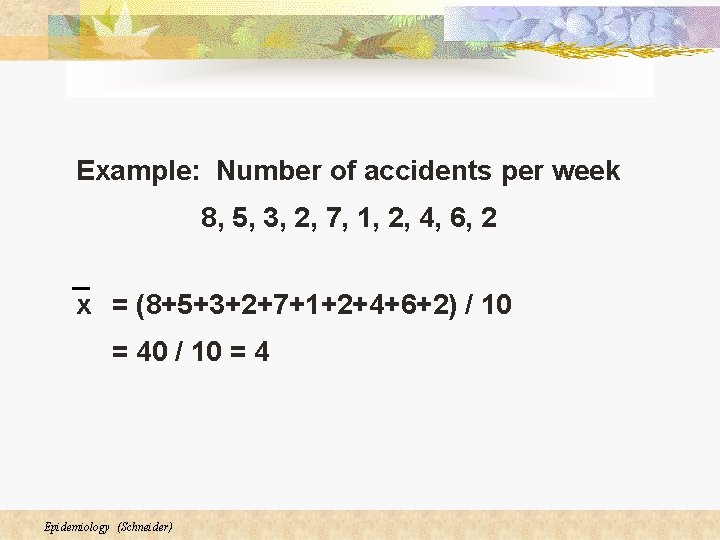
Mean n Most commonly used measure of central tendency n Arithmetic average n n Formula: x = x / n Sensitive to outliers Epidemiology (Schneider)
Example: Number of accidents per week 8, 5, 3, 2, 7, 1, 2, 4, 6, 2 x = (8+5+3+2+7+1+2+4+6+2) / 10 = 40 / 10 = 4 Epidemiology (Schneider)
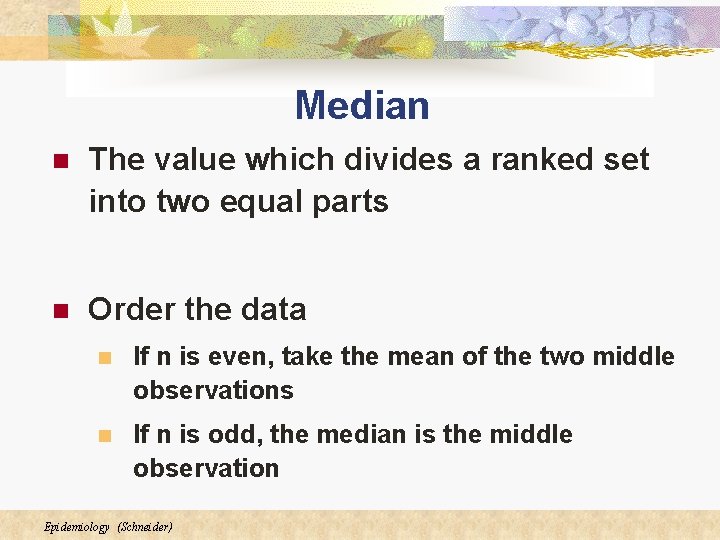
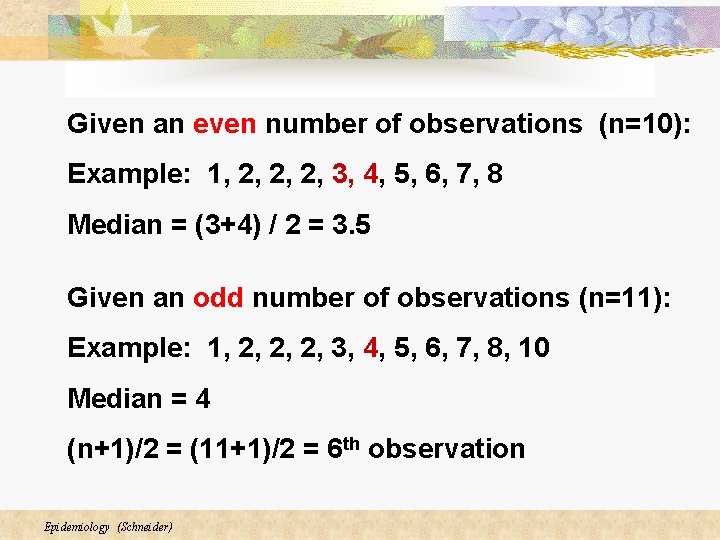
Median n The value which divides a ranked set into two equal parts n Order the data n If n is even, take the mean of the two middle observations n If n is odd, the median is the middle observation Epidemiology (Schneider)
Given an even number of observations (n=10): Example: 1, 2, 2, 2, 3, 4, 5, 6, 7, 8 Median = (3+4) / 2 = 3. 5 Given an odd number of observations (n=11): Example: 1, 2, 2, 2, 3, 4, 5, 6, 7, 8, 10 Median = 4 (n+1)/2 = (11+1)/2 = 6 th observation Epidemiology (Schneider)
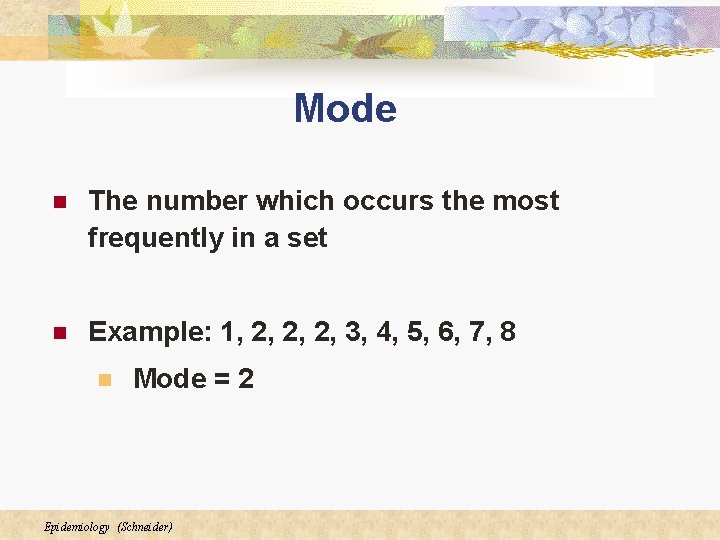
Mode n The number which occurs the most frequently in a set n Example: 1, 2, 2, 2, 3, 4, 5, 6, 7, 8 n Mode = 2 Epidemiology (Schneider)
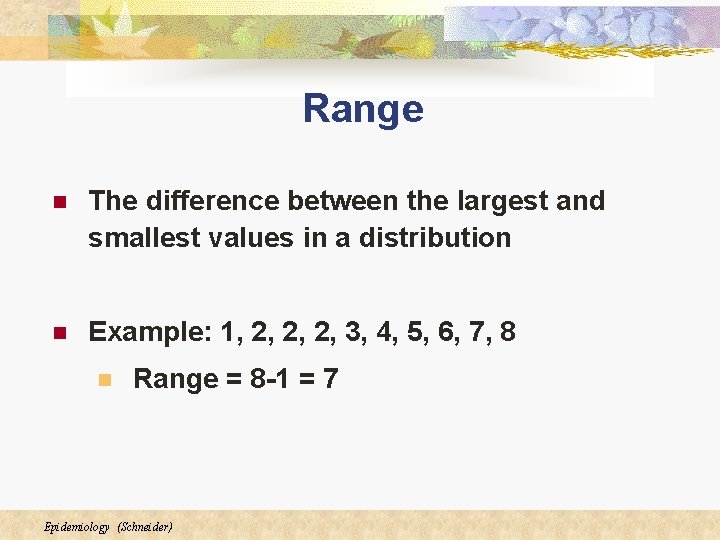
Range n The difference between the largest and smallest values in a distribution n Example: 1, 2, 2, 2, 3, 4, 5, 6, 7, 8 n Range = 8 -1 = 7 Epidemiology (Schneider)
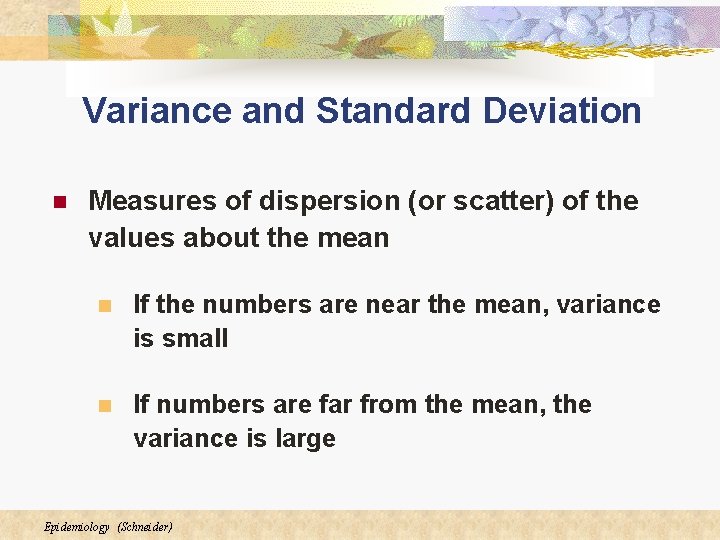
Variance and Standard Deviation n Measures of dispersion (or scatter) of the values about the mean n If the numbers are near the mean, variance is small n If numbers are far from the mean, the variance is large Epidemiology (Schneider)
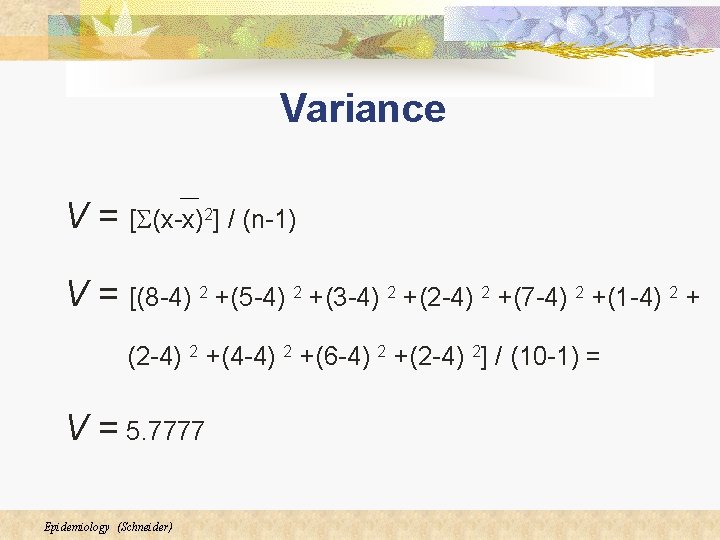
Variance V = [S(x-x)2] / (n-1) V = [(8 -4) 2 +(5 -4) 2 +(3 -4) 2 +(2 -4) 2 +(7 -4) 2 +(1 -4) 2 + (2 -4) 2 +(4 -4) 2 +(6 -4) 2 +(2 -4) 2] / (10 -1) = V = 5. 7777 Epidemiology (Schneider)
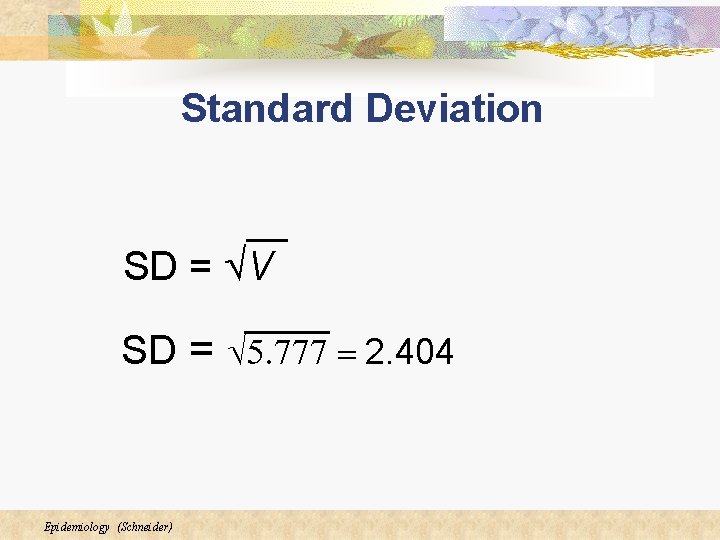
Standard Deviation SD = ÖV SD = Ö 5. 777 = 2. 404 Epidemiology (Schneider)
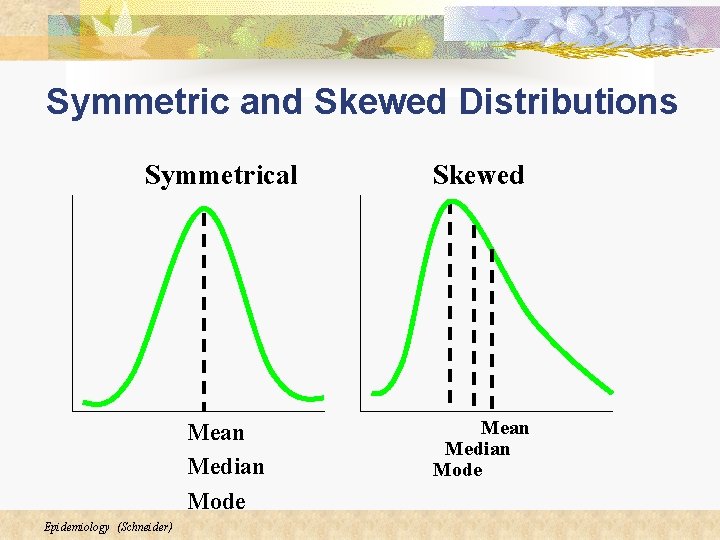
Symmetric and Skewed Distributions Symmetrical Skewed Mean Median Mode Epidemiology (Schneider)
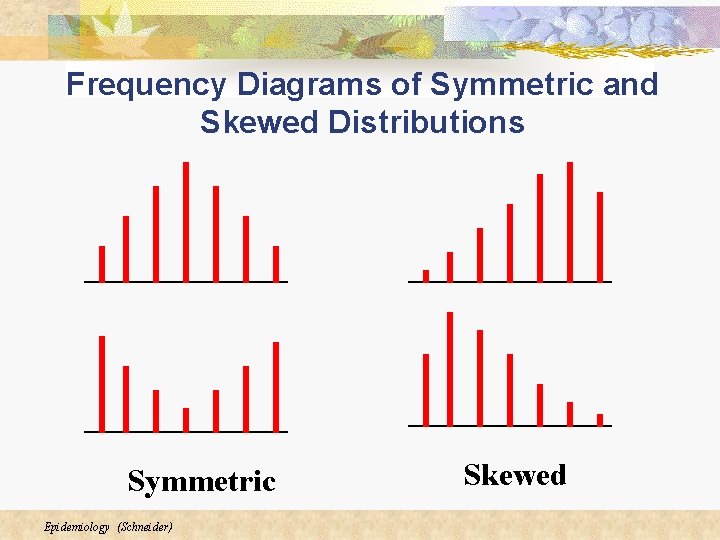
Frequency Diagrams of Symmetric and Skewed Distributions Symmetric Epidemiology (Schneider) Skewed
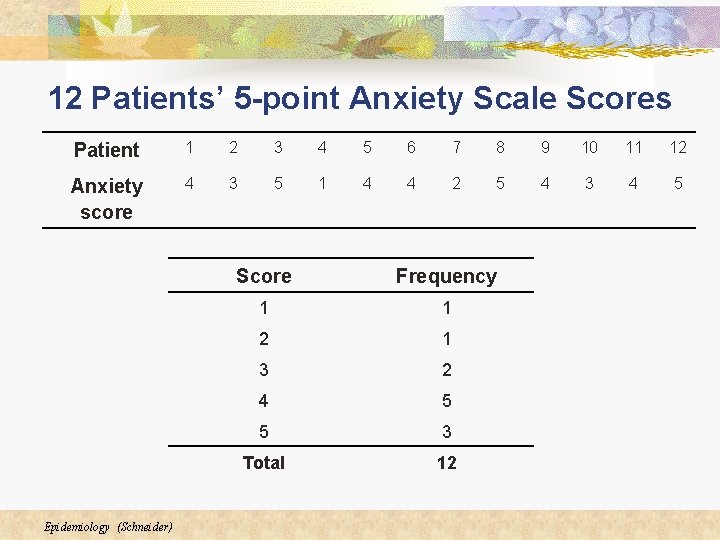
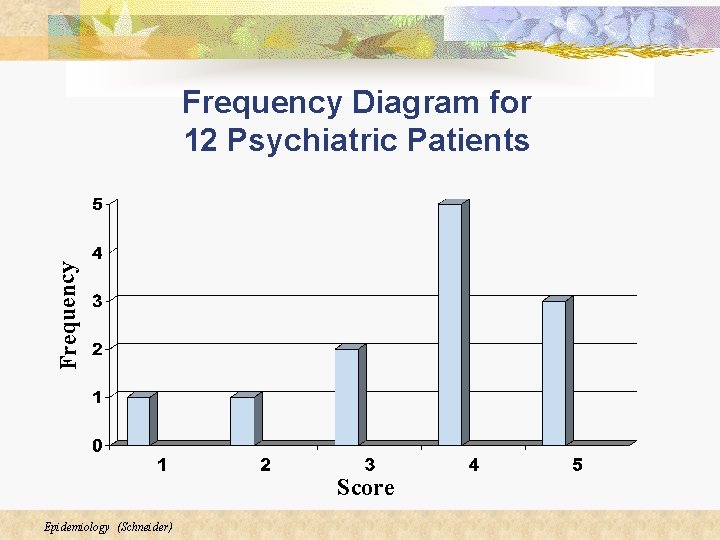
12 Patients’ 5 -point Anxiety Scale Scores Patient 1 2 3 4 5 6 7 8 9 10 11 12 Anxiety score 4 3 5 1 4 4 2 5 4 3 4 5 Epidemiology (Schneider) Score Frequency 1 1 2 1 3 2 4 5 5 3 Total 12
Frequency Diagram for 12 Psychiatric Patients Score Epidemiology (Schneider)
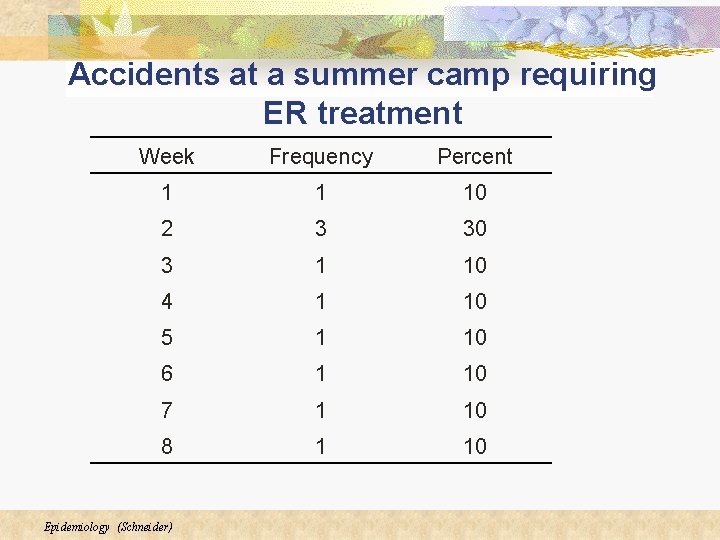
Accidents at a summer camp requiring ER treatment Week Frequency Percent 1 1 10 2 3 30 3 1 10 4 1 10 5 1 10 6 1 10 7 1 10 8 1 10 Epidemiology (Schneider)
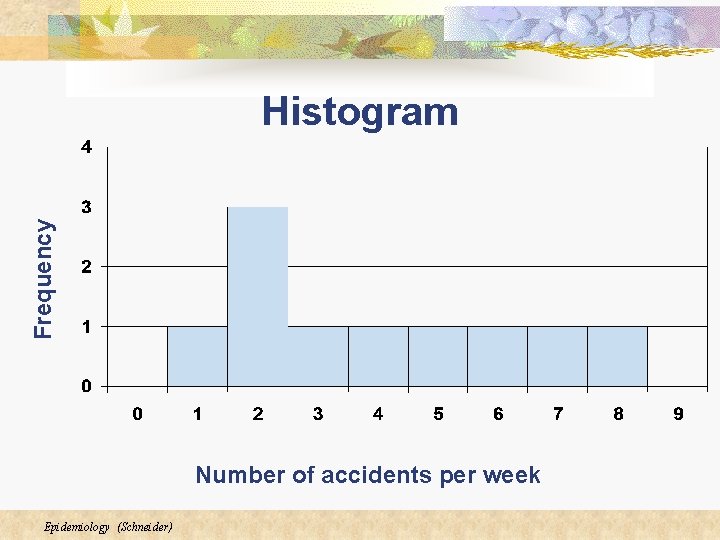
Frequency Histogram Number of accidents per week Epidemiology (Schneider)
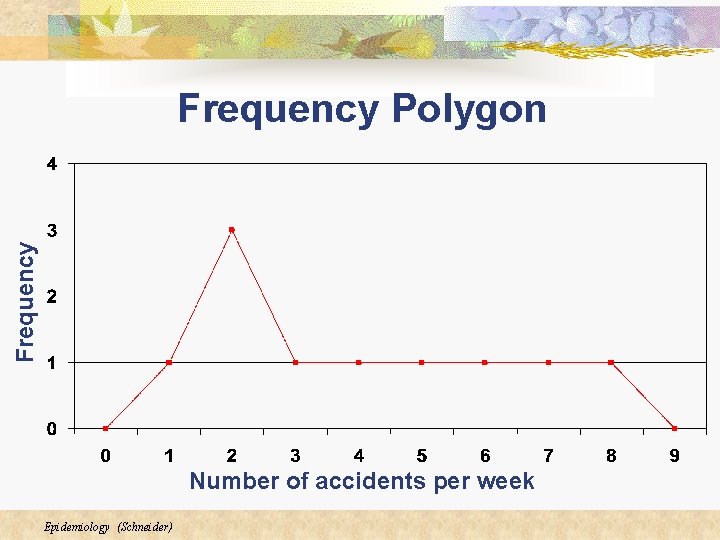
Frequency Polygon Number of accidents per week Epidemiology (Schneider)
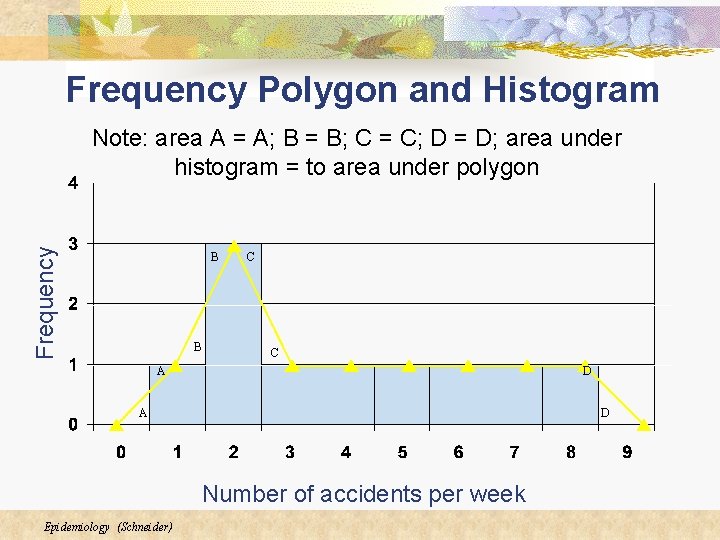
Frequency Polygon and Histogram Frequency Note: area A = A; B = B; C = C; D = D; area under histogram = to area under polygon B B C C A D Number of accidents per week Epidemiology (Schneider)
Descriptive Statistics n Used as a first step to look at health-related outcomes n Examine numbers of cases to identify an increase (epidemic) n Examine patterns of cases to see who gets sick (demographic variables) and where and when they get sick (space/time variables) Epidemiology (Schneider)