Time Distance Speed Relationships distance speed 40 mph


 = ft/sec 44. 1 ft/sec")

 d = 1. 47 S t d")


")
")
")


")
")


 distance: the distance it takes for the vehicle to steer away")


 RATHER THAN 55 MPH HOW")
 RATHER THAN 55 MPH HOW")

 RATHER THAN 55 MPH HE")


- Slides: 87
Time – Distance – Speed Relationships
distance _______ speed 40 mph time 2. 5 hrs
distance 100 miles speed 40 mph d = S t time 2. 5 hrs
distance speed time 130 miles 65 mph ____
distance speed time 130 miles 65 mph 2 hr t = d/S
distance speed time 90 miles ______ 3 hrs
distance speed time 90 miles 30 mph 3 hrs S = d/t
Constant speed: d = St d t = ----S d S = -------t
But in collision reconstruction it’s a little more complicated: SECONDS – FEET – MPH ?
1 mile ----- = 1 hour
1 mile 5280 ft ----- = ------1 hour 3600 sec
1 mile 5280 ft ----- = ------- = 1. 4666… 1 hour 3600 sec
1 mile 5280 ft ----- = ------- = 1. 4666… 1 hour 3600 sec I use 1. 47
mph multiple by 1. 47 30 mph (1. 47) = ft/sec 44. 1 ft/sec
ft/sec divide by 1. 47 103 ft/sec ÷ 1. 47 = mph 70 mph
Constant speed: ( speed in mph ) d = 1. 47 S t d t = 1. 47 S d S = 1. 47 t
APPLICATIONS
Collision Avoidance d Sw
Time for pedestrian to reach POI d tw = d / 1. 47 Sw Sw
Backing the Car tw seconds
Backing the Car tw seconds d Sc d = 1. 47 Sc tw
Start of Collision
Start of Collision Can the impact be avoided?
PHASES IN IMPACT AVOIDANCE dr REACTION da VEHICLE AVOIDANCE
The PRT process (and impairment)
The PRT process (and impairment)
The PRT process (and impairment)
Recognition may not be as simple as you think!
Jim Sobek Clearly Visible Presentations, LLC
Jim Sobek Clearly Visible Presentations, LLC
The PRT process (and impairment)
The PRT process (and impairment)
PRT is a statistical concept ! “There is no such thing as the human perception-reaction time. ” Dr. Marc Green visualexpert. com
1. 5 seconds “. . . is a good upper bound estimate, meaning that a substantial percentage (i. e. 85% to 95%) of reasonably alert drivers will respond within 1. 5 seconds. ” Paul L. Olson
1. 78 sec 1. 50 sec 1. 46 sec 1. 40 sec 1. 32 sec 1. 20 sec 1. 04 sec 0. 92 sec 0. 86 sec 0. 74 sec 90 th percentile value
2. 5 seconds “. . . large enough to include the time taken by nearly all (90% of all) drivers under most highway conditions. ” AASHTO Policy on Design Standards for Highways
How would you perform in a PRT test?
What is a reasonable RANGE of PRT values?
“The probable range of perceptionresponse times for reasonably straightforward situations should be 0. 75 to about 1. 5 seconds. ” Paul L. Olson, Forensic Aspects of Driver Perception and Response, 1996, p. 187
WAS THE COLLISION AVOIDABLE? COULD THE COLLISION BE AVOIDED BY A SOBER DRIVER OPERATING AT THE POSTED SPEED ?
reaction distance: the distance the vehicle moves during the operator’s PRT d = 1. 47 S t
speed from skid marks braking distance
braking distance: the distance it takes for the brakes to stop the vehicle dr db
TOTAL STOPPING DISTANCE dr ds = 1. 47 St ++ db
TOTAL STOPPING DISTANCE 30 mph, sober 50 mph, impaired 106 ft 243 ft
turn away (swerve) distance: the distance it takes for the vehicle to steer away from the pedestrian d. TA = 0. 366 S √ L / f
TOTAL TURN AWAY DISTANCE dr db d. TA = 1. 47 St + 0. 366 S √ L / f
TOTAL TURN AWAY DISTANCE 30 mph, sober 50 mph, impaired 79 ft 153 ft
Speed estimate from video S = d / 1. 47 t
State v. Farner first possible perception @ - 160 ft S = 29 mph
160 ft S = 29 mph How much time was there to react ?
160 ft S = 29 mph How much time was there to react ?
Crossing center line: Did victim have enough time to initiate an evasive action ?
CROSSING CENTER LINE
Police report concludes that defendant vehicle, traveling at 40 mph, crossed center line. Victim tried to avoid collision by turning away. 20 o
Did victim have enough time to react, and turn away ? 40 mph 20 o d = 38 ft
Did victim have enough time to react, and turn away ? 40 mph 20 o d = 38 ft
Did victim have enough time to react, and turn away ? 40 mph 20 o d = 38 ft
Did victim have enough time to react, and turn away ? 20 o d = 38 ft t =. 64 sec
DEFENSE: BLAME THE PEDESTRIAN
Police assume a walking speed of 4 ft/sec 4 ft/s
Please draw a vehicle traveling Eastbound.
Draw dashed lines showing the path of the vehicle.
Draw the pedestrian 4 ft from the POI 4 ft
Is the collision avoidable ? 4 ft/s
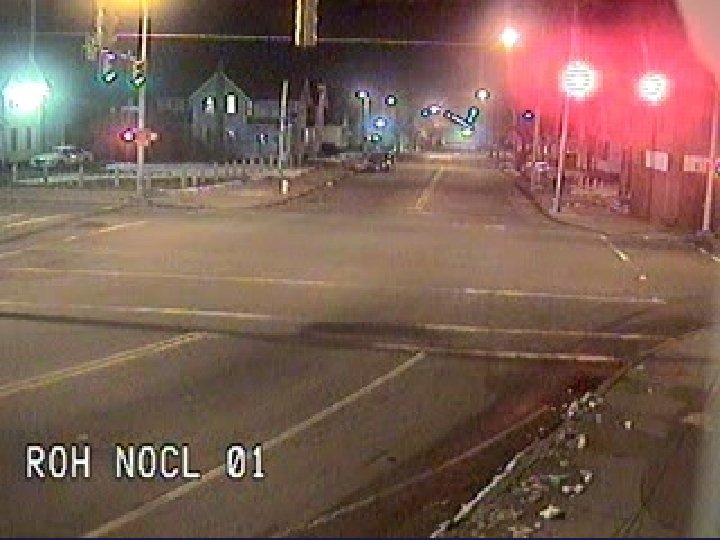
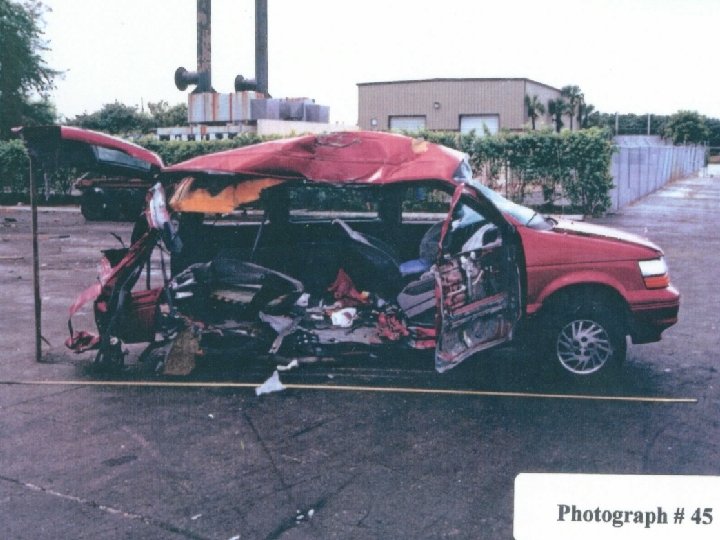
FL v. SCOTT NAIDUS • NAIDUS CHARGED - DWI HOMICIDE • ALEXANDER VEHICLE – THREE CHILDREN KILLED – MOTHER KILLED – VEFICLE MAKING LEFT TURN
CROSS EXAMINING THE DEFENSE ANIMATION SOMETIMES THE DEFENSE EXPERT DOES THE PROSECUTOR A FAVOR BY GENERATING A VIDEO ANIMATION
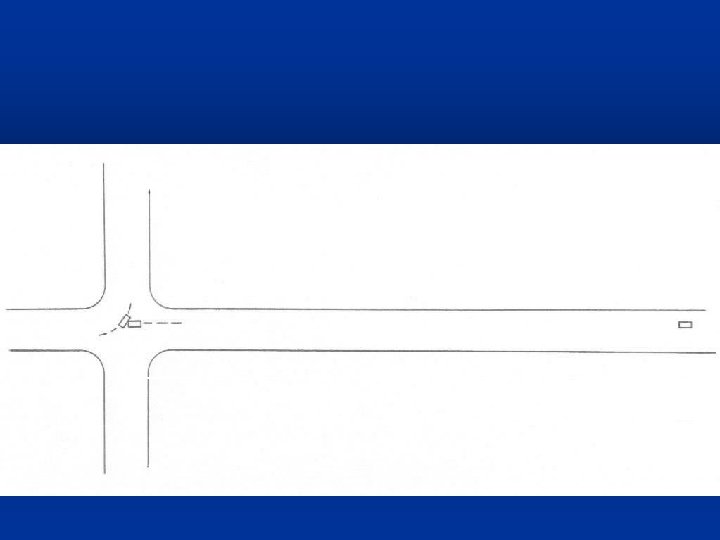
DEFENSE ANIMATION DEFENDANT VEHICLE SPEED = 55 MPH VICTIM VEHICLE SPEED = 15 MPH DEFENSE ANIMATION STARTS 9. 5 SECONDS PRIOR TO IMPACT
Locking the expert in : • • Speed of Naidus vehicle at all times Time from start of video to POI Lack of pre-impact braking Speed of turning vehicle Posted speed Naidus’ ability to control speed No mechanical defect
HOW FAR WAS DEFENDANT’S VEHICLE FROM POI WHEN ANIMATION STARTS ? d = 1. 47(55)(9. 5) = 768 FT
768 ft
IF DEFENDANT WERE TRAVELING AT 45 MPH (POSTED SPEED) RATHER THAN 55 MPH HOW MUCH TIME WOULD IT TAKE DEFENDANT’S VEHICLE TO TRAVEL 768 ft ? t = d / 1. 47 S
IF DEFENDANT WERE TRAVELING AT 45 MPH (POSTED SPEED) RATHER THAN 55 MPH HOW MUCH TIME WOULD IT TAKE DEFENDANT’S VEHICLE TO TRAVEL 768 ft ? t = 768 / 1. 47(45) = 11. 6 SECONDS
11. 6 sec
IF DEFENDANT WERE TRAVELING AT 45 MPH (POSTED SPEED) RATHER THAN 55 MPH HE WOULD HAVE REACHED THE POI 2. 1 SECONDS LATER THAN HE DID. CORRECT ? YES
IF DEFENDANT VEHICLE REACHED THE POI 2. 1 SECONDS LATER, WHERE WOULD VICTIM’S VEHICLE HAVE BEEN ? d = 1. 47(15)(2. 1) = 46 ft CLEAR OF THE INTERSECTION
IF DEFENDANT HAD BEEN OPERATING AT THE POSTED SPEED OF 45 MPH WOULD THERE HAVE BEEN A CRASH ? NO
Using T-D-S to Show a Hypothetical
I can contact JBK at 413 -589 -0793 or kwasnoski@aol. com Ava Jerome
. More than 1, 100 subscribers. Ideal for trial preparation. On-demand Video Training