Piecing Together A More Prosperous Future Nash County


")


 Director’s advisory committee 2) Social media/digital")
 Small business portal 19)")

- Slides: 64
Piecing Together A More Prosperous Future Nash County Economic Development Strategic Action Plan
Piecing Together A More Prosperous Future Nash County Economic Development Strategic Action Plan q. Local stakeholder input through interviews and focus groups q. Research q 3 -year strategic action agenda, with 27 recommendations Economic Overview Organizational Capacity Assessment Workforce Analysis Nash County Economic Development Targeted Industry Analysis Incentive Policy Review Housing Analysis
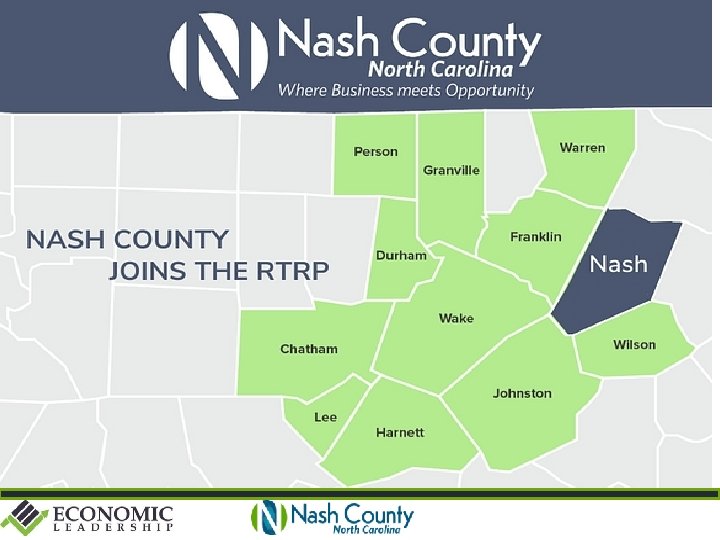
Economic Overview Stakeholders believed that the County had many product strengths including the Mid. Atlantic location, proximity to the core of the Research Triangle Region, very good transportation infrastructure, responsive training capacity and good health care. Areas identified for improvement that were most often mentioned were broadband infrastructure, the lack of natural gas, water and sewer capacity in some business locations, crime, school performance, and community or county image.
120 000 Nash County Population 100 000 80 000 77 171 87 703 95 840 93 966 94 064 67 153 60 000 40 000 20 000 0 1980 1990 2000 2019 2024 Source: U. S. Census Bureau
Nash County Largest Industries Source: EMSI 2020. 3
Nash County Largest Industries Source: EMSI 2020. 3
Foundations for Local Competitiveness Area Development 34 th Annual Top Factors for Investment Decisions Survey Workforce Business Climate Infrastructure 1. Highway accessibility 2. Availability of skilled labor 3. Labor costs 4. Quality of life 5. Occupancy costs 6. Corporate tax rate 7. Energy availability & costs 8. Tax exemptions 9. Environmental Regulations 10. Proximity to Major Markets 11. Right to Work State 12. Available Buildings
Top Factors for Location Decisions 1. Availability of Skilled Workers 2. Competitive Labor Costs 3. Availability of Sites/Buildings 4. Business-friendly Government 5. Strong Quality of Life 6. Efficient Transportation Systems 7. Competitive Incentives Source: Development Counsellors International
Workforce Analysis © Economic Leadership
Nash County & NC Educational Attainment 50% 40% 34% 26% 30% 20% 39% 16% 14% 29% 21% 10% 0% Less than High School Diploma Nash County Some college, no AA degree or More degree North Carolina Source: EMSI 2020. 3
Nash County 2019 Jobs by Education Required AA or more 21% Postsecondary, no degree 9% High school or less 70% Source: EMSI 2020. 3
Nash County Labor Shed 2019 Nash County Labor Force 43, 739, low 56% Participation Rate 45 Minute Drive Time Labor Force 132, 727 45 Mile Drive Time Labor Force 1, 032, 048 Source: EMSI 2020. 3
Nash County Largest Occupations Source: EMSI 2020. 3
Nash Co. Fastest Growing Occupations 700 600 2014 -2019 576 500 400 378 300 200 100 0 135 107 106 Transportation Construction Educational Healthcare and Material and Extraction Instruction and Practitioners Moving Library and Technical 80 77 Installation, Community and Personal Care Maintenance, Social Service and Repair 67 41 39 35 Business and Arts, Design, Building and Architecture Financial Entertainment, Grounds and Engineering Operations Sports, and Cleaning and Media Maintenance Source: EMSI 2020. 3
Nash Community College PROGRAMS TOTAL degrees All certificates and certificates 2019 AA Degree 2019 LIBERAL ARTS AND SCIENCES, GENERAL STUDIES AND HUMANITIES 200 22 178 HEALTH PROFESSIONS AND RELATED PROGRAMS CONSTRUCTION TRADES 134 106 54 100 80 6 BUSINESS, MANAGEMENT, MARKETING, AND RELATED SUPPORT SERVICES 65 42 23 HOMELAND SECURITY, LAW ENFORCEMENT, FIREFIGHTING AND RELATED PROTECTIVE SERVICES 65 46 19 ENGINEERING TECHNOLOGIES AND ENGINEERING-RELATED FIELDS 50 35 15 COMPUTER AND INFORMATION SCIENCES AND SUPPORT SERVICES EDUCATION PERSONAL AND CULINARY SERVICES PRECISION PRODUCTION VISUAL AND PERFORMING ARTS ENGINEERING 31 31 29 29 16 11 23 11 19 21 13 0 8 20 10 8 3 11 AGRICULTURE, AGRICULTURE OPERATIONS, AND RELATED SCIENCES 4 3 1 FAMILY AND CONSUMER SCIENCES/HUMAN SCIENCES 3 0 3 MECHANIC AND REPAIR TECHNOLOGIES/TECHNICIANS 3 2 1 COMMUNICATIONS TECHNOLOGIES/TECHNICIANS AND SUPPORT SERVICES 1 1 0 1 779 0 392 1 387 LEGAL PROFESSIONS AND STUDIES TOTAL Source: EMSI 2020. 3
North Carolina Wesleyan College TOTAL degrees BA Degree and certificates 2019 Master's Degree 2019 PROGRAMS BUSINESS, MANAGEMENT, MARKETING, AND RELATED SUPPORT SERVICES 319 0 HOMELAND SECURITY, LAW ENFORCEMENT, FIREFIGHTING AND RELATED PROTECTIVE SERVICES PSYCHOLOGY 92 81 11 MATHEMATICS AND STATISTICS PHYSICAL SCIENCES 77 36 10 10 9 8 7 7 7 6 3 3 3 0 0 0 0 LIBERAL ARTS AND SCIENCES, GENERAL STUDIES AND HUMANITIES 2 2 0 2 1 602 2 1 591 0 0 11 COMPUTER AND INFORMATION SCIENCES AND SUPPORT SERVICES EDUCATION SOCIAL SCIENCES PARKS, RECREATION, LEISURE, AND FITNESS STUDIES BIOLOGICAL AND BIOMEDICAL SCIENCES HEALTH PROFESSIONS AND RELATED PROGRAMS HISTORY PHILOSOPHY AND RELIGIOUS STUDIES ENGLISH LANGUAGE AND LITERATURE/LETTERS COMMUNICATION, JOURNALISM, AND RELATED PROGRAMS VISUAL AND PERFORMING ARTS NATURAL RESOURCES AND CONSERVATION TOTAL Source: EMSI 2020. 3
earned Nash County Public Schools 1, 734 Total CTE Course Completions credentials 2019 Microsoft Office Specialist 2016 Word Microsoft Office Specialist 2016 Power. Point 154 128 Conover Credential Workplace Readiness Module 00104 (with Performance Profile) Module 00107 (with Performance Profile) CPR/AED Module 00109 (with Performance Profile) Module 00105 (with Performance Profile) Module 00101 (with Performance Profile) Module 00103 (with Performance Profile) Module 00108 (with Performance Profile) Module 00102 Module 70101 NIMS (DHS/FEMA) IS-700 81 79 77 73 70 69 69 68 68 65 64 44 NIMS (DHS/FEMA) IS-100 ANSI Approved Certified Food Protection Manager North Carolina Nurse Aide 1 NIMS (DHS/FEMA) IS-200 NIMS (DHS/FEMA) IS-800 First Aid Microsoft Office Specialist 2016 Excel Core 43 40 39 37 33 31 31 Introduction to Power Tools Basic Communication Introduction to Material Handling Introduction to Construction Drawings Basic Safety Introduction to Hand Tools Basic Employability Skills Introduction to Construction Math Your Role in the Green Environment National Incident Management System, an Introduction to Incident Command System ICS for Single Sources & Initial Action Incidents National Response Framework, an Introduction Source: North Carolina Department of Public Instructions
Target Industry Cluster Analysis Source: US Cluster Mapping
Nash County Cluster Map Asset Clusters Legacy Clusters Emerging Clusters Source: EMSI 2020. 3
Nash Co. Top Traded Clusters by Employment Source: EMSI 2020. 3
Nash County Fastest Growing Clusters Source: EMSI 2020. 3
Clusters with Highest Concentration Source: EMSI 2020. 3
Projected Employment Change 2019 -2024 Source: EMSI 2020. 3
New Investment Prospects Research Triangle Regional Partnership Targeted Industries Agtech Cleantech Life Sciences Advanced manufacturing Technology EDPNC Targeted Industries Aerospace & Defense Automotive Food Processing & Manufacturing Information Technology Biotechnology & Pharmaceuticals Business & Financial Services Corporate Headquarters Furniture Outdoor Recreation Plastics and Chemicals
Nash County Proposed Industry Targets Biopharmaceuticals Value-added Agriculture Technology and Instruments Distribution and E-Commerce Construction Products and Services
Housing Analysis Stakeholder Input The local housing stock was praised for its affordability, but concerns were raised about the lack of new higher-end developments, the proliferation of lower quality rental properties, and the need for good planning in the western part of the county as market pressures increase potential for housing growth.
Nash County Number of Housing Units 45 000 44 500 44 000 43 500 [VALUE] 43 000 42 500 42 000 [VALUE] 41 500 41 000 40 500 40 000 2011 2012 2013 2014 2015 2016 2017 2018 Source: US Census, ACS 5 Yr 2018.
Nash County Housing Type 2018 70% Nash County North Carolina 64, 5% 65, 1% 60% 50% 40% 30% 16, 4% 20% 21, 8% 19, 2% 13, 0% 10% 0% Single Family Multi-Family Mobile Homes Source: US Census, ACS 5 Yr 2018.
Value of Owner-Occupied Units 2018 7 000 22% 5 778 6 000 37% 5 740 41% 5 000 4 064 4 000 Under $100, 000 to $200, 000 Over $200, 000 3 122 3 117 3 000 1 850 2 000 1 000 0 220 Less than $50, 000 to $99, 999 219 $100, 000 to $150, 000 to $200, 000 to $300, 000 to $500, 000 to $1, 000 or $149, 999 $199, 999 $299, 999 $499, 999 $999, 999 more Source: US Census, ACS 5 Yr 2018.
Housing Units Built by Year 10 000 Only 22% constructed 2000 or later 8 998 9 000 7 956 8 000 7 249 6 348 6 000 5 000 4 000 2 878 3 000 2 000 1 000 0 521 800 3 466 3 415 1 245 Built 2014 Built 2010 Built 2000 Built 1990 Built 1980 Built 1970 Built 1960 Built 1950 Built 1940 Built 1939 or later to 2013 to 2009 to 1999 to 1989 to 1979 to 1969 to 1959 to 1949 or earlier Source: US Census, ACS 5 Yr 2018.
0 26 17 Source: Nash. County. NC. gov авг-20 21 июл-20 23 июн-20 29 май-20 22 апр-20 21 мар-20 25 фев-20 13 14 янв-20 10 дек-19 14 14 14 ноя-19 18 18 окт-19 10 сен-19 30 авг-19 июл-19 20 июн-19 19 май-19 апр-19 мар-19 12 фев-19 21 22 янв-19 15 дек-18 15 ноя-18 25 окт-18 20 сен-18 Single Family Residential Building Permits by Month 35 24 18 5
Single Family Residential Building Permits Average Values $300 000 $250 000 $200 000 $150 000 $100 000 $50 000 0 л 2 ию 20 ма й- 20 ма р- 20 ян в- 9 -1 но я се н 1 9 9 л 1 ию 19 ма й- 19 ма р- 19 ян в- 8 -1 но я се н 1 8 $0 Source: Nash. County. NC. gov
Nash Co. Year Householder Moved In 12 000 10 000 39% moved in 2010 or later 11 232 9 473 8 000 5 690 6 000 3 659 4 000 2 000 5 491 1 175 0 Moved in 2017 Moved in 2015 Moved in 2010 Moved in 2000 Moved in 1990 Moved in 1989 or later to 2016 to 2014 to 2009 to 1999 and earlier Source: US Census, ACS 5 Yr 2018.
Housing Affordable to Nash County Households by Income 40% 35% Owner-Occupied Home Values under $67 K to over $355 K 28, 0% 30% 25% $120 K to 18, 8% 20% 15, 4% 18, 7% 15, 1% 10% 19, 0% 16, 7% 10, 6% % of Households by Income % of Owner-Occupied Homes by Value 5% $262 K to 23, 7% 21, 0% 15% $175 K to 6, 5% 0% 00 u 0 $20, r e nd 000 , 0 2 $ t 99 4, 9 o $3 000 , 5 3 $ 99 t 9, 9 o $4 000 , 0 5 $ 99 4, 9 o $7 t Household Income 000 , 5 7 $ 99 t 9, 9 o $9 over 00 , 0 $100 Source: US Census, ACS 5 Yr 2018.
Nash County Rental Rates One Bedroom Two Bedroom 3 Bedroom Less than $300 26. 0% 6. 4% 2. 0% $300 to $499 19. 1% 8. 6% 2. 2% $500 to $749 30. 4% 34. 8% 20. 0% $750 to $999 13. 0% 29. 2% 26. 7% $1, 000 to $1, 499 2. 2% 11. 1% 31. 9% $1, 500 or more 0% 0. 5% 2. 0% 9. 2% 9. 4% 15. 2% No cash rent Source: towncharts. com U. S. Census ACS 1 Yr 2019.
Nash County Housing by Monthly Cost 70% 62, 2% Owners with mortgage 59, 4% 60% Owners without mortgage 50% 40, 2% 40% 34, 8% 30, 0% 30% 21, 7% 16, 5% 20% 17, 6% 11, 0% 10% 3, 0% 2, 0% 6, 8% 0% a s th s e L 0 50 n$ 0 $50 999 $ to 000 $1, to 99 4 $1, $ 00 1, 5 to 99 9 $1, $ 00 2, 0 to 0, 6% 1, 8% 0, 8% 1, 6% 0, 0% 99 4 $2, $ 00 2, 5 to 99 9 $2, 00 Ove , 0 r $3 Source: US Census, ACS 5 Yr 2018.
Monthly Housing Cost as % Household Income 70% All Owner-Occupants 57, 5% 60% Renters 50% 38, 7% 40% 24, 6% 30% 20% 13, 2% 7, 8% 12, 3% 12, 7% 10, 8% 5, 7% 16, 8% 0% t less ha 0% 2 n % 2 % 0. 0 4. 9 2 to 2 % 5. 0 to 9 29. % 3 % 0. 0 to re % 9 34. 35% o or m Source: US Census, ACS 5 Yr 2018.
Most Important Factors Behind Relocation Decisions Job Opportunities for Spouse 6, 8 Diverse Population 6, 8 6, 9 Outdoor Recreation 7, 0 Alternate Jobs 7, 2 Climate 7, 4 Wecolming/Friendly Quality Healthcare 7, 6 Housing Affordability 7, 6 7, 7 Housing Cost 7, 8 Cost of Living 6, 6 6, 8 7, 0 7, 2 7, 4 7, 6 7, 8 8, 0 Source: Development Counsellors International.
Incentive Policy Review Source: U. S. Census Bureau
Framework for Good Incentive Policy Have a written incentive policy that clearly states the reasons for considering business incentives. What economic and quality of life goals for Nash County can be impacted by an incentive program? Goals could include tax base and local government revenue enhancement, job creation, higher wage levels, and broader economic prosperity (across different parts of the county or among various groups). The policy should guide elected officials toward sound decisions but not bind them to any course of action. Measure the impact of every deal under consideration. This can include calculating the return on individual incentive deals (using cost-benefit analysis, economic impact analysis, or fiscal impact analysis), and longer-term evaluation of the entire incentive program and what benefit it is bringing to Nash County. Have incentives improved the business climate and increased Nash’s ability to retain, grow, and attract investment and good jobs? Adjust the policy as necessary by regularly giving decision-makers the data they need to adjust the program to improve Nash County’s competitive position.
Incentive Program Best Practices 1. Develop and communicate policies in a transparent manner. 2. Create policies that guide officials in their decision-making while allowing flexibility. 3. Focus on growing companies in growing industries. 4. Make existing business and small businesses a key part of any strategy. 5. Focus on businesses that export goods or services, with a majority of revenues coming from outside the region. 6. Include criteria beyond jobs and investments that are most important to Nash County. 7. Tie incentives to job training and skills improvement for area residents.
Incentive Program Best Practices 8. In today’s technology-oriented business climate, with rapid advances in automation and robotics, prepare to be flexible on job creation goals. 9. Consider incentivizing building reuse, brownfields remediation and redevelopment, and new investments in Nash County’s downtowns. 10. Create and use an incentive project scorecard or other scoring system. 11. Prepare a sample incentive agreement when the policy is adopted. 12. Choose a well-regarded fiscal impact analysis or return on investment software tool suitable for the county’s resources and staff, or contract for outside assistance.
Incentive Program Best Practices 13. Require written, legally binding incentive agreements with performance timelines and metrics and clawback provisions for non-performance. 14. Because businesses are most concerned with their capital outlays in the first three years of new location and expansion projects, considering providing incentives on a declining scale over time, and limit the length of incentive agreements where possible. 15. Pay incentives only after the fact, only when written criteria are fully met and documented each year. 16. Require incentive monitoring reports and follow-up discussions with the company.
Organizational Capacity Assessment Stakeholder Input There was excitement about the potential of the new county Economic Development effort especially in increased marketing and recruitment. Several stakeholders expressed concern that the County’s new efforts could create client confusion with Carolina’s Gateway Partnership and hoped that there would be a good working relationship. Town officials throughout the county expressed different needs (small business assistance, farmers market, retail attraction), and wanted the county effort to complement and provide support for their priorities.
Organizational Capacity Assessment Stakeholder Input Several upcoming planning efforts including the new regional CEDS and the new updated land-use plan for the county, need to align with the economic development strategy. There was strong support for a specific economic development plan with measurable goals. The need for all local and regional public and private officials to work cooperatively was a theme included in all the feedback.
Organizational Capacity Assessment High-Performing EDOs are driven by their customers operate with a strong strategic plan measure their results and adjust accordingly are creative risk takers build strong alliances and networks earn the trust and respect of their communities are efficient with their funding and resources invest in their people Source: IEDC
Most Effective Marketing Techniques 90% 80% 73% 64% 60% 79% 60% 74% Large Company Execs 56% 48% 50% Location Advisors 45% 42% 40% 30% 36% 20% 26% 16% 21% 6% 10% 0% Web Site Planned Visits Media Relations Hosting Trade Shows Special Events Advertising Direct Mail Telemarketing Source: Development Counsellors International.
Most Useful Features for EDO Websites 1. 2. 3. 4. 5. Incentive Information Demographic Information Major Employers List Searchable database buildings/sites Workforce Statistics Source: Development Counsellors International.
When Would Prospect Contact EDO? After location determined 5% After shortlist narrowed to negotiate incentives 11% Never 12% During initial screenings 30% After shortlist of communities 42% Source: Development Counsellors International.
Organizational Excellence Index Components of Excellence Current Situation Professional Staff Three total staff, two experienced professional economic development staff with competitive salaries Staff Training Resources Current budget includes some funds for training and participation in professional associations Resources Match Expectations Very modest county budget with limited marketing funds and no contingency funds for unforeseen opportunities Supportive Governance Stakeholder feedback suggests excitement and support for the new department Up-to-date Strategic Plan Targeted Industries Clear Priorities Product Improvement Plan To be adopted 2020 New land use plan beginning, infrastructure development plan and Capital Improvement Plan with timetables should be included on website Strong Institutional Alliances Under development, next step should be the creation of a county influence map to guide Alliance Building Source: Economic Leadership
Organizational Excellence Index Components of Excellence Current Situation Continuous Stakeholder Input Began with good stakeholder input into strategic plan, future input should be formalized including an annual business satisfaction survey to measure progress Regional Alliance for Marketing Respected by State Organization Clear Client Handling Protocol Joined RTRP summer 2020 Building relationship with EDPNC and Dept of Commerce Internal protocol, but regional clients could present confusion Next step should be an internal (Nash County) communication plan that could include an annual event, enhanced social media, regular press releases, a speaker’s bureau, and periodic community forums Adequate Web, presence, should be enhanced Community Communication Competitive Technology Strong, Informative Web Site Source: Economic Leadership
Organizational Excellence Index Components of Excellence Current Situation Social Media Presence Continuous improvement plan needed, future budget should include a social media audit to refine messaging followed by development of a social media mavens’ group Strong Research Capacity Adequate, but data requirements are growing, future annual workforce study and continuous updates on web site Good Building & Site Inventory Good and aligned with state system, addition drone footage and more virtual tours in the future Performance Metrics Initial dashboard to be adopted with strategic plan Source: Economic Leadership
Typical Performance Metrics Number of initial inquiries (businesses or site selection consultants seeking information) Number of qualified prospects (indication of a specific project with interest in Nash County) Number of new companies relocating to Nash County Number of expanding Nash County companies New business licenses in the County New jobs added from successful EDO projects Total payroll added from successful EDO projects Total tax base added from successful EDO projects Jobs retained from EDO projects Increase in retail sales tax attributed to EDO projects Average wages of successful EDO projects Total job gains in targeted industries
Community Economic Dashboards Job growth Average wage Wage growth Unemployment rate Poverty rate Housing starts Tax base ratio (Residential/Non-residential) Jobs to labor force ratio
Recommendations Economic Overview Organizational Capacity Assessment Workforce Analysis Nash County Economic Development Targeted Industry Analysis Incentive Policy Review Housing Analysis
Strategy #1 Build, Align & Nurture a Coalition of Economic Development Stakeholders Step 1 -Aligned Coalition of County and Municipal Officials Action 1 - Build a director’s economic development advisory committee of institutional partners Action 2 - Conduct a Nash County social media and digital audit to determine on-line brand Action 3 - Expand the community branding initiative by aligning digital messaging Action 4 - Hold an annual joint event about the County economy
Strategy #2 Continue to Improve the Nash County Product Action 5 - Conduct a comprehensive review of business and development regulations and processes to promote speed and certainty. Action 6 - Encourage mixed use development zoning in the new land use plan Action 7 - Support efforts to improve appearance along major entry corridors and gateways Action 8 - Develop an infrastructure status and improvement plan document Action 9 - Create a county incentive policy Action 10 - Aggressively promote broadband expansion
Strategy #3 Market the County to Attract New Jobs and Investment Action 11 - Adopt targeted industries Action 12 - Market to businesses and developers in the urban parts of the Research Triangle Region Action 13 - Target Site selectors for meetings & events Action 14 - Partner with EDPNC, NC Commerce, and RTRP Action 15 - Enhance building and site inventory Action 16 - Enhance the economic development web site Action 17 - Expand social media presence
Strategy #4 Support Existing Business and Towns Action 18 - Build a more robust small business assistance portal on the Economic Development website Action 19 - Conduct retention and expansion outreach to current employers Action 20 - Conduct an annual small business survey to identify issues Action 21 - Provide workforce needs information to education and training organizations Action 22 - Work with NC Cooperative Extension Service to expand farmers market services to all communities in the county
Strategy #5 Build a Best-in-Class County Economic Development Organization Action 23 - Create an internal and external communications plan Action 24 - Expand public and private resources over time Action 25 - Create a public dashboard for economic and economic development progress Action 26 - Seek IEDC Accreditation Action 27 - Continue to invest in staff training
Implementation Timetable Actions Strategy #1 Stakeholder Coalition 1) Director’s advisory committee 2) Social media/digital audit 3) Expand branding 4) Annual Event Strategy #2 Improved Product 5) Regulation/process review 6) Encourage mixed use 7) Improve corridor appearance 8) Infrastructure document 9) County incentive policy 10) Broadband expansion Strategy #3 Marketing 11) Targeted Industries 12) Market to RTP region 13) Target site selectors 14) Partner with EDPNC & RTRP 15) Building and site inventory 16) Enhance web site 17) Expand social media Year One Year Two Year Three
Implementation Timetable Actions Strategy #4 Business and Town support 18) Small business portal 19) Retention/expansion outreach 20) Small business survey 21) Employer workforce needs 22) Expand farmers markets Strategy #5 Best-In-Class Organization 23) Communications plan 24) Expand resources 25) Public dashboard 26) IEDC Accreditation 27) Staff training Year One Year Two Year Three