Performance Potential Induced Monitoring Degradation of Solar Power


")


")


 is ratio of “Energy Measured” to “Energy Modelled”. PR")

 generated per one k. Wp per")


; Pyranometer: CMP – 11")

")


 • Many module manufacturers have taken steps to produce")

- Slides: 40
Performance Potential Induced Monitoring Degradation of Solar Power Plants.
CONTENTS O V E R V I E W OF SOLAR PROJECTS IN DMRC PERFORMANCE MONITORING OF PLANTS BRIEF ON PID PROPOSED SOLUTIONS CONCLUSION 2
OVERVIEW OF SOLAR PROJECTS IN DMRC
Solar Power Projects in DMRC • In an effort to reduce carbon footprints, DMRC decided to use all roof tops to instal solar panels for renewable energy. • As a first step, DPRs were prepared to assess solar potential by surveying stations & depots. • 27 th June 2014, first roof top solar plant of 500 k. Wp capacity commissioned (in association with SECI). • It was on RESCO Model – In which investment was by Developer and only roof space was given by DMRC.
Types of Roofs DMRC sites have following 3 different type of roof tops : - – Flat roof – Inclined Roof – Curved Roof
500 k. Wp - DWARKA 21 Station (13 o Delta Rack)
115 k. Wp - ANAND VIHAR Station (3 Tier Module, 24 o Angle, with Foundation Blocks)
85 k. Wp - Pragati Maidan Station (2 Tier Module, 24 o Angle, with Foundation Blocks)
50 k. Wp - METRO ENCLAVE (with Net Metering)
Inclined Roof Solar Panels on Inclined Sheds
Curved Roof
Curved Roof
Present Status Ø Total assessed Potential: - 50 MWp. Ø Rs. 25. 50 Crores Central Financial Assistance for 20 MWp Solar Plants approved by MNRE. Ø PPA signed for 11. 0 MWp with Pooled Levelised Tariff of Rs. 6. 32 / k. Wh under RESCO Model. Ø 2. 8 MWp capacity is already commissioned.
Learnings and Challenges faced Ø In Using Curved Roof sheds, ü Design clamps / structures for Delhi Wind Load, (till now only one reputed supplier for clamps in India) ü Special Provisions for Sheds. (Ladder, Life Line, etc. ) Ø Existing sheds not Designed / oriented for Solar Panels, (Ventilation Dome, etc. ) Ø Getting Power Block in Operational areas, Ø Developers lack experience with Metro / Rail, Ø Assimilation of Technology Upgrades in PPA. Ø Premature reduction in Power Output
Provisions in PPA Ø In PPA, Estimated generation is specified based on minimum Capacity Utilization factor CUF of 15% per annum. Ø Degradation not to exceed 20% in 25 years. Ø Release of 15% subsidy is linked to Performance of plant: 10% on Commissioning of plant (with minimum 75% PR) 2. 5% after 1 st year of operation (with min. CUF > 15%) 2. 5% after 2 nd year of operation (with min. CUF > 15%)
PERFORMANCE MONITORING OF PLANTS
Important Terms regarding performance • Performance Ratio • Capacity Utilization Factor • Specific Energy
Performance Ratio “Performance Ratio” (PR) is ratio of “Energy Measured” to “Energy Modelled”. PR = (Measured Energy output in k. Whr) (Irradiance in k. W/m 2) X (Active Area of Panel in m 2) X (Module Efficiency). Range : - 70 – 80 %. To qualify for release of Subsidy, PR should be minimum 75% at the time of commissioning.
Capacity Utilization Factor Ratio of annual output of the plant in k. Wh to installed plant capacity for number of days. CUF = Annual Energy Output (in k. Wh) (Plant installed capacity in k. Wp) X 365 X 24 In tenders, minimum CUF specified is 15%.
Specific Energy Specific energy is energy (k. Wh) generated per one k. Wp per day. Specific Energy = Energy generated (Capacity installed * Time Period ) For our plants, on an average it is 4 Units / k. Wp per day.
Tabular Comparison of Info on Web
Required Improvements • Performance Ratio (for whole plant as well as individual inverters on daily basis and on date selection basis) • Plot of Power generated Vs Irradiance • Specific energy (k. Wh / k. Wp / Day) (for each inverter and whole plant. ) • Inverter Efficiency Plot (A. C. Power generated Vs DC power Available)
On closely monitoring, in Performance of One of the Plant PREMATURE DEGRADATION of Power Output was noticed.
Root Cause Analysis by Developer On closely monitoring the Performance of the Solar installation PREMATURE DEGRADATION was Observed.
Details of Analysis String type Inverter : (21. 6 KW); Pyranometer: CMP – 11 All inverters working at optimum output level – checked DC v/s AC power Installed at Plane Of Array (POA) No inverter found underperforming – Compared DC current data distribution No visual defect / damage observed Interim maintenance carried out Pass Module (300 Wp) No physical damage observed No visual defect (discoloration etc. ) seen IV curve test, to check degradation, is planned – could not done due to unfavorable weather at site. The instrument is cleaned Calibration is NOT DUE yet Pass Environment – Shadow, Soiling No shadow on structure / module/s Soiling – Soiling is more being in open area and vicinity to Airport Fail Partially Pass 25
Around 32 Solar modules were taken from site for testing at the factory. After testing, degradation was attributed to POTENTIAL INDUCED DEGRADATION (PID).
BRIEF ON POTENTIAL INDUCED DEGRADATION (PID)
What is PID ? PID is Potential Induced Degradation, a phenomenon which affects some PV modules with crystalline Si cells and leads to Power loss in a module, by electrically modifying solar cell resulting in leakage current. Deterioration in performance, may be 30% or more in few months / years. POTENTIAL CAUSES: - (a) HIGH TEMP. (b) HIGH HUMIDITY (c) HIGH VOLTAGE Screening for PID at present is not addressed in IEC
How PID works ? A positive charge is built up on the anti-reflective coating at the surface of the cells & the result is a temporary short circuit in the affected cells This leads to a decrease in cell voltage and a drop in efficiency – an effect that is reinforced by high temperatures & humidity
PID Testing • As per IEC 62804 under drafting, the PID testing involves a test run of 100 hours with Voltage applied to Test panel’s corresponding to maximum system voltage (as per panel datasheet) and exposed to environment with temperature and humidity of 60°C (± 2°C) and 85% (± 5%) respectively in a chamber. • PID testing procedures, in many labs involves comparison of visual inspection, I-V measurement and EL testing prior to and after the actual PID testing. • After the test, Module must not show any major defects and should not have power loss more than 5%.
V-I Curve of the Module
Comparison of EL images of Modules
Impact of Potential Induced Degradation 1. Risk in achieving 25 years warranty life, 2. Gets worse with high temperature & high humidity 3. At early stage, PID is reversible by reverse voltage bias. 4. If allowed to progress, degradation becomes irreversible.
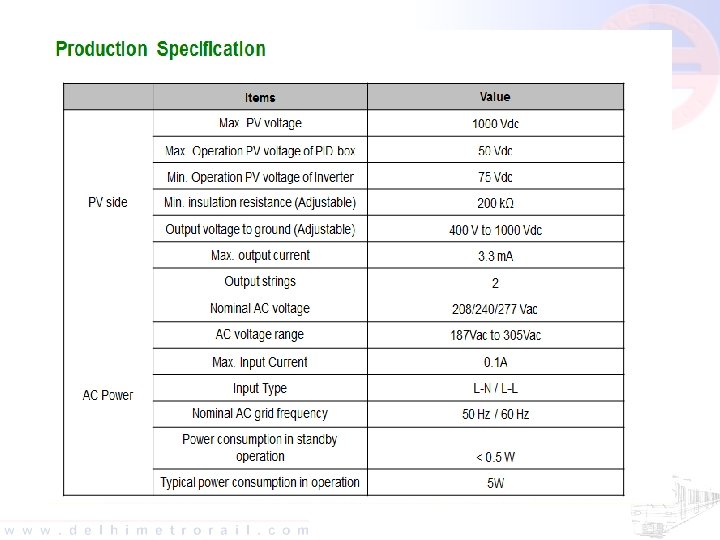
Challenges and solutions for PID Since, environmental factors can not be controlled. The Three level strategy with important factors is : - Ø Cell level – Anti reflective coating (ARC). Ø Panel level – Encapsulation Material, Ø System level – Negative Grounding or PV Offset Box. (Grounding is possible in Central Inverters and not in String Inverters, normally used for small capacity Plants) In all new plants of DMRC PV offset boxes are used.
Action Plan to Reverse PID at site
CONCLUSION
CONCLUSION • Performance parameters must be standardised to compare different Plants of developers on equal footing. • Potential Induced Degradation can seriously impact the Pay-back of the plants. While, entire PV system interacts to cause PID, the failure occurs in the modules. • While environmental factors are hard to control, the best solution is to minimize or eliminate PID by making design changes at the system, module and / or cell levels.
CONCLUSION (Contd. . . ) • Many module manufacturers have taken steps to produce PID resistant modules, which currently are nearly 4 to 5% costlier than Normal module. • Early finalisation of IEC for testing the modules, is likely to help in proper certifications of “PID-resistant” modules. • Design of Solar Plant with string based Inverters must analyse grounding requirements carefully and include PV Offset Box.
THANK YOU