Part 1 Largescale gene expression transcriptomic data analysis
 data analysis Ståle Nygård, Bioinformatics core facility, OUS/Ui.")

 • Are")

")

 Sample Nucleic acid purification Bioinformatica nalysis RNA/DNA Preprocessing Amplification and Labelling")


 2) 3) 4) 5)")


 Highly expressed genes having big influence on")
 - Ordinary t-test: - Variance estimates can be improved")
")


, use false")

. Finding predefined gene sets overrepresented by regulated genes.")


 Gene A Gene B Gene C")

- Slides: 26
Part 1: Large-scale gene expression (transcriptomic) data analysis Ståle Nygård, Bioinformatics core facility, OUS/Ui. O staaln@ifi. uio. no
Gene expression is the process by which information from a gene is used in the synthesis of a functional gene product.
Transcriptomic data • “Genome-wide” measurements of gene expression (several thousand gene transcripts) • Are often used to find differentially expressed genes – Between groups of individuals (with different phenotypes, e. g. disease/healthy, long/short survival etc) – Over time (e. g as disease develop, as tissue develop)
Development of transcriptomics 1977 1987 1995 1996 2003 2005 Future • • • Multiple Northern blots Macroarrays c. DNA microarrays Oligonucleotide microarrays High density arrays • High througput sequencing (RNA sequencing) • Next-next generation sequencing: True single molecule sequencing. E. g Nano. Pore technology (http: //www. nanoporetech. com) 4
Alternative splicing (example)
Microarrays vs RNA-Seq
Microarray pipeline (simplified) Sample Nucleic acid purification Bioinformatica nalysis RNA/DNA Preprocessing Amplification and Labelling Raw data EBE`BEp. BEBLEÐB@E@B@EàB@EBh Ep. BHE°BPEp. B‚E `B`EðBEBHEPB$E� BEBEB@E(EBEBP E€B 8 EàB$EPBE#°BLE`B`EàB PE°BEÐBDEB 8 EBBBEB$EÀBLEBE� B`E`B@E"� BTE°BE� B€E@B, EÀB 8 E%B ªEÀBE°BHE� B 8 E@BE� BLE€B 4 EàB$ E`BEÀB 8 E@B 4 EðB@EBE àB$E� BDEB<EÐBTE°B, EB$EPBEB@ EðB, EB<E 0 BHE€B 4 EBE@BEB(E€B, E BXE!@BXE`BDEàBd. Ep. BHEB(E#ÀB 4 E `B 4 E€B 4 E°B 4 E)`BE@B 4 E 0 BDEp. Bd E`BHEPBE@BE@BEÀBE!PB 0 Ep. BE" °BEp. B, EàBPEB`E� BHEB 8 Ep. B@E B Labeled RNA/DNA Hybridisation, washing Scan, Quantitate 7
RNA sequencing
RNA sequencing
RNA sequencing
Bioinformatic analysis of RNA sequencing data – main steps 1) 2) 3) 4) 5) 6) Alignment to transcriptome Assembly (finding isoforms) Count reads (per isoform or gene) Normalization Differential expression (per isoform or gene) Functional analysis
Normalization • Goal: remove technical artifacts, which can be due to – Different amounts of input material – Different degrees of degradation – Dust, scratches etc on the arrays – ++ • Most normalization methods assume that the overall intensity is the same for different samples (e. g quantile normlization).
Quantile normalization • Enforce equal distribution between the microarrays. Procedure – Sort the expression values for each microarray from highest to lowest – Calculate the mean value for each rank – For every array • let the highest ranked gene have the mean value of the highest ranked genes (of all arrays) • Let the second highest ranked gene have the mean value of the second highest ranked genes (of all arrays) • and so on for all ranks 13
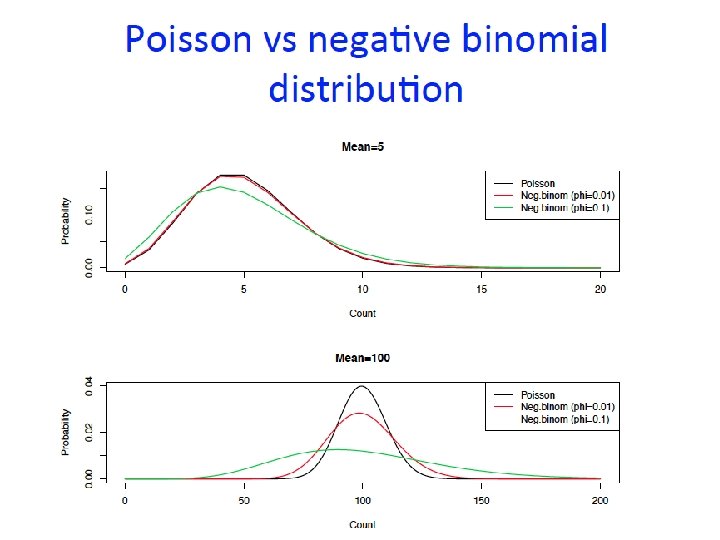
Normalization using TMM (Trimmed Mean of M-values) Highly expressed genes having big influence on library size In TMM the genes with the smallest and largest ratios (i. e 40% of the genes) are not used in the normalization.
Testing for differential expression (microarrays) - Ordinary t-test: - Variance estimates can be improved by ”borrowing strength” across genes in a technique called variance shrinkage Many methods use this technique, e. g SAM. - Non-parametric methods (e. g. rank product) NB! Ordinary t-test works well for large sample sizes.
(RNA-seq data)
Transcriptomic data analysis summary
Microarray vs RNA-Seq • Advantages RNA-Seq – Can handle alternative splicing – Claimed to be more robust to degradation – Now also cheaper • Advantages microarrays – Claimed higher accuracy for lowly expressed genes – Analysis tools are more mature From: Differential analysis of gene regulation at transcript resolution with RNA-seq (Trapnell et al, Nature Biotechnology, 2013).
Correction for multiple testing In ordinary microarray studies (looking at all genes), use false discovery rates instead of ordinary p-values
Hierarchical clustering • Genes and samples can be clustered at the same time • Agglomerative: start with one element as a cluster (bottom-up). Most common • Divisive: start with all elements in one large cluster (top-down) • Dendrogram: a cluster tree • Why cluster genes? ü Reduce complexity ü Generate hypothesis, e. g. hypothesize that a group of genes with similar expression profiles interact or are involved in the same process • Why cluster samples? ü Identify known subgroups ü Find new or more detailed subgroups ü Quality check (detect outliers) 21
Functional analysis • Over-representation analysis (ORA). Finding predefined gene sets overrepresented by regulated genes. The gene sets can be – Gene Ontology categories (molecular functions, biological processes, cellular components – Pathways (signalling, metabolic) • Map (pair-wise) molecular interactions onto the set of regulated genes using e. g – Protein-protein interactions – Transcription factor binding information
GO structure • Terms are related within a hierarchy • Describes multiple levels of detail of gene function • Terms can have more than one parent or child
Pathway analysis - example
Fisher’s exact test Gene group (GO term, pathway) Gene A Gene B Gene C Gene D Gene E Null distribution P-value Answer = 4. 6 x 10 -4 Background population: 500 black genes (diff. expr genes), 5000 red genes (not diff. expr. genes) 25
Network construction based on microarray data • Network construction from genomic data is difficult. Many possible combinations of interactions. • Network construction could be guided by including external information about interactions. • Examples – Seeded Bayesian networks (Djebbari et al, 2008) – Bioconductor package Bionet example