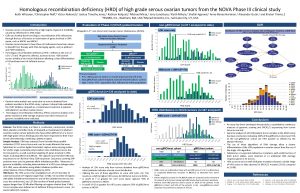
Overview of Ovarian Cancer in England Incidence Mortality


- Slides: 24

Overview of Ovarian Cancer in England: Incidence, Mortality and Survival 2012 (November)

Trends in incidence and mortality, England 1989 to 2010

Funnel plot of incidence by SHA, 2007 -2009

Funnel plot of incidence by Cancer Network, 2007 -2009

Map of incidence by Cancer Network, 2007 -2009

Age-specific incidence rates and number of cases diagnosed by five year age group, England 2009

Trends in incidence by broad age band, England, 1987 -1989 to 2007 -2009

Scatter plot of incidence against measure of deprivation by PCT, 2007 -2009

Funnel plot of mortality by SHA, 2008 -2010

Funnel plot of mortality by Cancer Network, 2008 -2010

Map of mortality by Cancer Network, 2008 -2010

Age-specific mortality rates and number of deaths by five year age group, England 2008 -2010

Trends in mortality by broad age band, England, 1985 -1987 to 2008 -2010

Scatter plot of mortality against measure of deprivation by PCT, 2008 -2010

Trends in one and five-year relative survival, England 1985 to 2009/2005

Funnel plot of one-year relative survival by Cancer Network, 2007 -2009

Funnel plot of five-year relative survival by Cancer Network, 2003 -2005

Age-specific relative survival, England 2007 -2009 (one-year) and 2003 -2005 (five-year)

Trends in age-specific one-year relative survival, England 1987 -1989 to 2007 -2009

Trends in age-specific five-year relative survival, England 1988 -1990 to 2003 -2005

Relative survival by deprivation, England 2007 -2009 (one-year) and 2003 -2005 (five-year)

Number of cases by morphology, England 2000 -2009

Distribution of morphology by age group, England 2007 -2009

Distribution of morphology by deprivation, England 2007 -2009
 Prevalence calculation formula
 Epirates
 Hrd score ovarian cancer
 Ovarian cancer marker
 Ovarian cancer causes
 Ovarian cancer brca
 Ovarian cyst
 Ovarian ligament
 Ovarian ligament
 Duct system of female reproductive system
 The ovarian cycle
 Ovarian cycle
 Ovaries
 Stroma
 Ovarian benign tumor
 Pudendum
 Ovarian ligament.
 Uterus diagram
 Ovarian teratoma
 Ovarian ligament.
 Ovarian cyst size chart
 Sru consensus ovarian cysts
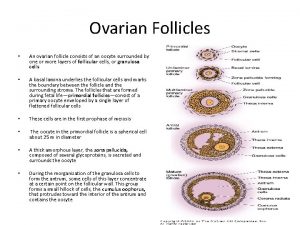
 Ovarian follicle
 Follicles in ovary
 Spermatid

