On changes in the surface and middepth circulation
- Slides: 30
On changes in the surface and mid-depth circulation of the Arctic Ocean Michael Karcher, Frank Kauker, Benjamin Rabe, Rüdiger Gerdes, Ursula Schauer, John. N. Smith
Freshwater content changes and circulation Freshwater surface fluxes and exports Forcing Connection with mid-depth Atlantic Water Layer (AWL) circulation Implications
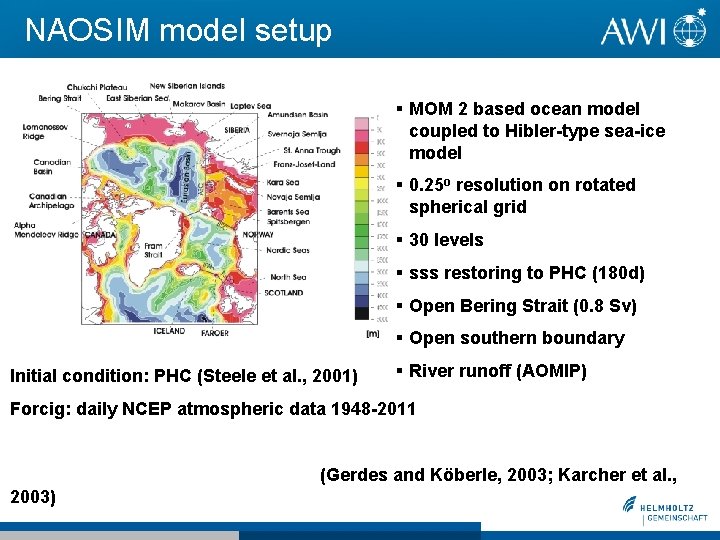
NAOSIM model setup MOM 2 based ocean model coupled to Hibler-type sea-ice model 0. 25 o resolution on rotated spherical grid 30 levels sss restoring to PHC (180 d) Open Bering Strait (0. 8 Sv) Open southern boundary Initial condition: PHC (Steele et al. , 2001) River runoff (AOMIP) Forcig: daily NCEP atmospheric data 1948 -2011 (Gerdes and Köberle, 2003; Karcher et al. , 2003)
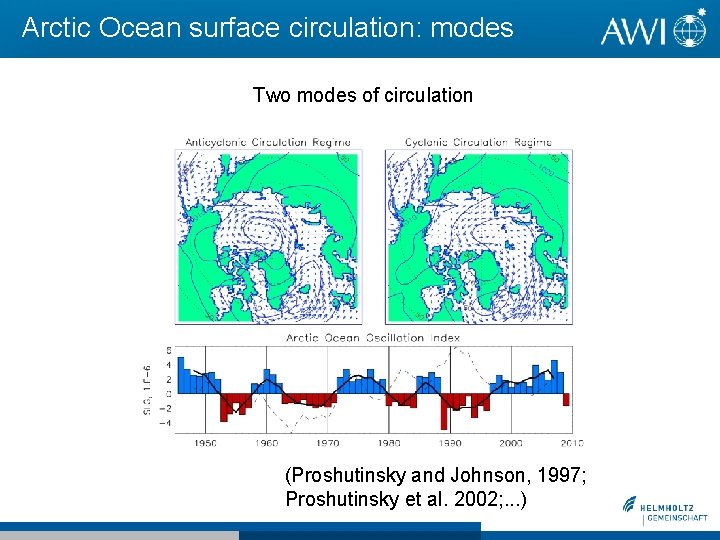
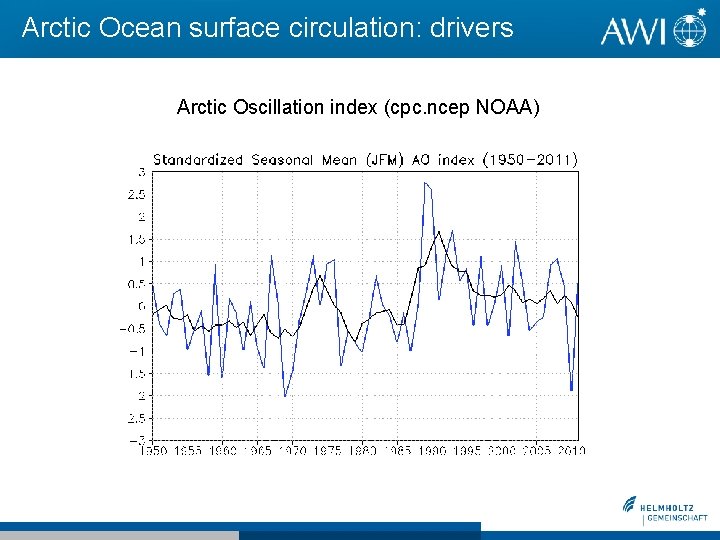
Arctic Ocean surface circulation: modes Two modes of circulation (Proshutinsky and Johnson, 1997; Proshutinsky et al. 2002; . . . )
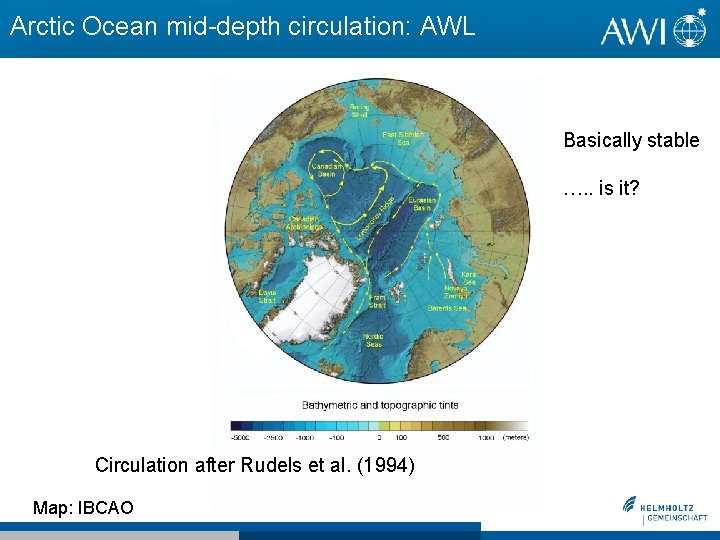
Arctic Ocean mid-depth circulation: AWL Basically stable …. . is it? Circulation after Rudels et al. (1994) Map: IBCAO
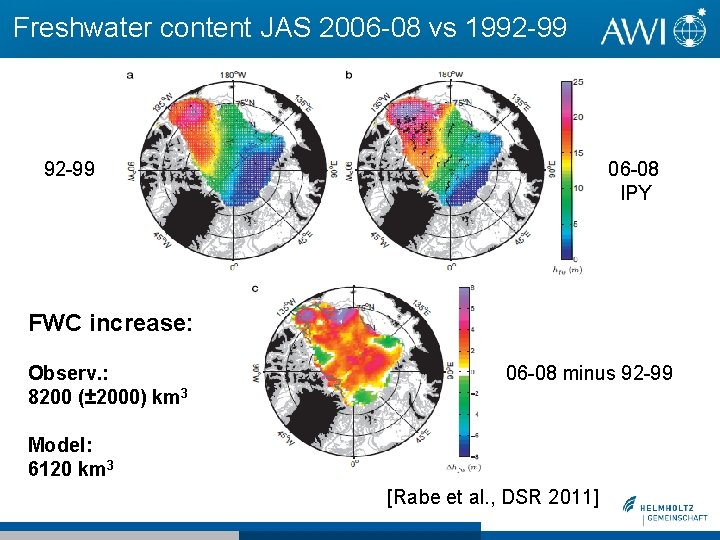
Freshwater content JAS 2006 -08 vs 1992 -99 06 -08 IPY FWC increase: Observ. : 8200 (± 2000) km 3 06 -08 minus 92 -99 Model: 6120 km 3 [Rabe et al. , DSR 2011]
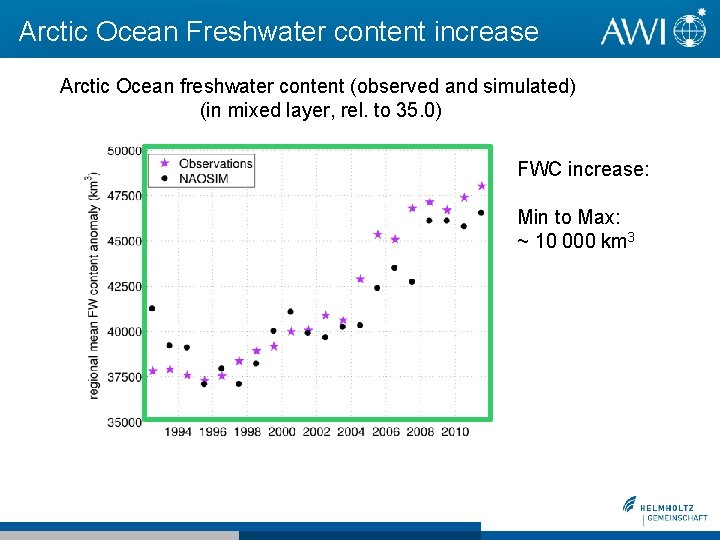
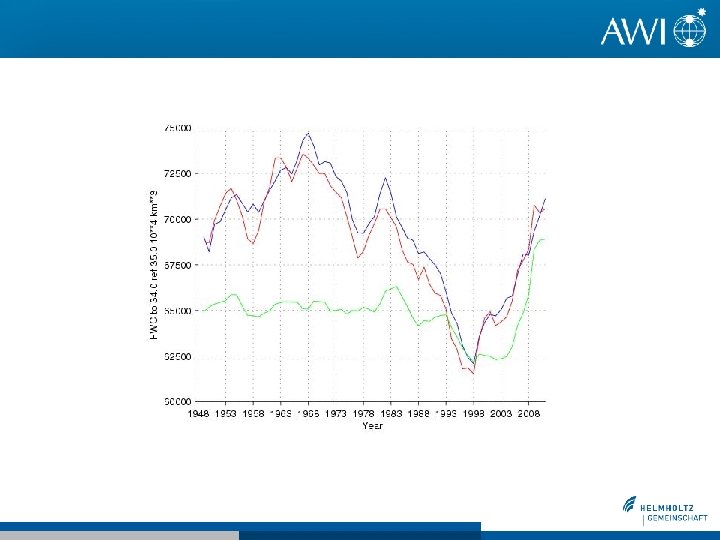
Arctic Ocean Freshwater content increase Arctic Ocean freshwater content (observed and simulated) (in mixed layer, rel. to 35. 0) FWC increase: Min to Max: ~ 10 000 km 3
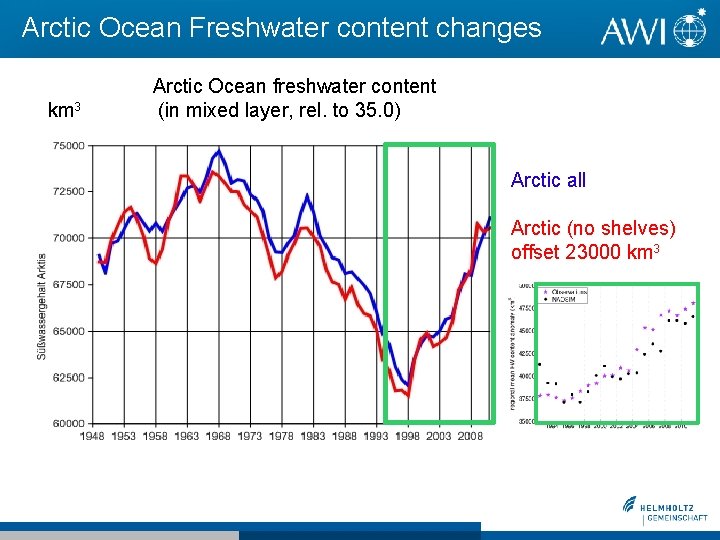
Arctic Ocean Freshwater content changes km 3 Arctic Ocean freshwater content (in mixed layer, rel. to 35. 0) Arctic all Arctic (no shelves) offset 23000 km 3
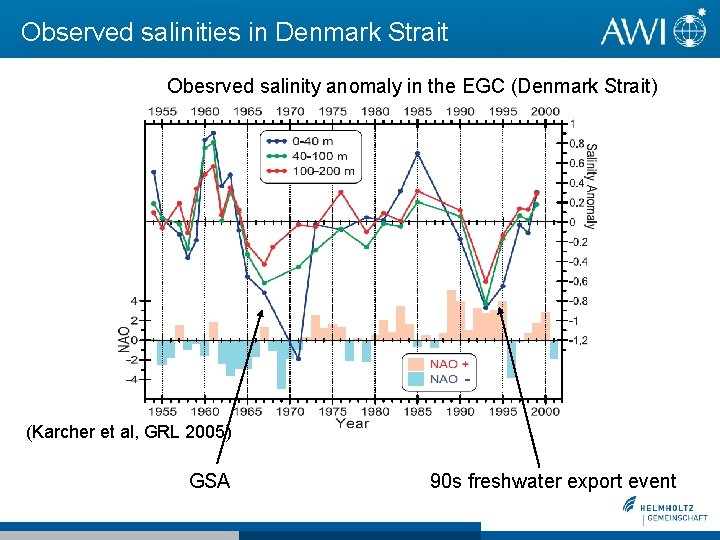
Observed salinities in Denmark Strait Obesrved salinity anomaly in the EGC (Denmark Strait) (Karcher et al, GRL 2005) GSA 90 s freshwater export event
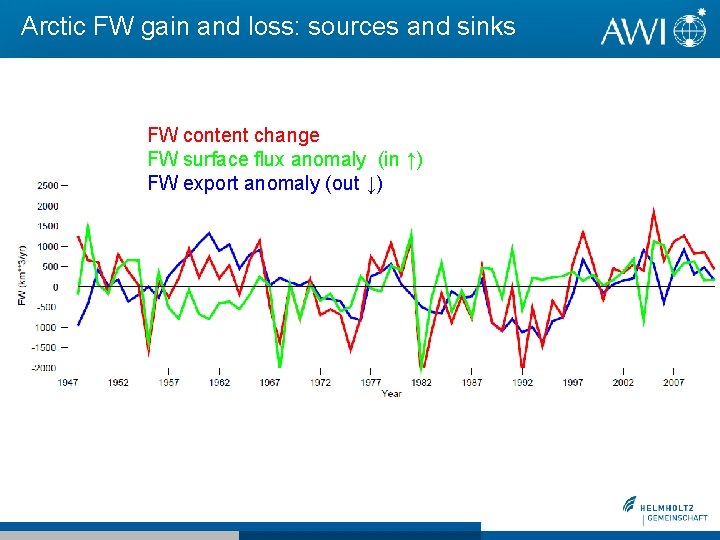
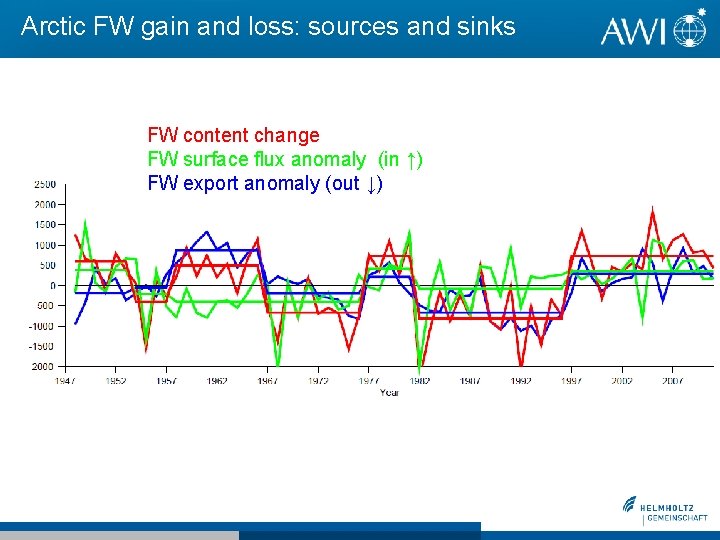
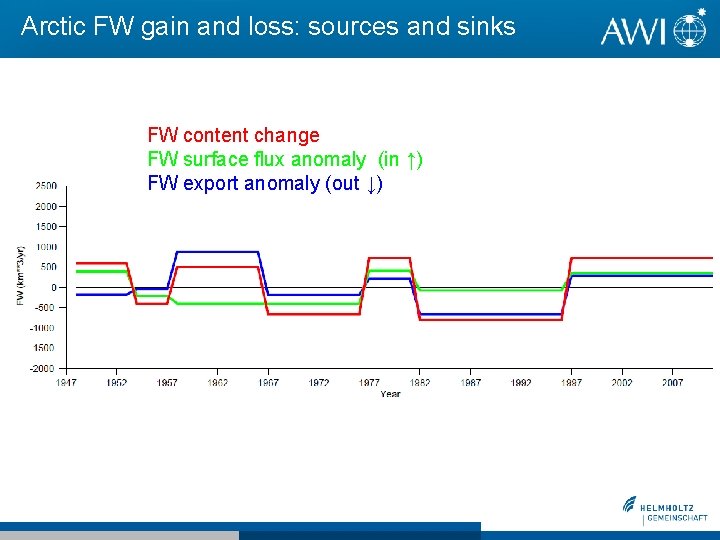
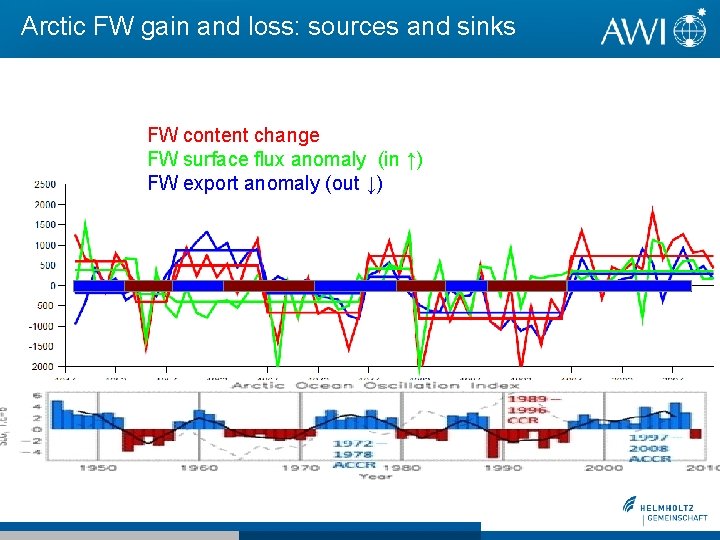
Arctic FW gain and loss: sources and sinks FW content change FW surface flux anomaly (in ↑) FW export anomaly (out ↓)
Arctic FW gain and loss: sources and sinks FW content change FW surface flux anomaly (in ↑) FW export anomaly (out ↓)
Arctic FW gain and loss: sources and sinks FW content change FW surface flux anomaly (in ↑) FW export anomaly (out ↓)
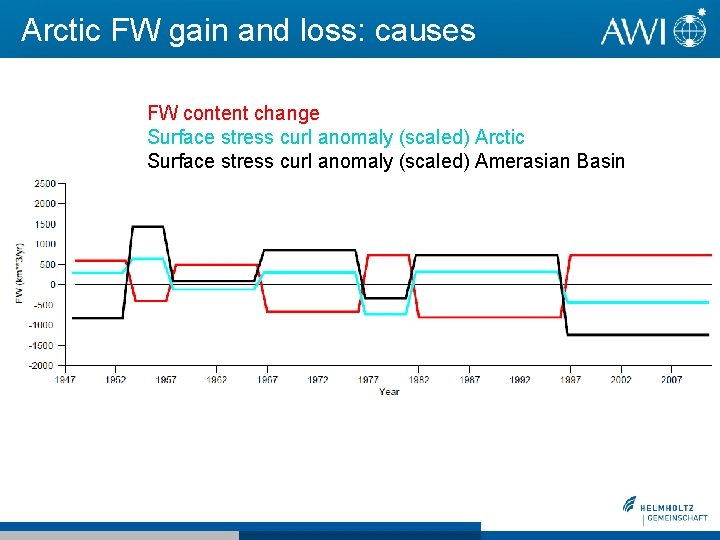
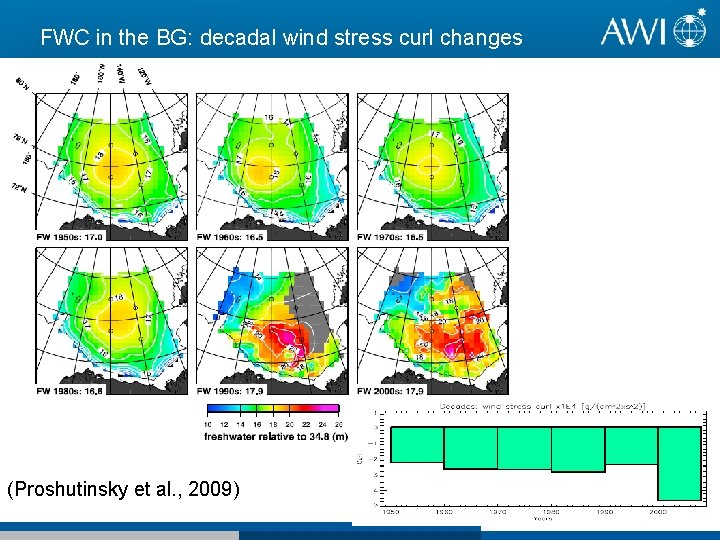
Arctic FW gain and loss: causes FW content change Surface stress curl anomaly (scaled) Arctic Surface stress curl anomaly (scaled) Amerasian Basin
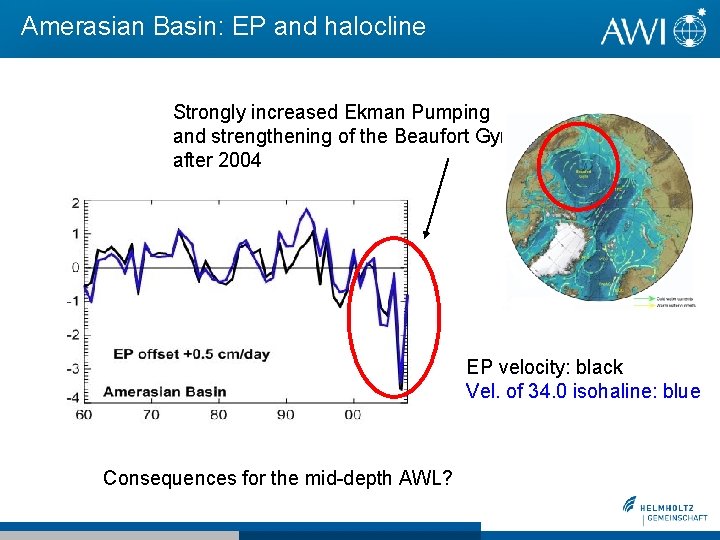
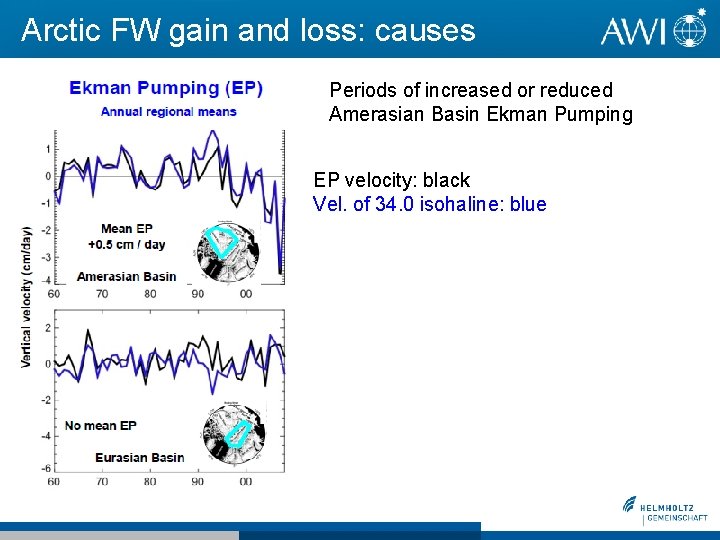
Amerasian Basin: EP and halocline Strongly increased Ekman Pumping and strengthening of the Beaufort Gyre after 2004 EP velocity: black Vel. of 34. 0 isohaline: blue Consequences for the mid-depth AWL?
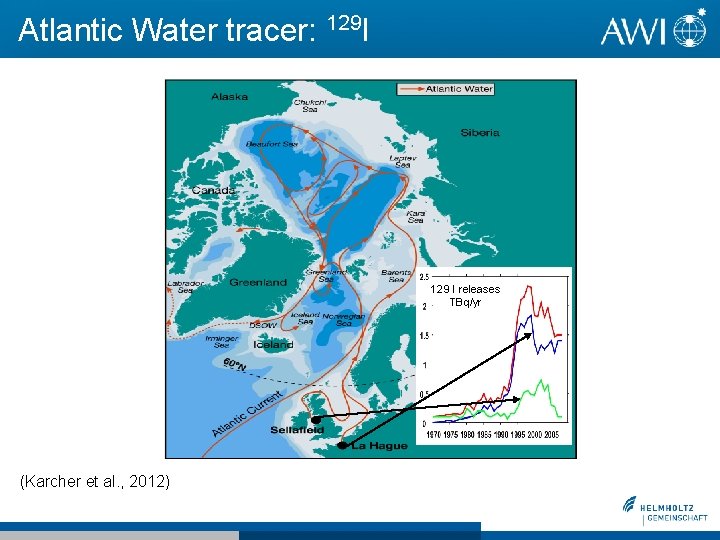
Atlantic Water tracer: 129 I 129 I releases TBq/yr (Karcher et al. , 2012)
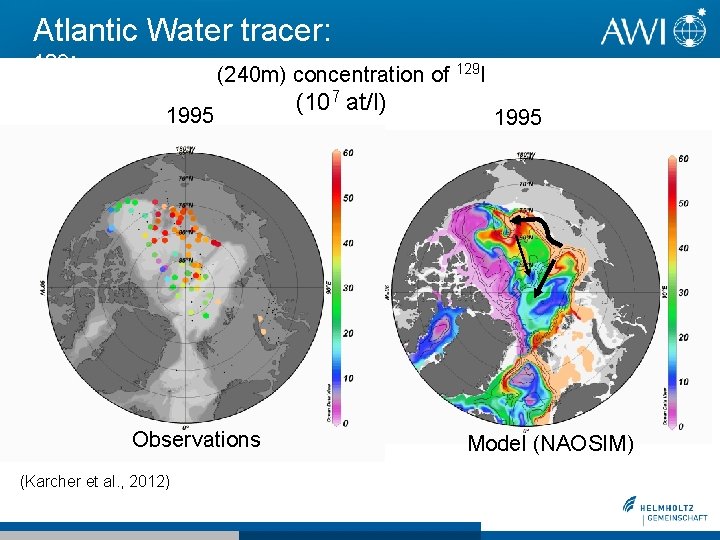
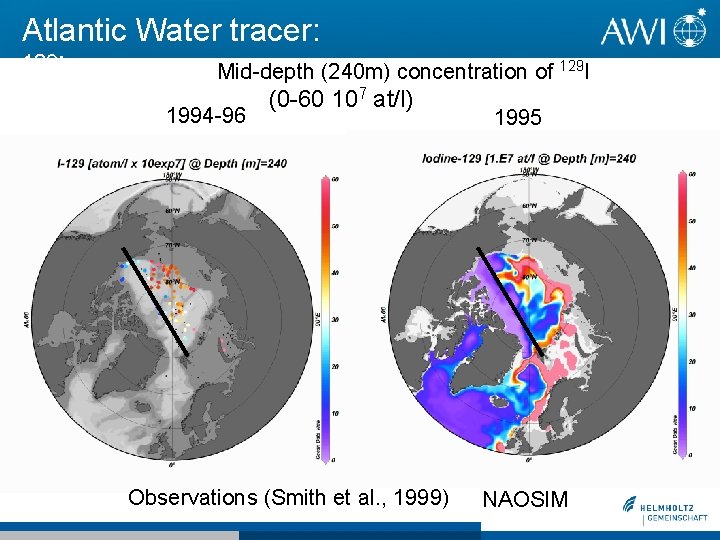
Atlantic Water tracer: 129 I (240 m) concentration of 129 I 1995 Observations (Karcher et al. , 2012) (107 at/l) 1995 Model (NAOSIM)
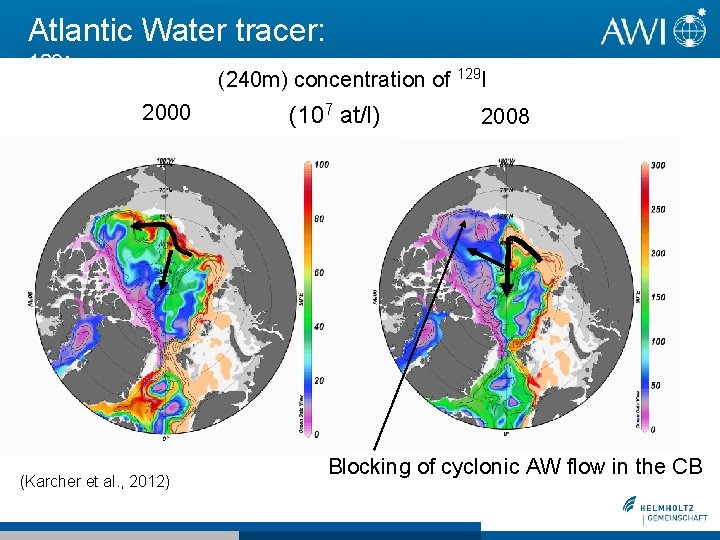
Atlantic Water tracer: 129 I (240 m) concentration of 129 I 2000 (Karcher et al. , 2012) (107 at/l) 2008 Blocking of cyclonic AW flow in the CB
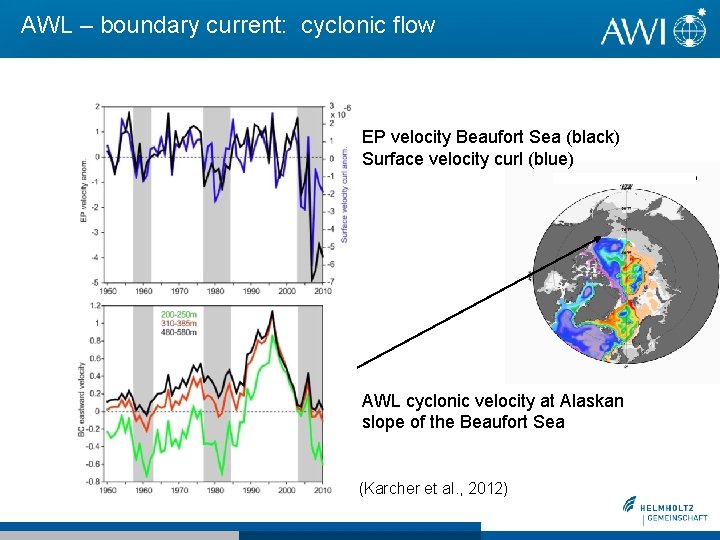
AWL – boundary current: cyclonic flow EP velocity Beaufort Sea (black) Surface velocity curl (blue) AWL cyclonic velocity at Alaskan slope of the Beaufort Sea (Karcher et al. , 2012)
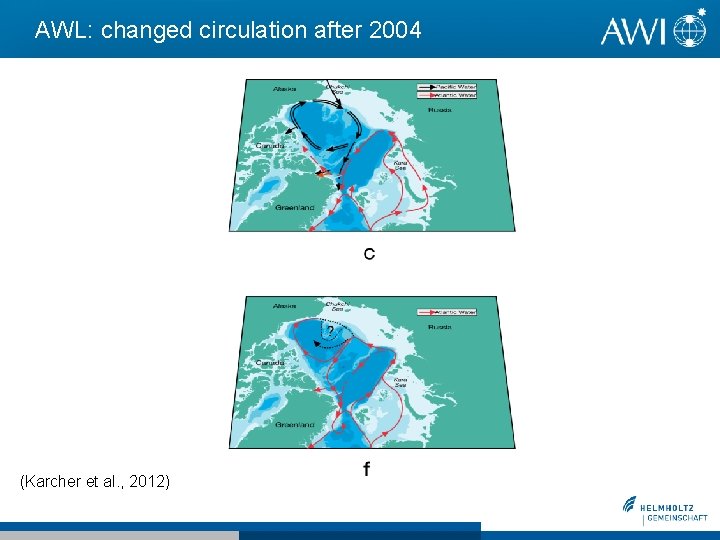
AWL: changed circulation after 2004 Mid-depth circulation 2004 ff ? (Karcher et al. , 2012)
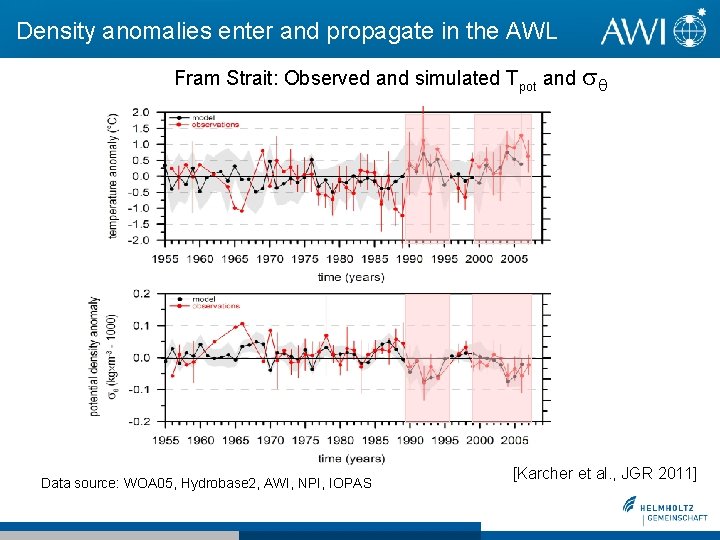
Density anomalies enter and propagate in the AWL Fram Strait: Observed and simulated Tpot and Data source: WOA 05, Hydrobase 2, AWI, NPI, IOPAS [Karcher et al. , JGR 2011]
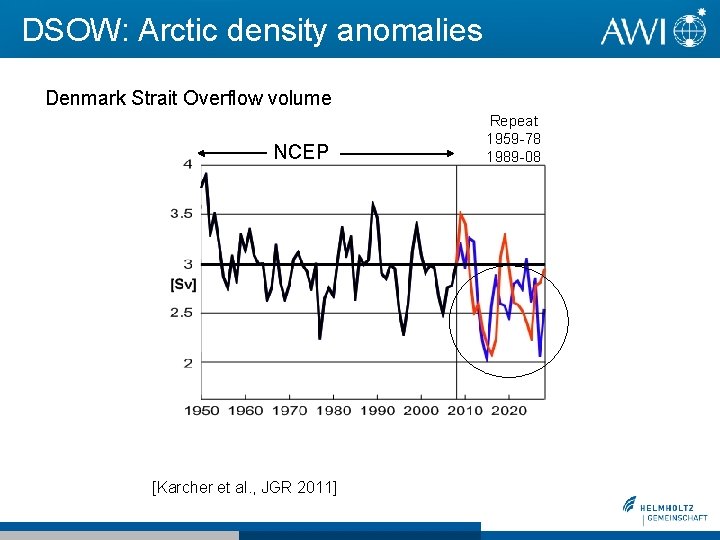
DSOW: Arctic density anomalies Denmark Strait Overflow volume NCEP [Karcher et al. , JGR 2011] Repeat 1959 -78 1989 -08
Conclusions Increase of Arctic FWC 10 000 km 3 since 1998 in observations and model. Decadal FWC changes driven by surface stress curl Compensation largely by freshwater export changes Strong BG suppresses mid-depth AWL circulation → very pronounced after 2004: indications for flow reversal of AWL The cyclonic AWL may be less stable than we thought! Consequences for properties of AIW outflow and overflows Thanks to AOMIP, NSF and to Andrey!
Arctic FW gain and loss: causes Periods of increased or reduced Amerasian Basin Ekman Pumping EP velocity: black Vel. of 34. 0 isohaline: blue
Arctic FW gain and loss: sources and sinks FW content change FW surface flux anomaly (in ↑) FW export anomaly (out ↓)
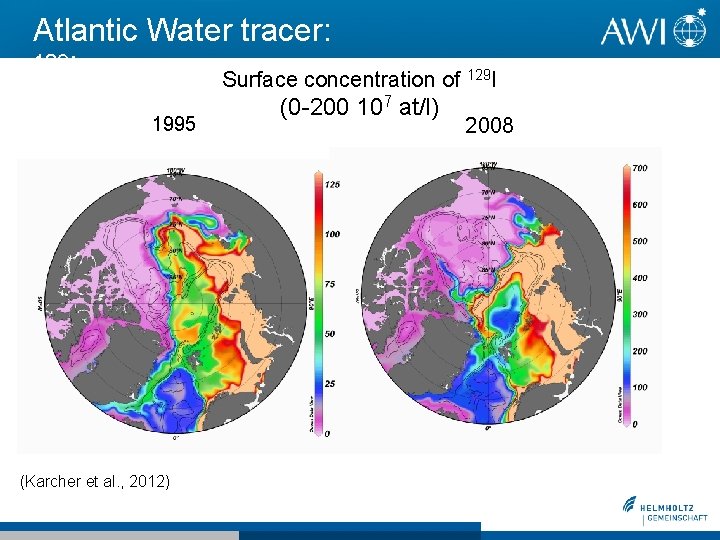
Atlantic Water tracer: 129 I Surface concentration of 129 I 1995 (Karcher et al. , 2012) (0 -200 107 at/l) 2008
Arctic Ocean surface circulation: drivers Arctic Oscillation index (cpc. ncep NOAA)
FWC in the BG: decadal wind stress curl changes (Proshutinsky et al. , 2009)
Atlantic Water tracer: 129 Mid-depth (240 m) concentration of 129 I I 1994 -96 (0 -60 107 at/l) Observations (Smith et al. , 1999) 1995 NAOSIM
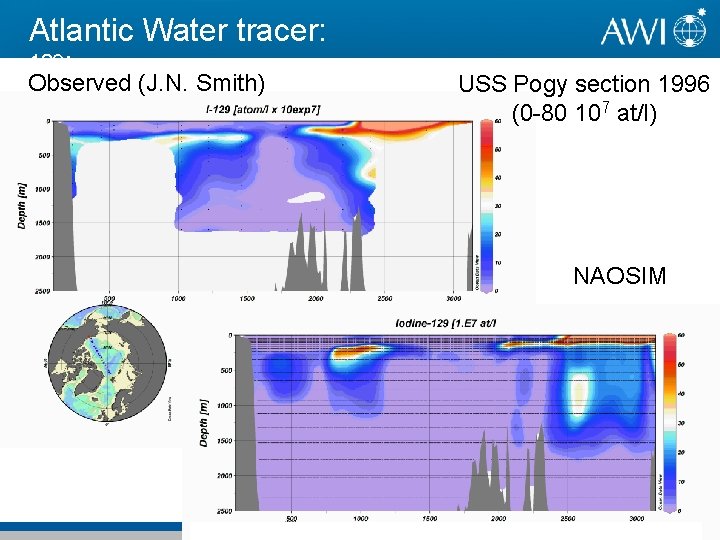
Atlantic Water tracer: 129 I Observed (J. N. Smith) USS Pogy section 1996 (0 -80 107 at/l) NAOSIM Karcher, et al. in prep