My Pyramid USDAs New Food Guidance System United


 • National Academy of Sciences, Institute of Medicine • Recommended")


 is consumed? Percent of")
")


- Slides: 62
My. Pyramid USDA’s New Food Guidance System United States Department of Agriculture Center for Nutrition Policy & Promotion
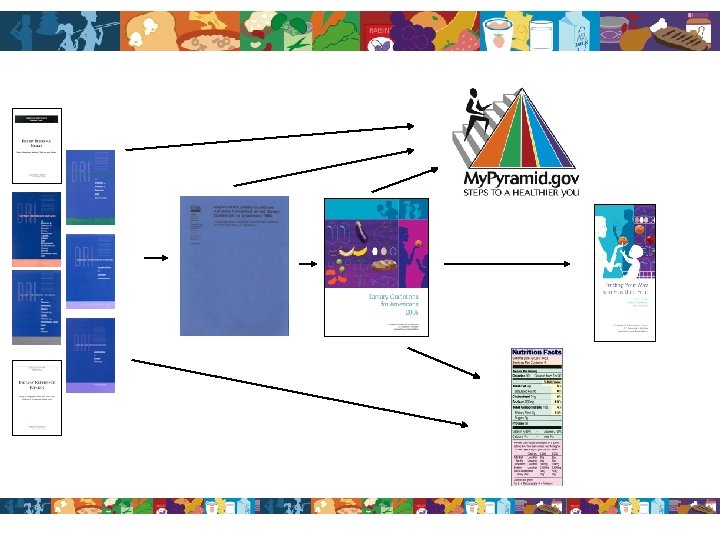
History of USDA’s Food Guidance Food for Young Children 1992 1916 1940 s 1970 s 2005 1950 s-1960 s
--1992 -Food Guide Pyramid
--2005 -My. Pyramid
Reasons for Revising— Updating the Science • To ensure that the guidance reflects the latest nutrition science – New nutrient standards—DRI – New Dietary Guidelines – Food consumption and composition data
Reasons for Revising— Improving Implementation • To improve the Pyramid’s effectiveness with consumers – Motivational tools—new graphic and slogan – Educational tools—education framework, consumer messages, website, and interactive tools
Dietary Reference Intakes (DRIs) • National Academy of Sciences, Institute of Medicine • Recommended intake levels for vitamins, minerals, and macronutrients • Current recommendations issued from 1997 -2004
Dietary Guidelines for Americans, 2005 • Dietary recommendations for health promotion and chronic disease prevention • Based on Dietary Guidelines Advisory Committee report, public comments • For policymakers, health professionals
Guiding Principles— Unchanged Evolutionary Flexible Practical Useful Overall Health Realistic Up-to-Date Research Total Diet
Stages in Development Science base developed— 2001 to 2004 • Technical analysis process to establish the food intake patterns—“what and how much to eat” • Completed in concert with development of the 2005 Dietary Guidelines Consumer presentation developed— 2004 to 2005 • Food guidance system includes motivational and educational tools • Messages and materials for consumers and professionals
Developing My. Pyramid Food Intake Patterns
Developing Food Intake Patterns 1. 2. 3. Determine calorie needs Set nutrient goals Calculate nutrient profiles for each food group, based on • Nutrient content of foods in group • Food consumption 4. Construct food patterns that meet goals
Determine Calorie Needs Estimated Energy Requirements* for males *From the National Academy of Sciences, Institute of Medicine Dietary Reference Intakes Macronutrient Report
Set Nutrient Goals What level of nutrients should each food intake pattern strive for? • Goals based on Dietary Reference Intakes* and/or Dietary Guidelines standards for – 9 Vitamins – 8 Minerals – 8 Macronutrients (protein, carbohydrates, fats) • Separate nutrient goals set for each age/sex group based on their needs *From the National Academy of Sciences Institute of Medicine
Calculate Nutrient Profiles Determine amount of a nutrient each food group provides For example: What is the vitamin A content of a typical dark green vegetable? Cooked Spinach 943 µg per cup Cooked Broccoli 153 µg per cup
Nutrient Profiles How much of each dark green vegetable (DGV) is consumed? Percent of total DGV consumption Cooked Spinach Cooked Broccoli All other DGV
Nutrient Profiles Calculate weighted average of vitamin A in DGV Result (943 x. 15) + (153 x. 36) + … +. . . , etc. = 334 µg/cup Spinach Broccoli Other DGV
Nutrient Profiles • A profile is calculated for all nutrients in each food group and subgroup. • Calculations are based on “nutrient dense forms” of each food—lean or lowfat, with no added sugar Nutrient Likelihood of profile of = food group Nutrient Sum contribution of each food X each n being eaten
Construct Food Intake Patterns • Establish initial amount from each food group • Compare resulting nutrient content to nutritional goals • Change amounts from food groups stepwise – Identify groups or subgroups that are the most feasible nutrient sources – Check amounts recommended against typical consumption • Remaining calories after nutrient needs were met were identified as “discretionary calories”
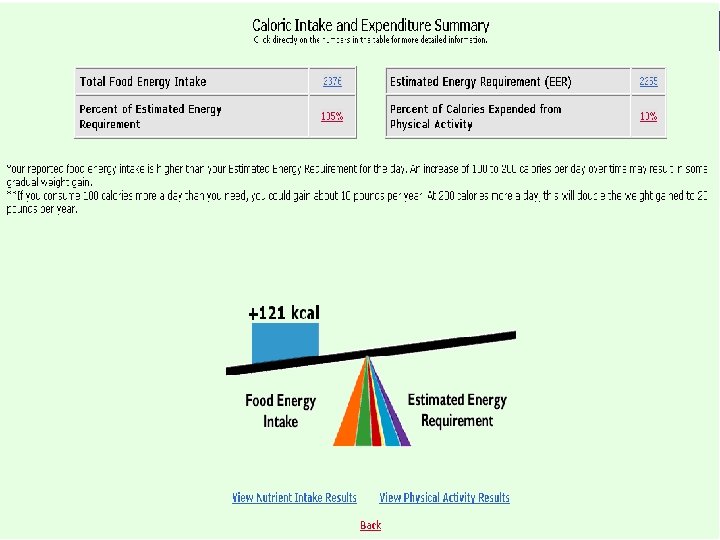
Discretionary Calories A new concept first described by the 2005 Dietary Guidelines Advisory Committee Discretionary Essential calories* = Total estimated energy — requirement *Essential calories are the calories needed to meet nutrient requirements when consuming foods in lean, low-fat, and no-added-sugar forms.
Discretionary Calories May be used to: • Increase amount of food selected from a food group • Consume foods that are not in the lowest fat form—such as 2% milk or medium-fat meat or items that contain added sugars • Add oil, fat, or sugar to foods • Consume alcohol (for those who consume alcohol)
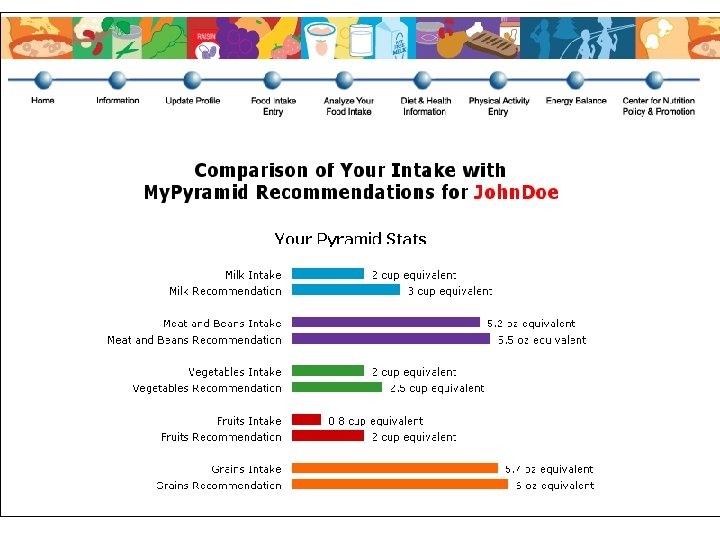
My. Pyramid Recommendations Compared to Consumption Bars show percent change needed in consumption to meet recommendations Increases Current Consumpti on Fruits Vegetables Grains Meat & Beans Milk Decreases
Fat, Oil & Added Sugars Allowances Compared to Consumption Bars show percent change needed in consumption to meet recommendations Increases Current Consumpti on Decreases Solid fats Oils Added sugars
Vegetable Recommendations Compared to Consumption Consumed* 22% Recommended* 45% Dark Green Vegetables Orange Vegetables Legumes Other Vegetables Starchy Vegetables *Females 31 -50
Grain Recommendations Compared to Consumption Consumed* Whole Grains Recommended* Refined Grains *Females 31 -50
Food Intake Patterns Completed in concert with development of Dietary Guidelines • Published in 2005 Dietary Guidelines • 12 patterns—ranging from 1000 to 3200 calories—to meet varied needs. www. healthierus. gov/dietaryguidelines
Developing My. Pyramid Consumer Presentation
Developing My. Pyramid’s Consumer Presentation • Systems approach for communications • Input from stakeholders • Consumer research – Understanding of messages – Appeal of potential designs/messages • Development of materials
Systems Approach for Communications To Include • Graphic symbol and slogan • Consumer messages • Interactive guidance tools—personalized • Print materials • Materials for professionals – Food intake patterns – Educational framework
Consumer Research Understanding of original Pyramid and potential messages Sample findings: • “Healthy eating” means variety, moderation, and eating fruits and vegetables. • Pyramid depicts a healthy diet, but it is complicated • Limited understanding of food group placement on graphic • Need help understanding whole grains, types of fat • A “serving” is “what is on my plate”
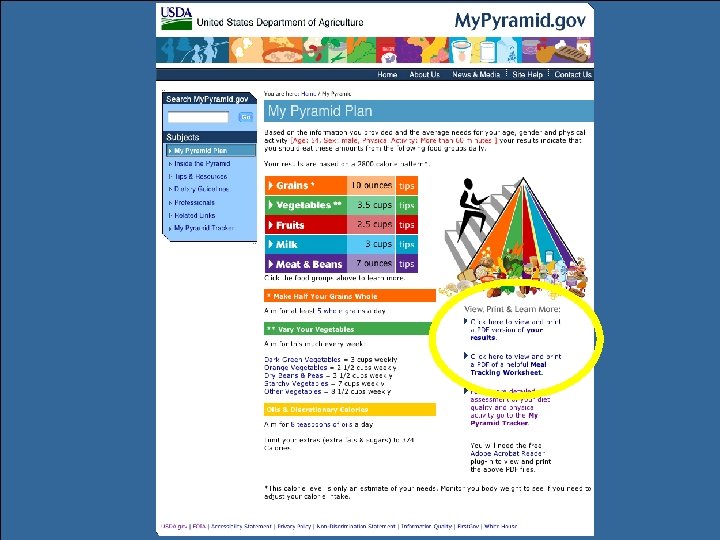
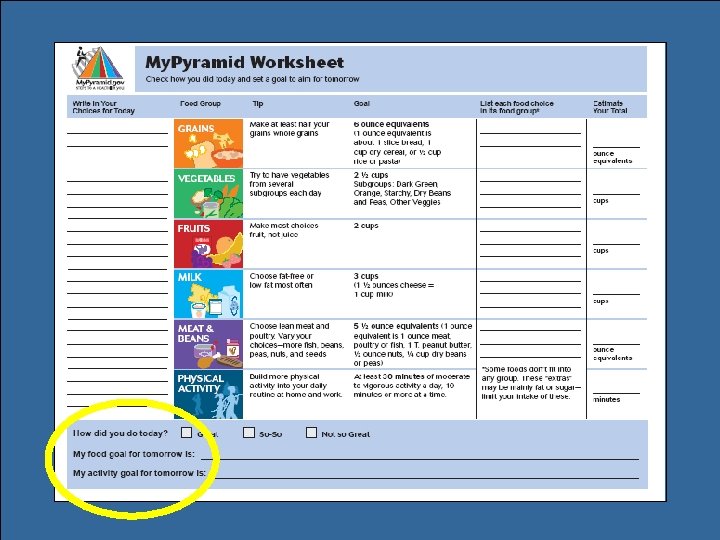
Daily Amounts in cups or ounces
Consumer Research Graphic and Slogan Development • • • Several rounds of qualitative testing Explored consumer reactions and appeal of images Tested a variety of graphic images Consumers preferred a pyramid-like shape Slogans and key messages also tested
Final Graphic Design Activity Proportionality Moderation Variety Personalization Gradual Improvement
Message: Variety In the Dietary Guidelines: • Consume a variety of nutrient-dense foods and beverages within and among the basic food groups. In My. Pyramid graphic: • Color bands represent that all food groups are needed each day for health.
Food Groups are Color Coded
Message: Proportionality In the Dietary Guidelines: • Adopt a balanced eating pattern. – Sufficient amount of fruits and vegetables, – 3 or more ounce equivalents of whole-grain products per day – 3 cup equivalents per day of fat-free or low-fat milk or milk products. In My. Pyramid graphic: • Differing widths of the color bands suggest about how much food should be eaten from each group.
Message: Moderation In the Dietary Guidelines: • Limit intake of saturated and trans fats, and choose products low in these fats. • Make choices of meat, poultry, dry beans, and milk products that are lean, low-fat, or fat-free. • Choose and prepare foods and beverages with little added sugars or calorie sweeteners. In My. Pyramid graphic: • Food group bands narrow from bottom to top suggesting to eat nutrient-dense forms of foods.
Message: Physical Activity In the Dietary Guidelines: • Engage in regular physical activity and reduce sedentary activities to promote health, psychological well-being, and a healthy body weight. In My. Pyramid graphic: • Steps and person on them symbolize that physical activity should be a part of everyday healthy living.
Additional Messages in the My. Pyramid Graphic To foster implementation Personalization: • The name “My. Pyramid” suggests an individual approach. • The person climbing the steps mentally links each viewer to the image. Gradual Improvement: • The slogan “Steps to a Healthier You” suggests that improvement should happen in stages, over time.
Key food group messages from the Dietary Guidelines and My. Pyramid: Focus on fruits. Vary your veggies. Get your calcium-rich foods. Make half your grains whole. Go lean with protein. Know the limits on fats, salt, and sugars.
Using My. Pyramid Consumer Materials
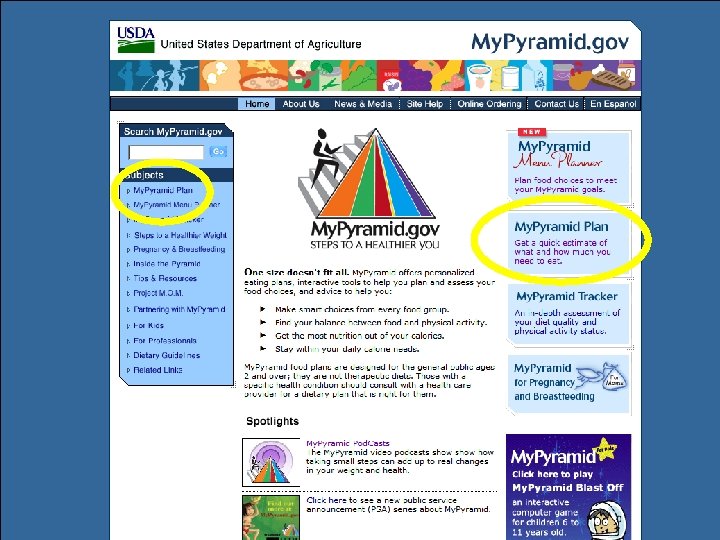
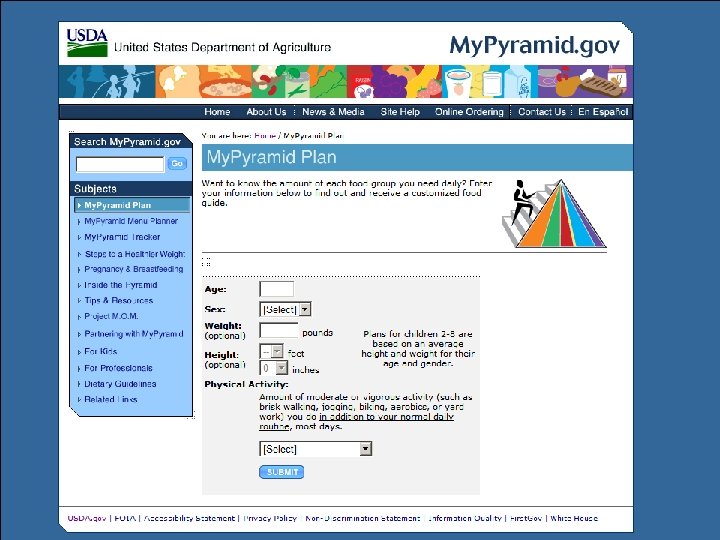
Consumer materials Graphic image and slogan Poster Mini Poster Website: My. Pyramid. gov My. Pyramid Plan My. Pyramid Tracker Inside My. Pyramid In development: Kids materials Spanish version
Print materials: Mini Poster
Print materials: Mini Poster
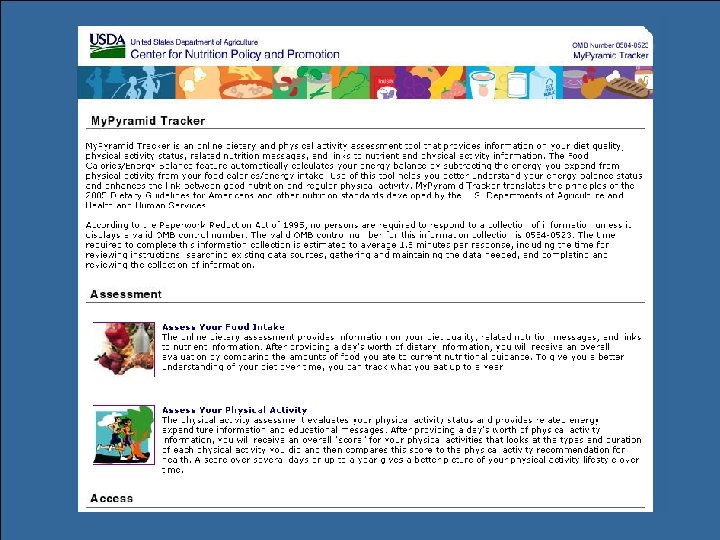
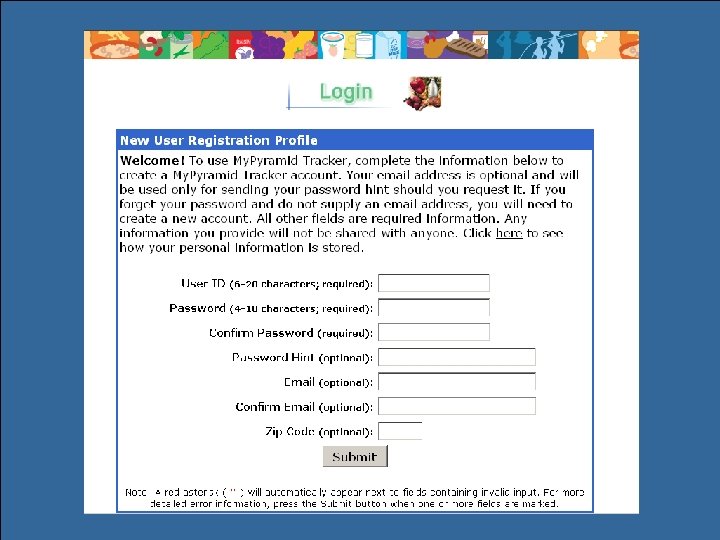
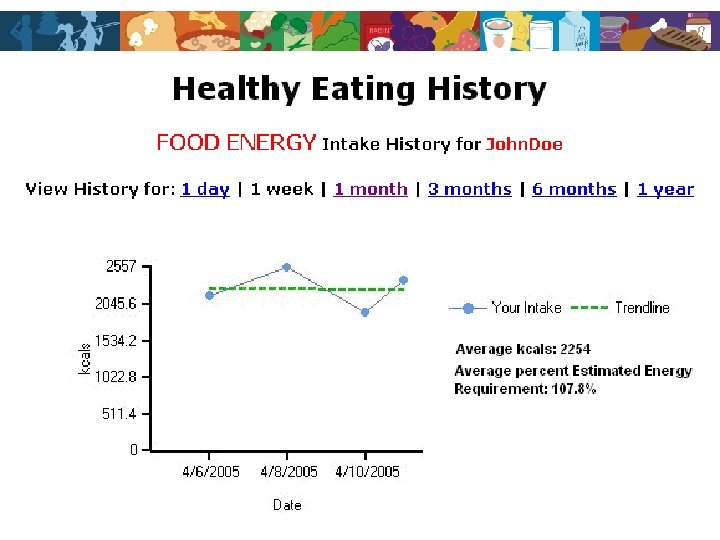
My. Pyramid Tracker A tool for those desiring a more advanced analysis of their food intake and physical activity
Adapting My. Pyramid The professionals’ role Meeting varied needs • Audiences—Older Americans, low-literacy, Spanish speaking • Food preferences—Vegetarian, lactose-intolerant, ethnic • Situations—Eating out, carrying in, cooking at home
Implementation • Implementation is the challenge ahead. • Health/education professionals are vital for success. • It will be an ongoing process. • Working together, we can help Americans to be healthier.