Monsoon Rainfall Forecasting Pankaj Jain IIT Kanpur Introduction



- Slides: 59
Monsoon Rainfall Forecasting Pankaj Jain IIT Kanpur
Introduction • Monsoon prediction is clearly of great importance for India • One would like to make Ølong term prediction, i. e. predict total monsoon rainfall a few weeks or months in advance Øshort term prediction, i. e. predict rainfall over different locations a few days in advance
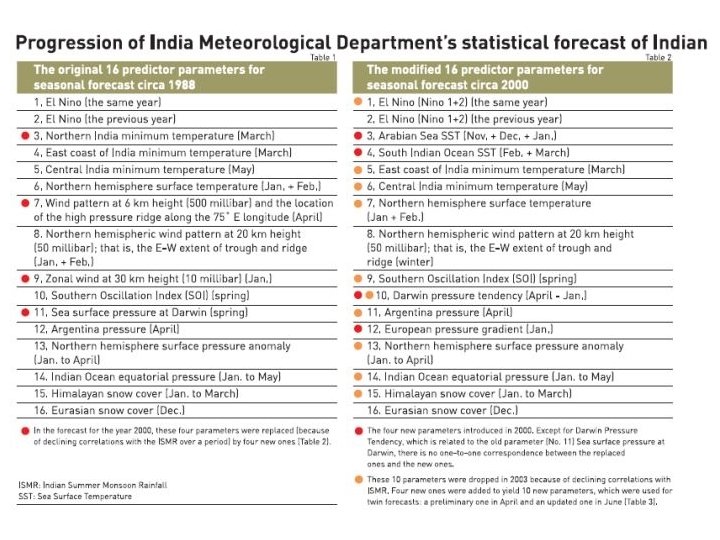
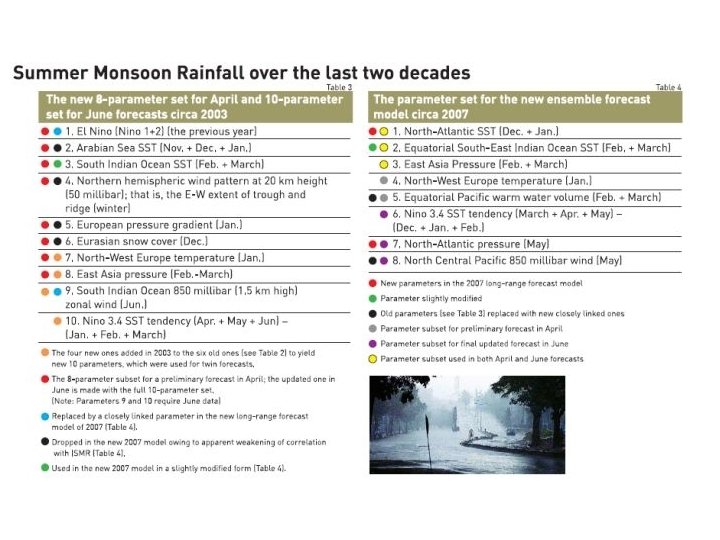
Predicting total monsoon rainfall (June-September) • predicted by using its correlation with observed parameters • The predictors keep changing with time • Several regression and neural network based models are currently available • Indian Met. Dept (IMD) provides statistical forecast in two stages, Ø March/April Ø May/June
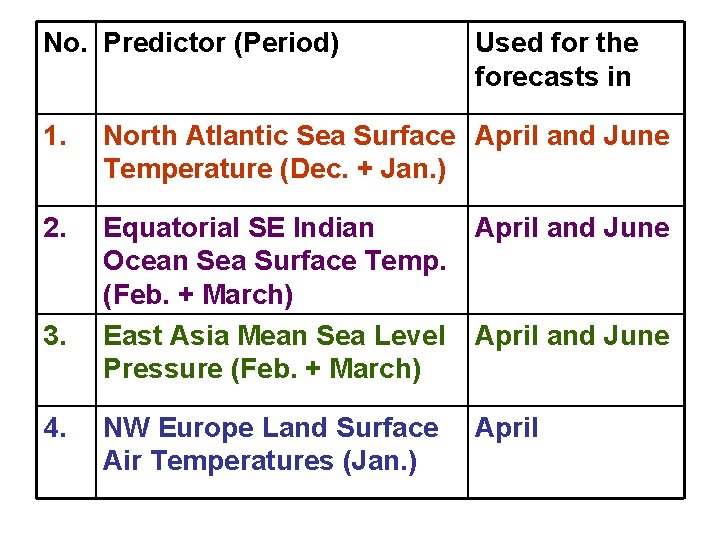
No. Predictor (Period) Used for the forecasts in 1. North Atlantic Sea Surface April and June Temperature (Dec. + Jan. ) 2. Equatorial SE Indian Ocean Sea Surface Temp. (Feb. + March) East Asia Mean Sea Level Pressure (Feb. + March) April and June NW Europe Land Surface Air Temperatures (Jan. ) April 3. 4. April and June
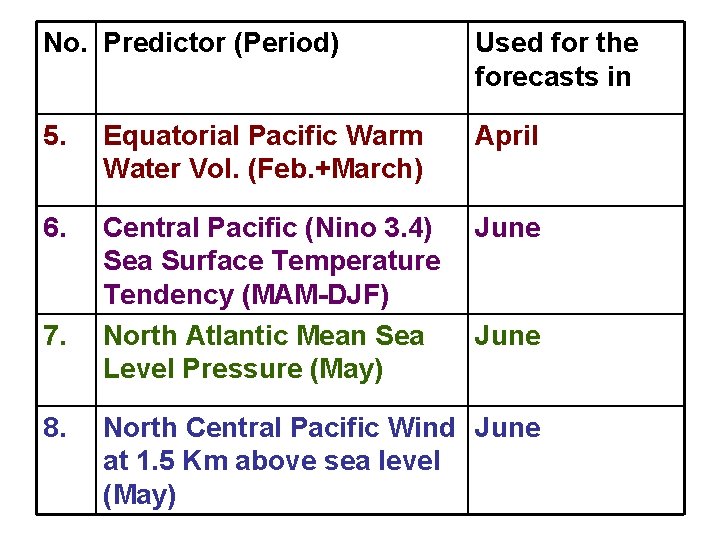
No. Predictor (Period) Used for the forecasts in 5. Equatorial Pacific Warm Water Vol. (Feb. +March) April 6. Central Pacific (Nino 3. 4) Sea Surface Temperature Tendency (MAM-DJF) North Atlantic Mean Sea Level Pressure (May) June 7. 8. June North Central Pacific Wind June at 1. 5 Km above sea level (May)
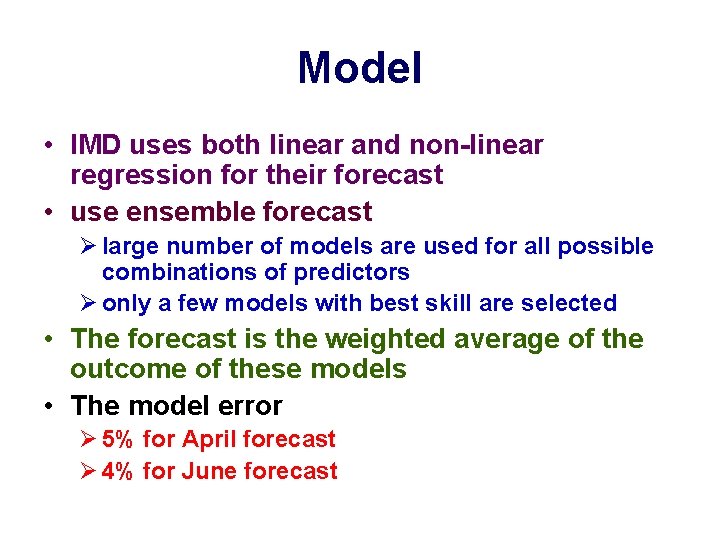
Model • IMD uses both linear and non-linear regression for their forecast • use ensemble forecast Ø large number of models are used for all possible combinations of predictors Ø only a few models with best skill are selected • The forecast is the weighted average of the outcome of these models • The model error Ø 5% for April forecast Ø 4% for June forecast
Short term Forecasting • We have been interested in forecasting daily rainfall over a particular location a few days in advance. • The government agency National Center for Medium Range Weather Forecasting (NCMRWF) provides daily forecasts, mainly to assist farmers.
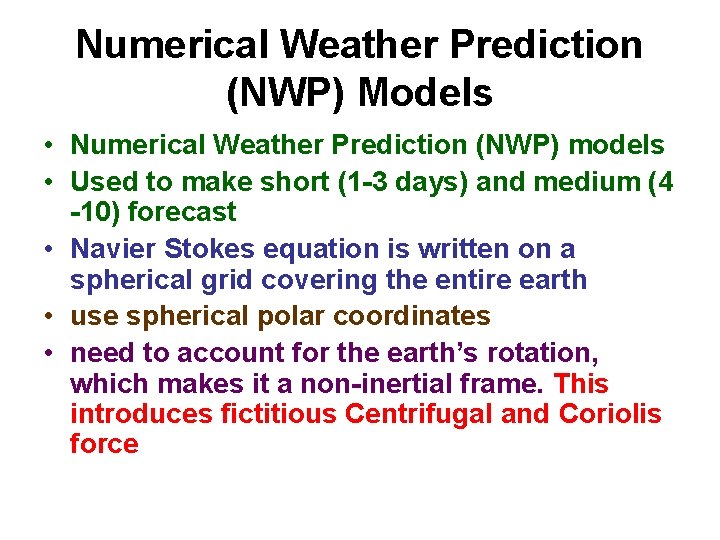
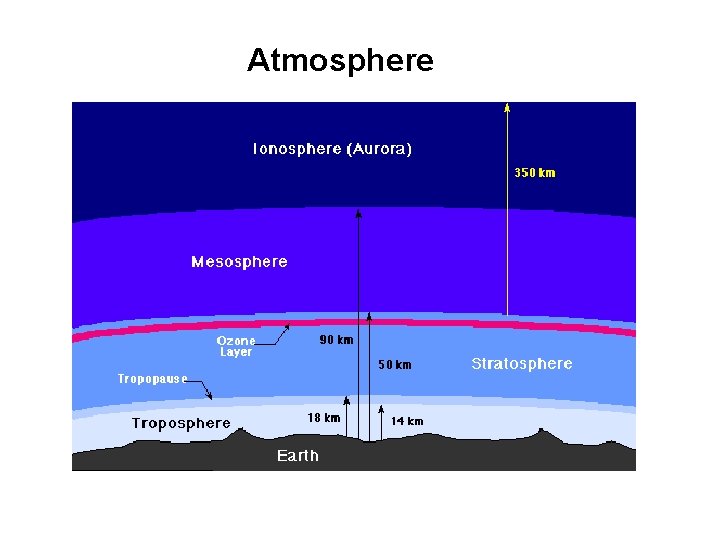
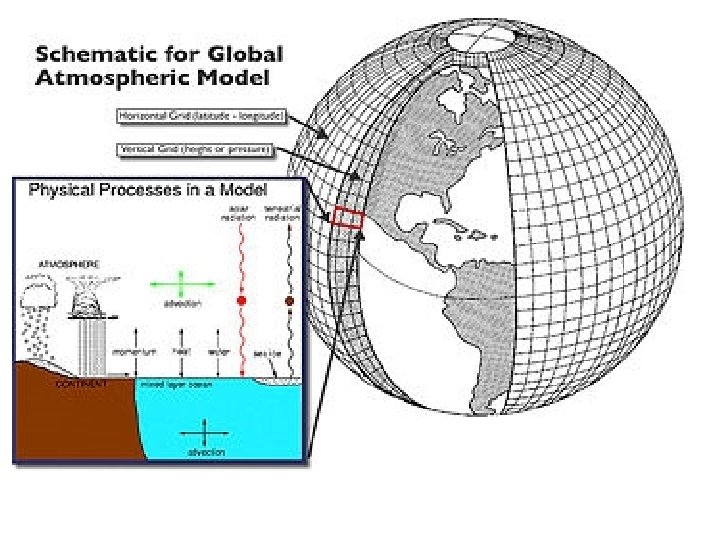
Numerical Weather Prediction (NWP) Models • Numerical Weather Prediction (NWP) models • Used to make short (1 -3 days) and medium (4 -10) forecast • Navier Stokes equation is written on a spherical grid covering the entire earth • use spherical polar coordinates • need to account for the earth’s rotation, which makes it a non-inertial frame. This introduces fictitious Centrifugal and Coriolis force
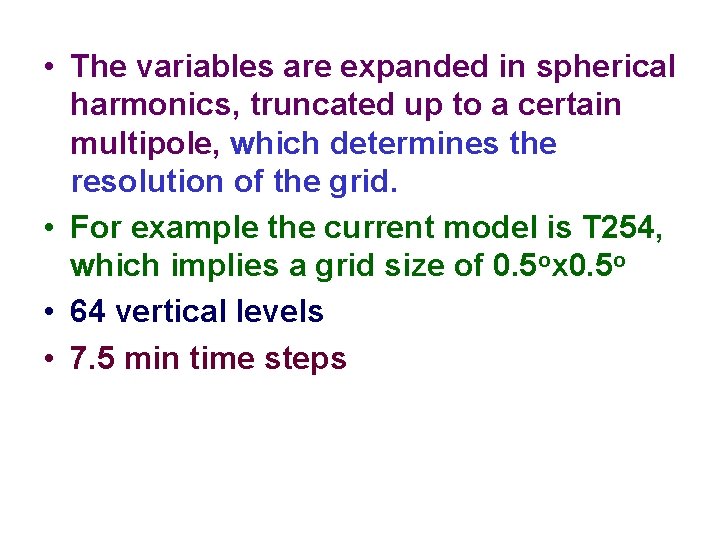
• The variables are expanded in spherical harmonics, truncated up to a certain multipole, which determines the resolution of the grid. • For example the current model is T 254, which implies a grid size of 0. 5 ox 0. 5 o • 64 vertical levels • 7. 5 min time steps
Atmosphere
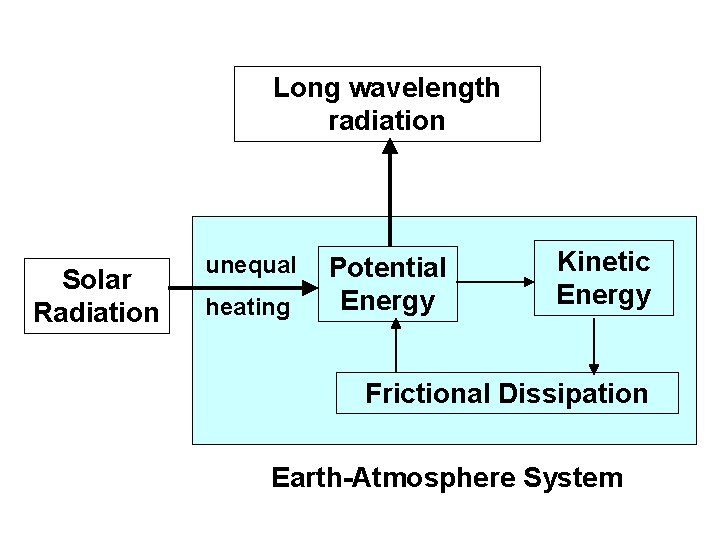
Long wavelength radiation Solar Radiation unequal heating Potential Energy Kinetic Energy Frictional Dissipation Earth-Atmosphere System
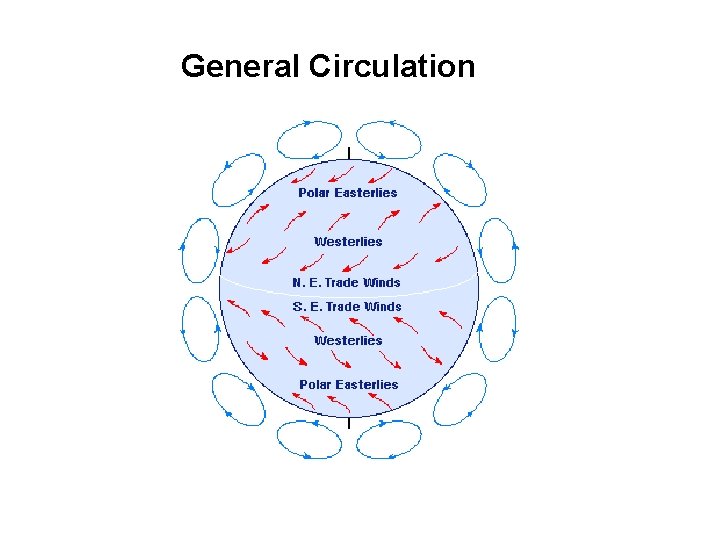
General Circulation
• The inputs to the model are the initial conditions obtained by observations throughout the earth temperature, pressure, wind velocity, humidity etc as a function of position and height
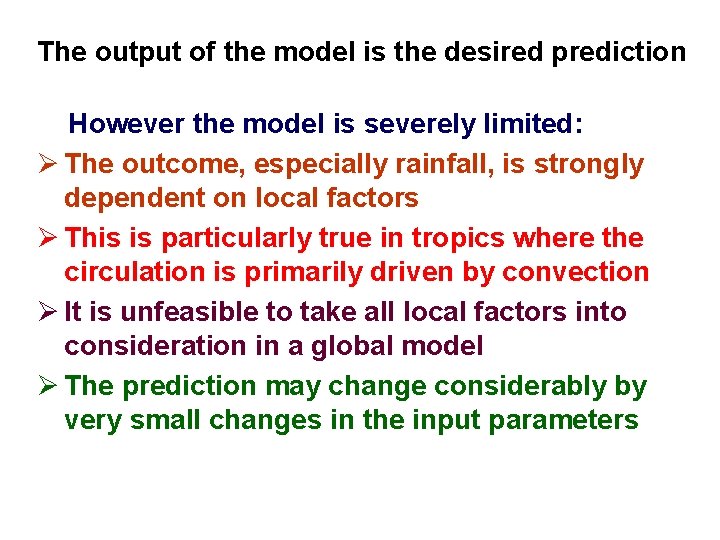
The output of the model is the desired prediction However the model is severely limited: Ø The outcome, especially rainfall, is strongly dependent on local factors Ø This is particularly true in tropics where the circulation is primarily driven by convection Ø It is unfeasible to take all local factors into consideration in a global model Ø The prediction may change considerably by very small changes in the input parameters
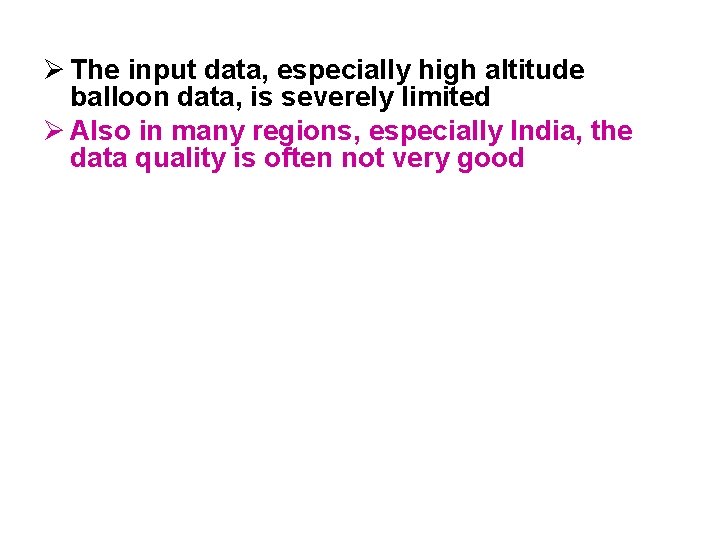
Ø The input data, especially high altitude balloon data, is severely limited Ø Also in many regions, especially India, the data quality is often not very good
There may also exist some unknown effects. An interesting possibility is effect of galactic cosmic rays This possibility has been studied by Tripathi et al (CE, IITK)
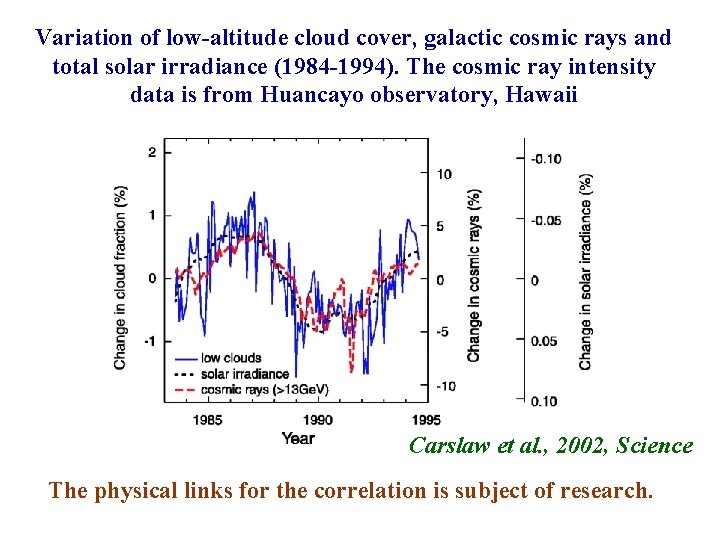
Variation of low-altitude cloud cover, galactic cosmic rays and total solar irradiance (1984 -1994). The cosmic ray intensity data is from Huancayo observatory, Hawaii Carslaw et al. , 2002, Science The physical links for the correlation is subject of research.
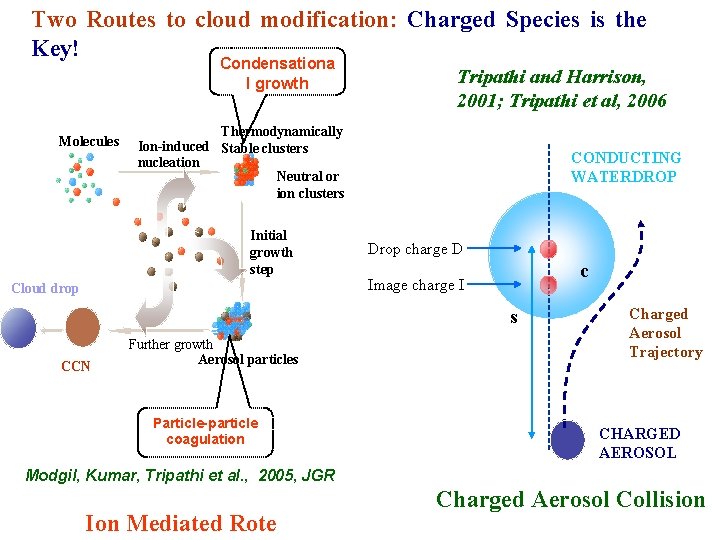
Two Routes to cloud modification: Charged Species is the Key! Condensationa l growth Molecules Tripathi and Harrison, 2001; Tripathi et al, 2006 Thermodynamically Ion-induced Stable clusters nucleation Neutral or ion clusters Initial growth step Cloud drop CONDUCTING WATERDROP Drop charge D c Image charge I s CCN Further growth Aerosol particles Particle-particle coagulation Charged Aerosol Trajectory CHARGED AEROSOL Modgil, Kumar, Tripathi et al. , 2005, JGR Ion Mediated Rote Charged Aerosol Collision
Statistical Interpretation of NWF output • It may be better to statistically correlate the model output with observations • This is the technique used by NCMWRF to predict daily rainfall a few days in advance at a particular station • The rainfall at a particular station is obtained by a rain gauge • We have been trying to determine if neural network based relationship can improve the predictability. Jain et al 1999, Jain and Jain 2002
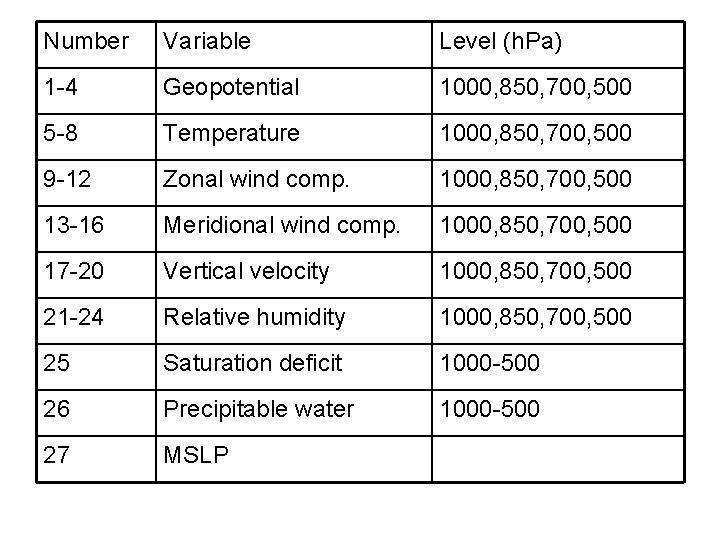
Number Variable Level (h. Pa) 1 -4 Geopotential 1000, 850, 700, 500 5 -8 Temperature 1000, 850, 700, 500 9 -12 Zonal wind comp. 1000, 850, 700, 500 13 -16 Meridional wind comp. 1000, 850, 700, 500 17 -20 Vertical velocity 1000, 850, 700, 500 21 -24 Relative humidity 1000, 850, 700, 500 25 Saturation deficit 1000 -500 26 Precipitable water 1000 -500 27 MSLP
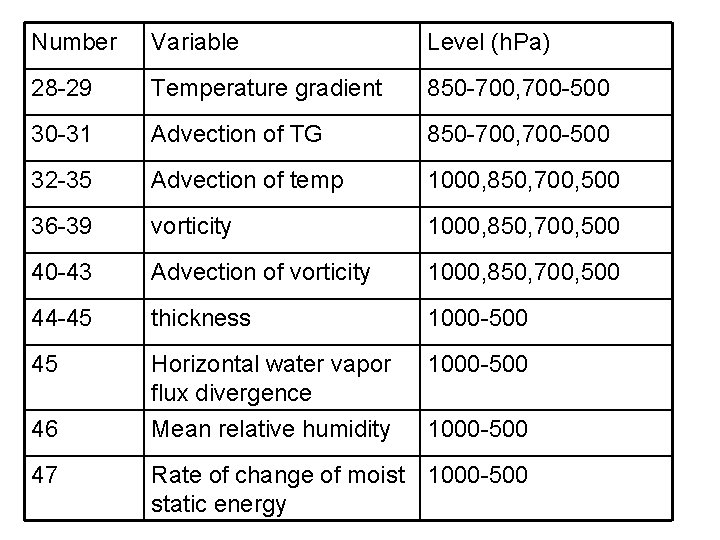
Number Variable Level (h. Pa) 28 -29 Temperature gradient 850 -700, 700 -500 30 -31 Advection of TG 850 -700, 700 -500 32 -35 Advection of temp 1000, 850, 700, 500 36 -39 vorticity 1000, 850, 700, 500 40 -43 Advection of vorticity 1000, 850, 700, 500 44 -45 thickness 1000 -500 45 Horizontal water vapor flux divergence Mean relative humidity 1000 -500 46 47 1000 -500 Rate of change of moist 1000 -500 static energy
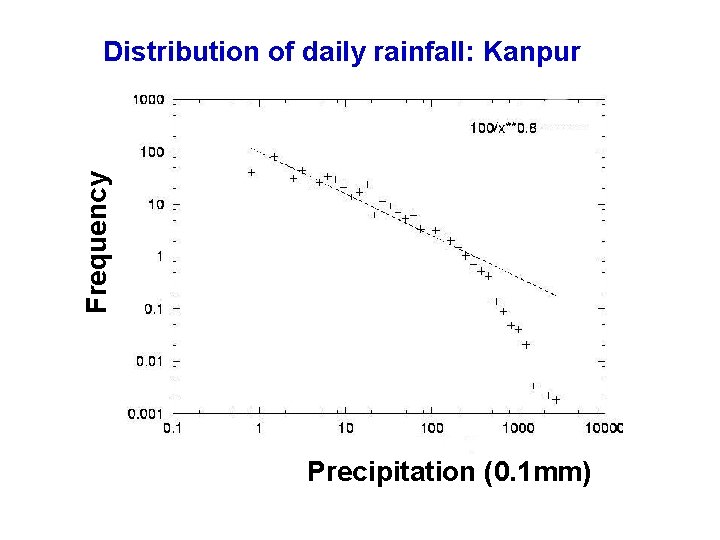
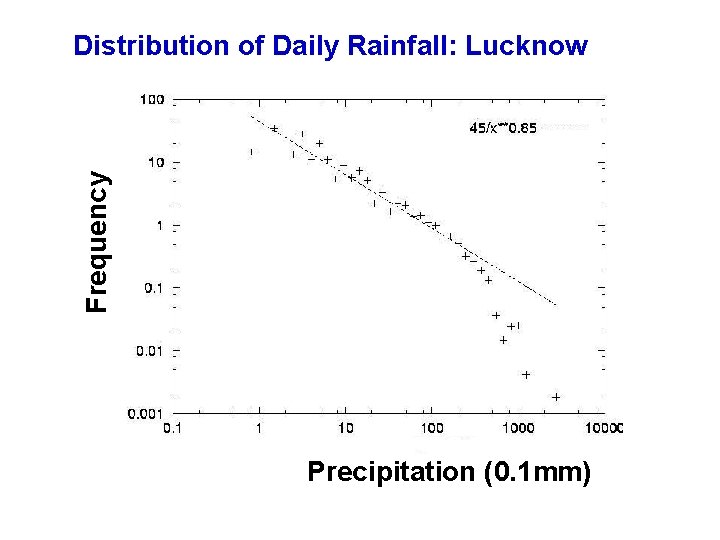
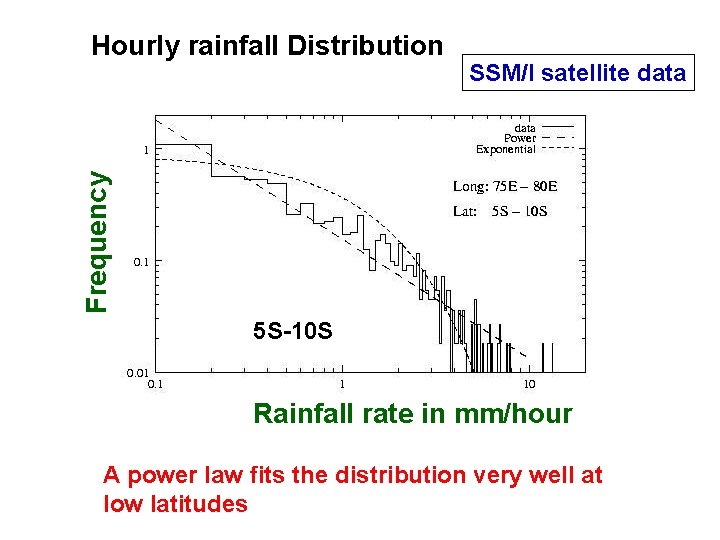
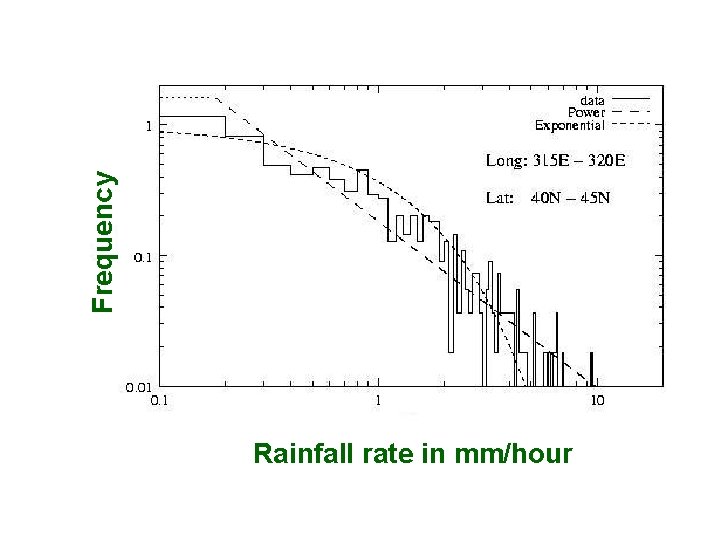
Scale invariance in daily rainfall • The predictability of the quantity can often be judged by its distribution function. • If the variable shows a normal distribution then large fluctuations from the mean value are improbable • However a power law distribution f(x) = x implies no characteristic scale (scale invariant) indicates an underlying chaotic behaviour
Frequency Distribution of daily rainfall: Kanpur Precipitation (0. 1 mm)
Frequency Distribution of Daily Rainfall: Lucknow Precipitation (0. 1 mm)
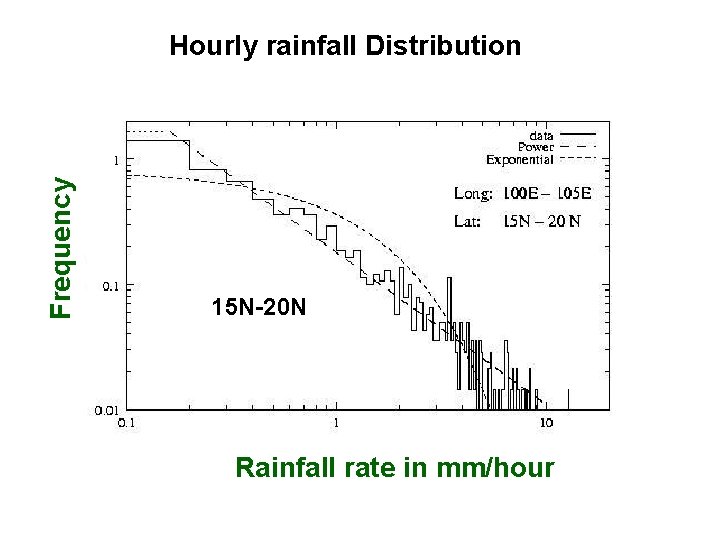
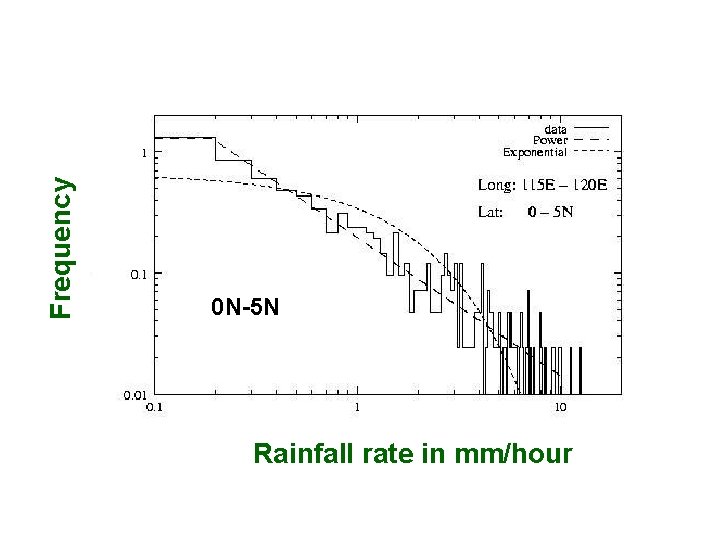
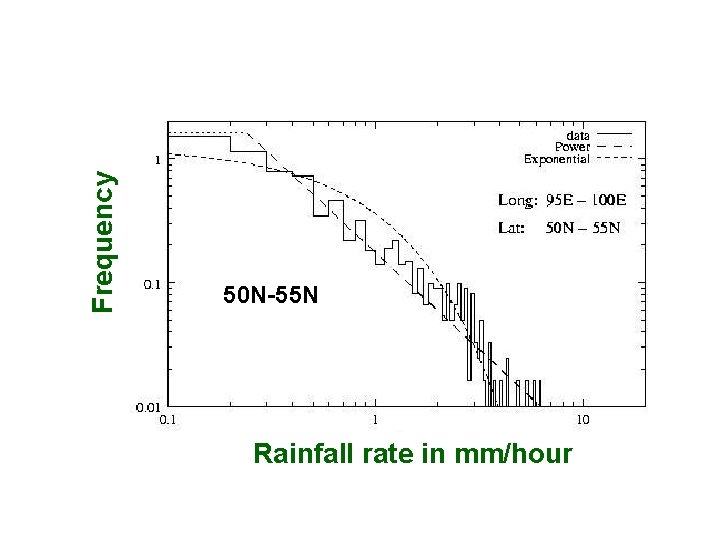
SSM/I satellite data Frequency Hourly rainfall Distribution 5 S-10 S Rainfall rate in mm/hour A power law fits the distribution very well at low latitudes
Frequency Hourly rainfall Distribution 15 N-20 N Rainfall rate in mm/hour
Frequency 0 N-5 N Rainfall rate in mm/hour
Frequency 50 N-55 N Rainfall rate in mm/hour
Frequency Rainfall rate in mm/hour
short term rainfall over a localized region shows a scale invariant power law distribution Jain and Jain 2002 Peters et al (2002) show this for individual events at the Baltic coast
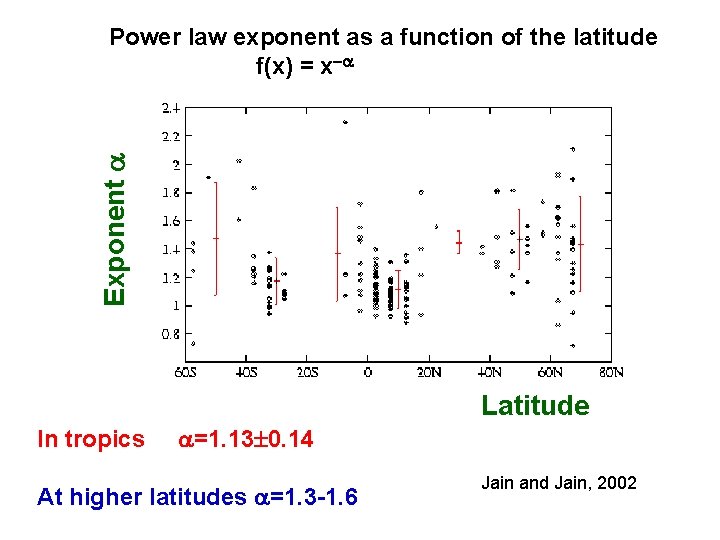
Exponent Power law exponent as a function of the latitude f(x) = x Latitude In tropics =1. 13 0. 14 At higher latitudes =1. 3 -1. 6 Jain and Jain, 2002
• It is better to define variable which we may have a better chance of predicting. • Rather then using a single rain gauge it may be more appropriate to use the rainfall averaged over many rain gauges. • The NWF has a grid size of order 100 x 100 Km. Hence its predictions should be interpreted as the average over the grid rather than for a particular location.
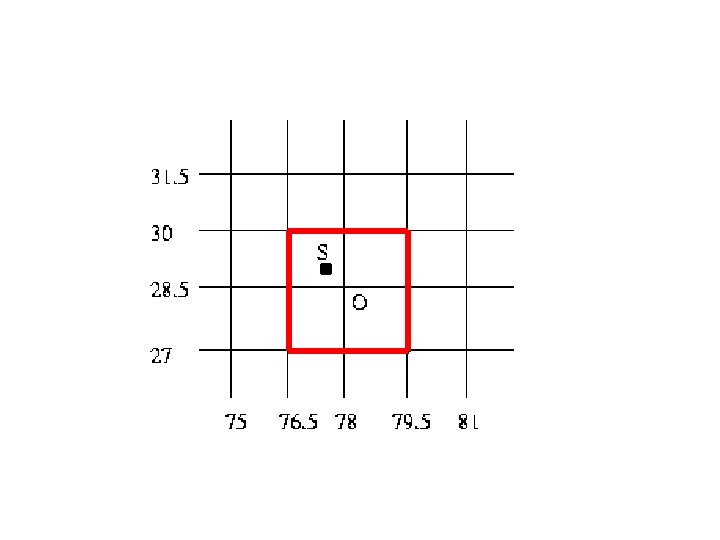
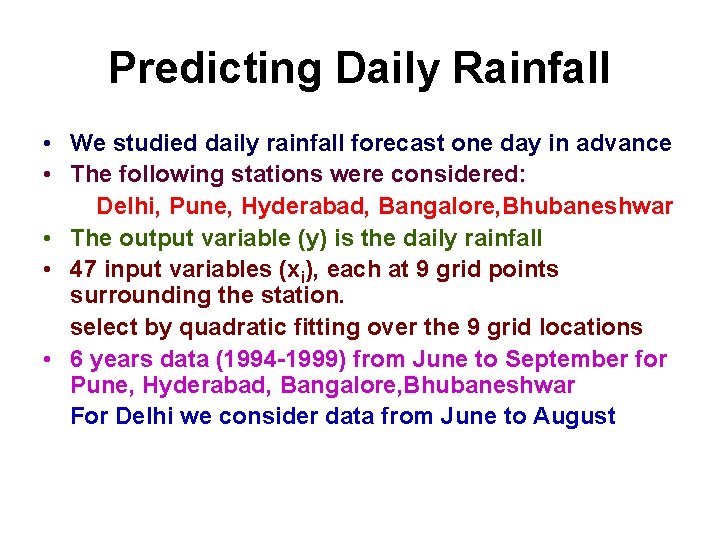
Predicting Daily Rainfall • We studied daily rainfall forecast one day in advance • The following stations were considered: Delhi, Pune, Hyderabad, Bangalore, Bhubaneshwar • The output variable (y) is the daily rainfall • 47 input variables (xi), each at 9 grid points surrounding the station. select by quadratic fitting over the 9 grid locations • 6 years data (1994 -1999) from June to September for Pune, Hyderabad, Bangalore, Bhubaneshwar For Delhi we consider data from June to August
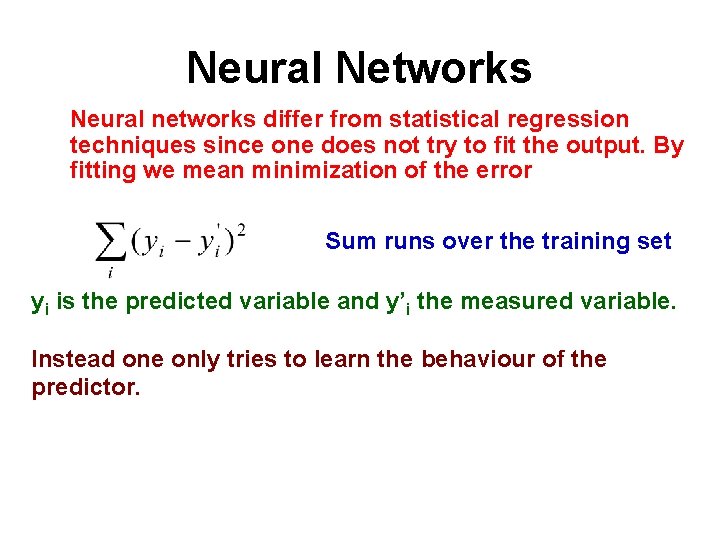
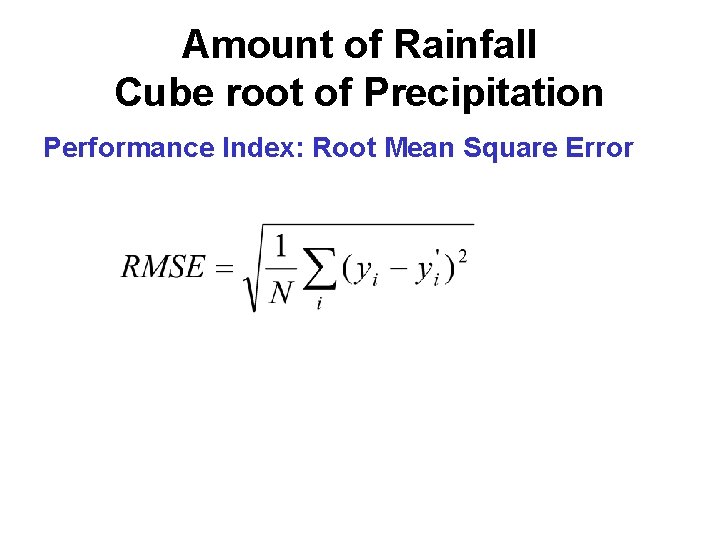
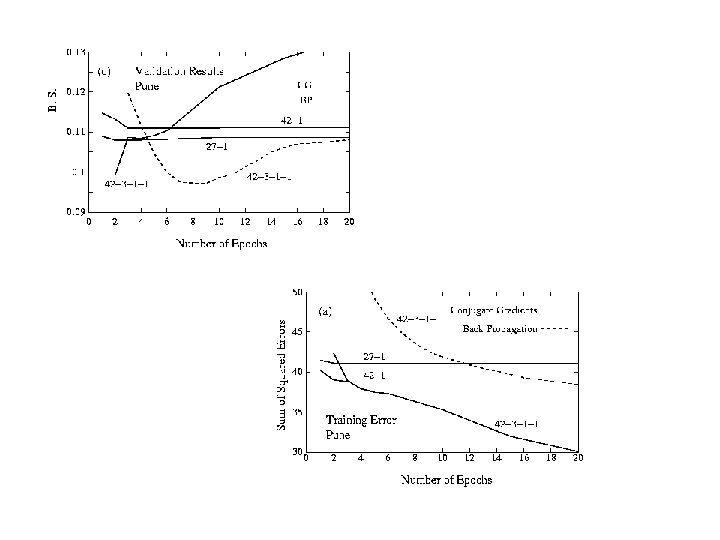
Neural Networks Neural networks differ from statistical regression techniques since one does not try to fit the output. By fitting we mean minimization of the error Sum runs over the training set yi is the predicted variable and y’i the measured variable. Instead one only tries to learn the behaviour of the predictor.
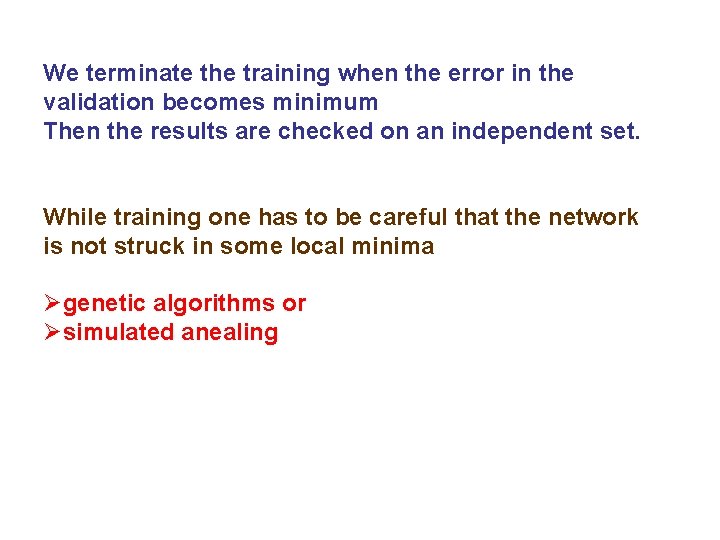
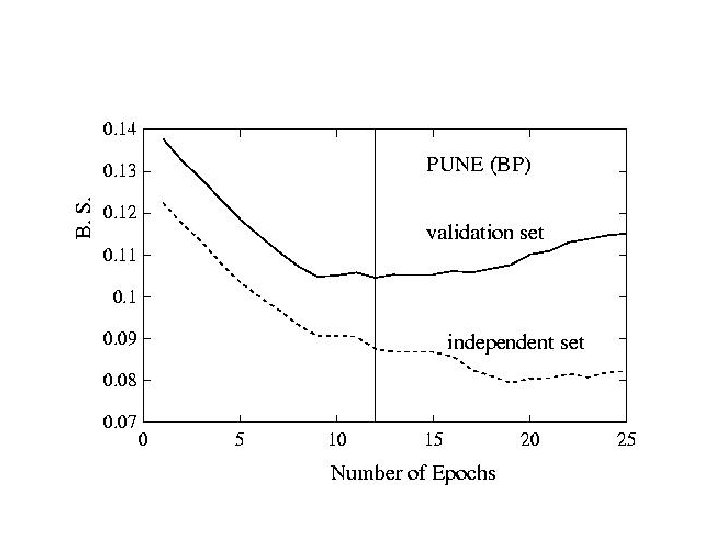
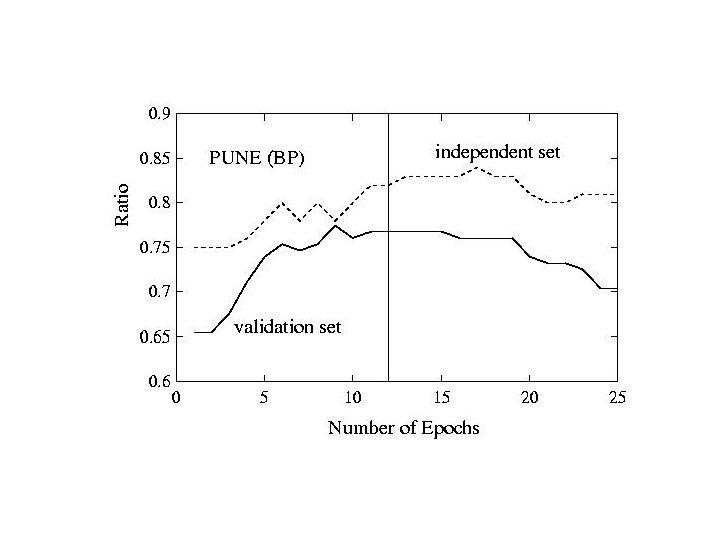
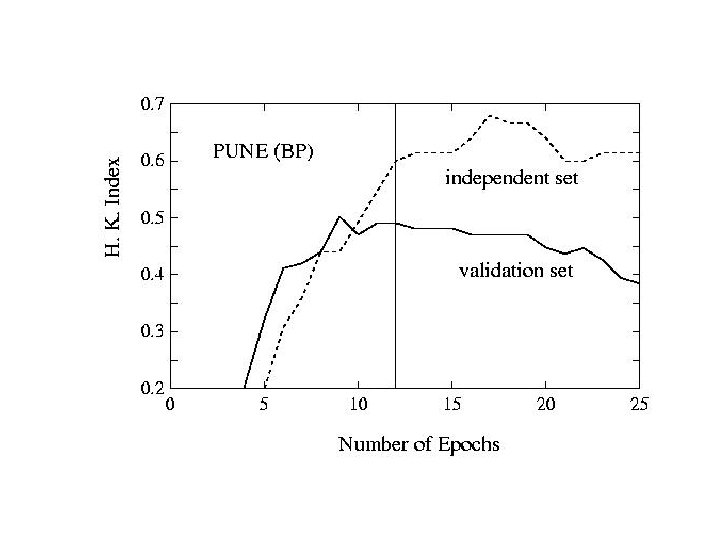
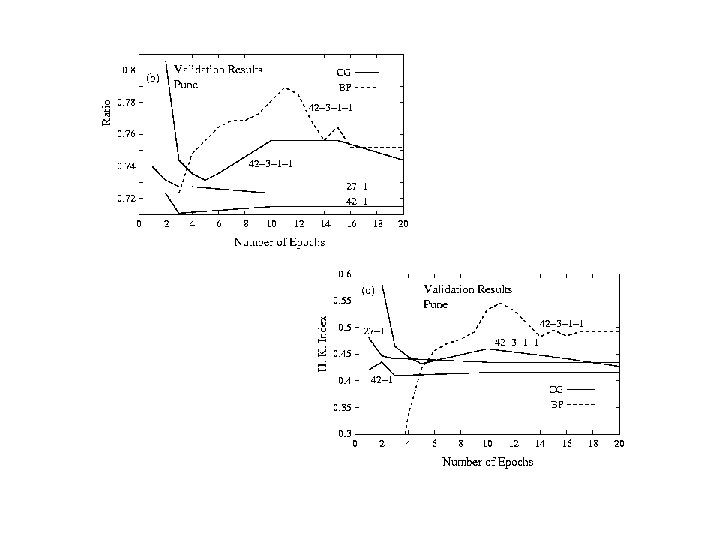
We terminate the training when the error in the validation becomes minimum Then the results are checked on an independent set. While training one has to be careful that the network is not struck in some local minima Øgenetic algorithms or Øsimulated anealing
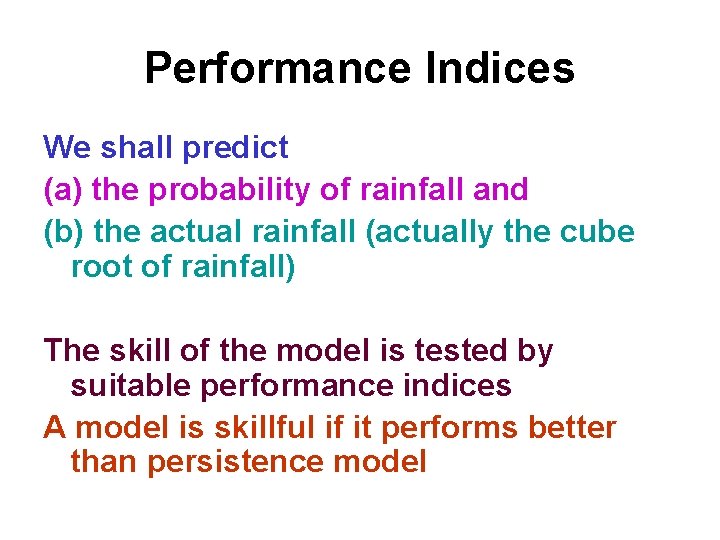
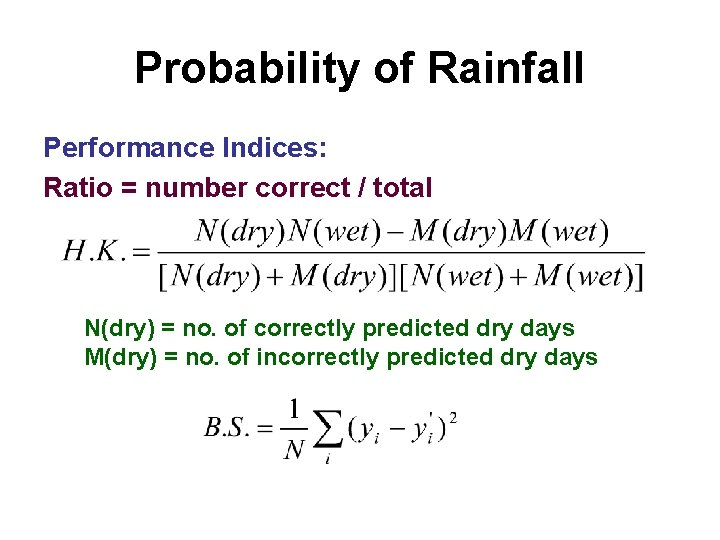
Performance Indices We shall predict (a) the probability of rainfall and (b) the actual rainfall (actually the cube root of rainfall) The skill of the model is tested by suitable performance indices A model is skillful if it performs better than persistence model
Probability of Rainfall Performance Indices: Ratio = number correct / total N(dry) = no. of correctly predicted dry days M(dry) = no. of incorrectly predicted dry days
Amount of Rainfall Cube root of Precipitation Performance Index: Root Mean Square Error
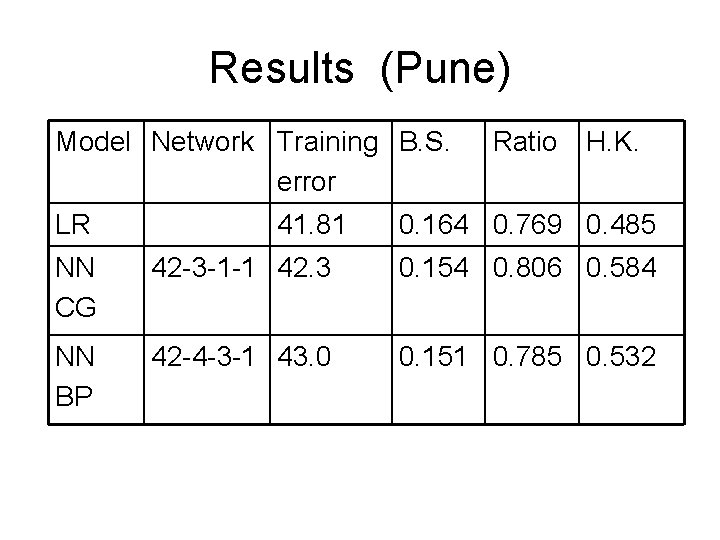
Results (Pune) Model Network Training B. S. error LR 41. 81 Ratio H. K. 0. 164 0. 769 0. 485 NN CG 42 -3 -1 -1 42. 3 0. 154 0. 806 0. 584 NN BP 42 -4 -3 -1 43. 0 0. 151 0. 785 0. 532
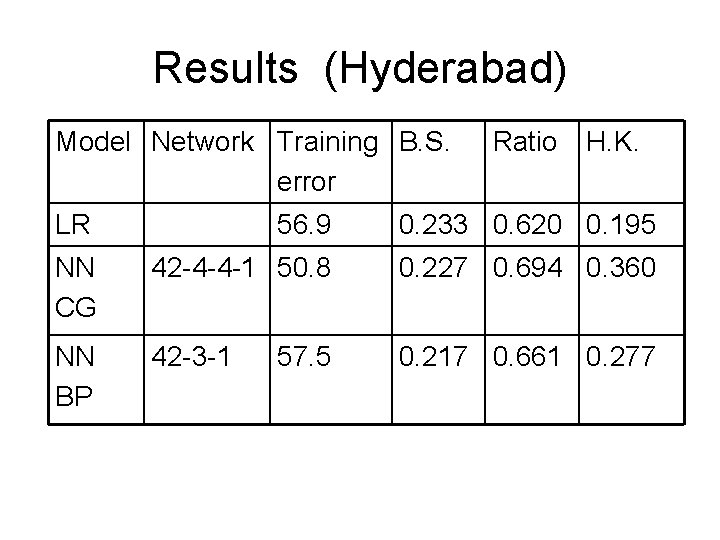
Results (Hyderabad) Model Network Training B. S. error Ratio H. K. LR 56. 9 0. 233 0. 620 0. 195 NN CG 42 -4 -4 -1 50. 8 0. 227 0. 694 0. 360 NN BP 42 -3 -1 0. 217 0. 661 0. 277 57. 5
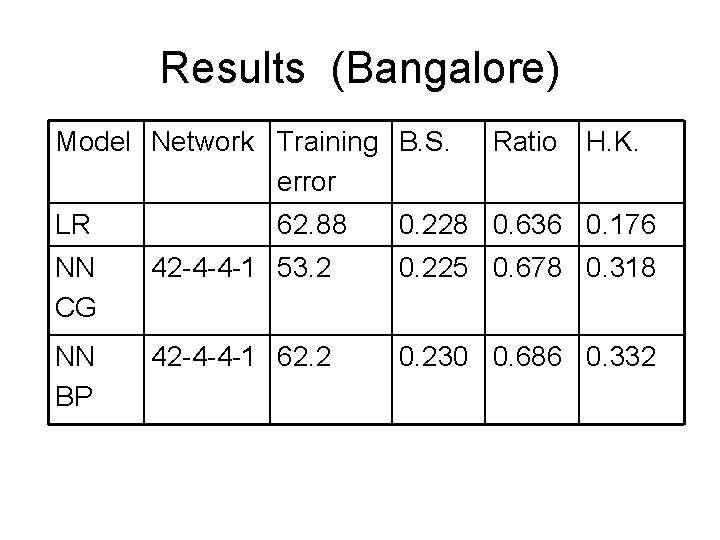
Results (Bangalore) Model Network Training B. S. error LR 62. 88 Ratio H. K. 0. 228 0. 636 0. 176 NN CG 42 -4 -4 -1 53. 2 0. 225 0. 678 0. 318 NN BP 42 -4 -4 -1 62. 2 0. 230 0. 686 0. 332
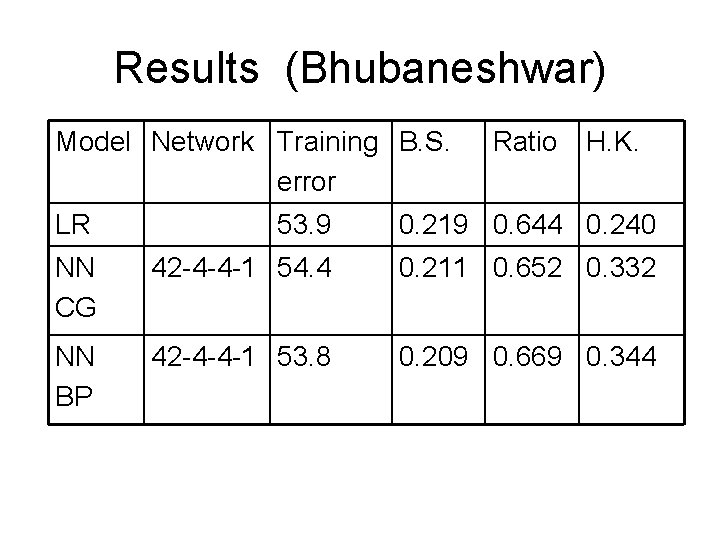
Results (Bhubaneshwar) Model Network Training B. S. error Ratio H. K. LR 53. 9 0. 219 0. 644 0. 240 NN CG 42 -4 -4 -1 54. 4 0. 211 0. 652 0. 332 NN BP 42 -4 -4 -1 53. 8 0. 209 0. 669 0. 344
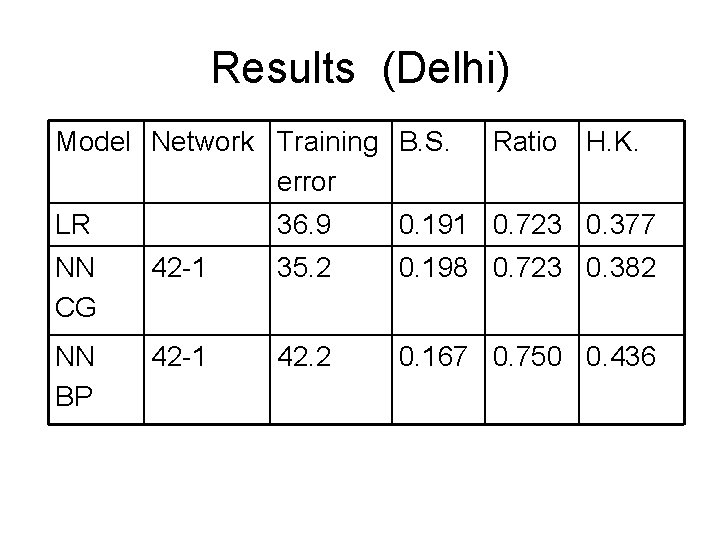
Results (Delhi) Model Network Training B. S. error LR Ratio H. K. 36. 9 0. 191 0. 723 0. 377 NN CG 42 -1 35. 2 0. 198 0. 723 0. 382 NN BP 42 -1 42. 2 0. 167 0. 750 0. 436
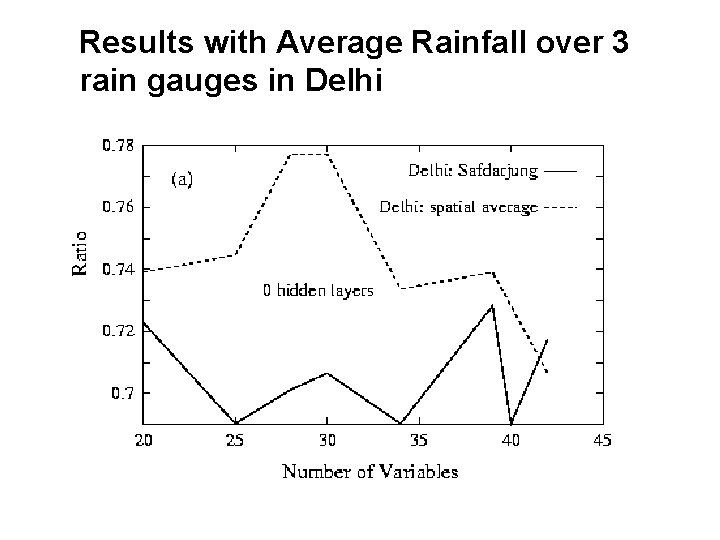
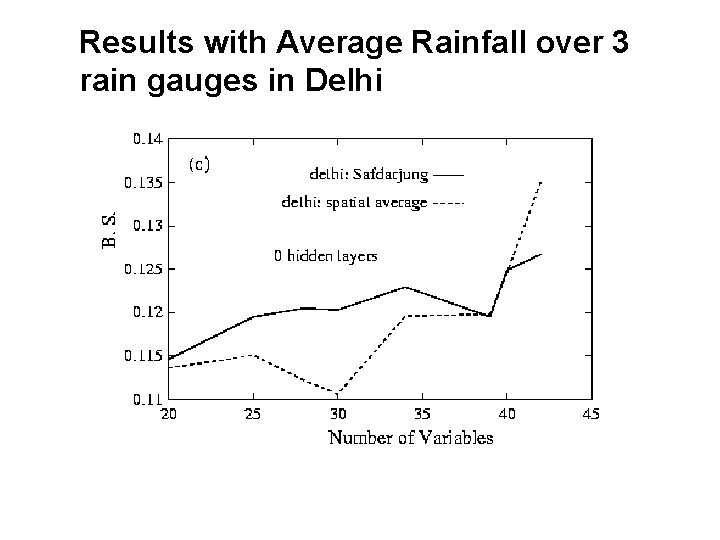
Results with Average Rainfall over 3 rain gauges in Delhi
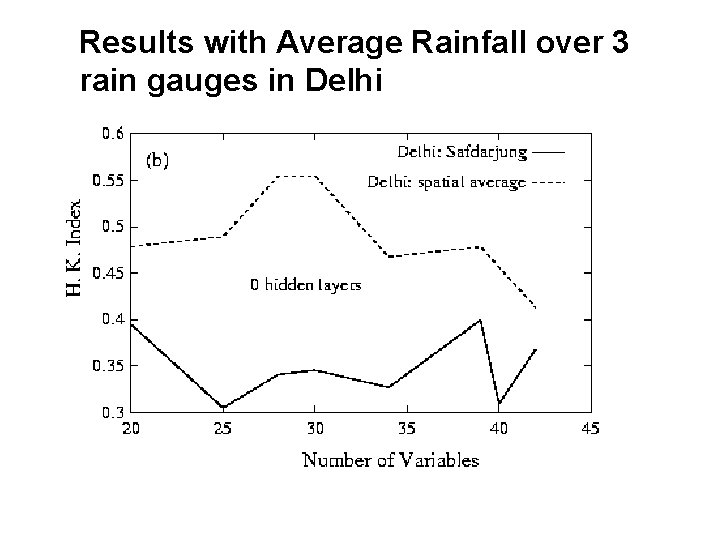
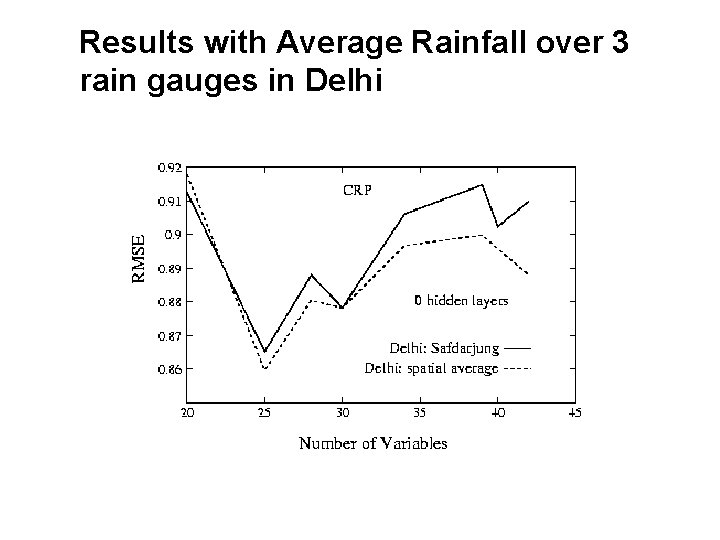
Results with Average Rainfall over 3 rain gauges in Delhi
Results with Average Rainfall over 3 rain gauges in Delhi
Results with Average Rainfall over 3 rain gauges in Delhi
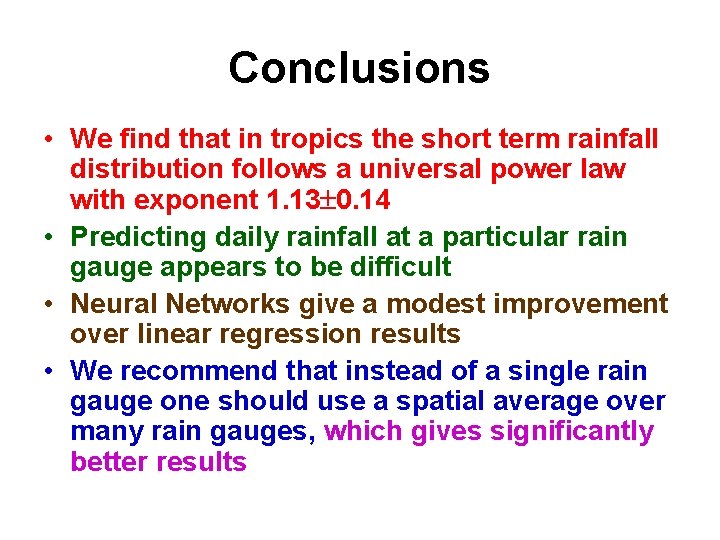
Conclusions • We find that in tropics the short term rainfall distribution follows a universal power law with exponent 1. 13 0. 14 • Predicting daily rainfall at a particular rain gauge appears to be difficult • Neural Networks give a modest improvement over linear regression results • We recommend that instead of a single rain gauge one should use a spatial average over many rain gauges, which gives significantly better results
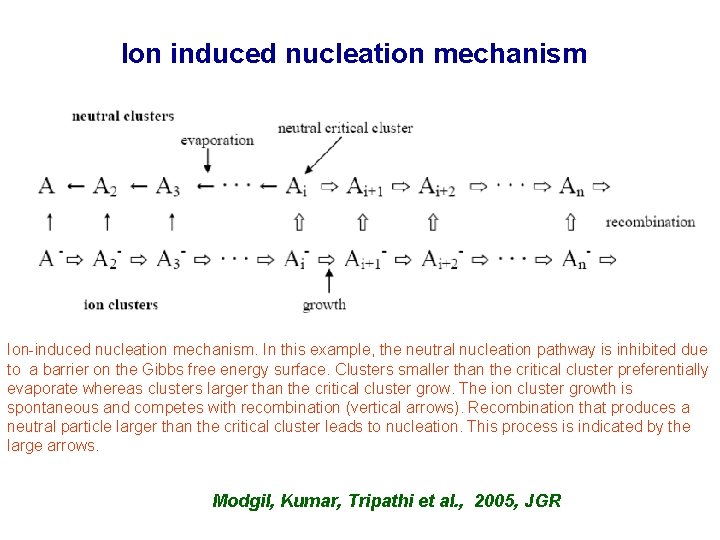
Ion induced nucleation mechanism Ion-induced nucleation mechanism. In this example, the neutral nucleation pathway is inhibited due to a barrier on the Gibbs free energy surface. Clusters smaller than the critical cluster preferentially evaporate whereas clusters larger than the critical cluster grow. The ion cluster growth is spontaneous and competes with recombination (vertical arrows). Recombination that produces a neutral particle larger than the critical cluster leads to nucleation. This process is indicated by the large arrows. Modgil, Kumar, Tripathi et al. , 2005, JGR
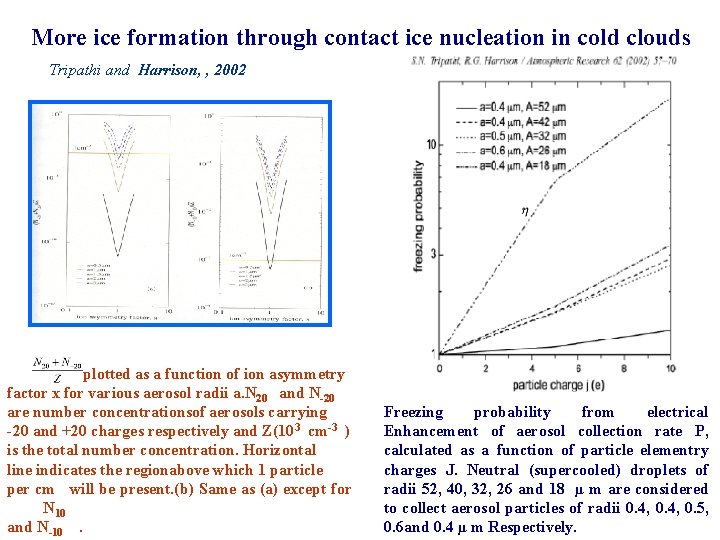
More ice formation through contact ice nucleation in cold clouds Tripathi and Harrison, , 2002 plotted as a function of ion asymmetry factor x for various aerosol radii a. N 20 and N-20 are number concentrationsof aerosols carrying -20 and +20 charges respectively and Z(103 cm-3 ) is the total number concentration. Horizontal line indicates the regionabove which 1 particle per cm will be present. (b) Same as (a) except for N 10 and N-10. Freezing probability from electrical Enhancement of aerosol collection rate P, calculated as a function of particle elementry charges J. Neutral (supercooled) droplets of radii 52, 40, 32, 26 and 18 µ m are considered to collect aerosol particles of radii 0. 4, 0. 5, 0. 6 and 0. 4 µ m Respectively.