Molecular phenomics and metagenomics of hepatic steatosis in


")


- Slides: 26
Molecular phenomics and metagenomics of hepatic steatosis in non-diabetic obese women Hoyles L, Fernández-Real JM, Federici M, et al. Nature Medicine 2018; 24: 1070 -1080 Journal club: October 18, 2018 Patcharamon Seubnooch Ph. D student
What is the mechanism of hepatic steatosis? Systems Biology does not investigate individual cellular components at a time, but the behaviour and relationships of all of the elements in a particular biological system while it is functioning. Systems Biology It’s an elephant
Hepatic steatosis in non-diabetic obese women • Hepatic steatosis is a multifactorial condition that is often observed in obese patients and is a prelude to non-alcoholic fatty liver disease (NAFLD). • The physiological mechanisms of Hepatic steatosis remain poorly understood. • This research characterize the physiological mechanisms that are responsible for the integrated interactions between signals from the gut metagenome and the host molecular phenome of hepatic steatosis. Tian Y, et al. Seminars in Cancer Biology (2013)
Phenomics and Metagenomics Genomics DNA Human body contains same amount of bacteria than human cells Sender et al. bio. Rxiv (2016) Transcriptomics m. RNA Phenotype Microbiome Bacterial DNA Metabolomics Metabolites Modified from: Handout of High troughput sequencing, Ursula Amstutz (2018)
What is Metagenomics? • “…is the study of genetic material recovered directly from environmental samples. ” wikipedia • aka environmental genomics, ecogenomics or community genomics Modified from: Handout of High troughput sequencing, Ursula Amstutz (2018)
Recruitment of patients and processing of samples Design: cohort study (2 unique and independent cohorts of women) n = 61 n = 44 105 morbidly obese woman who elected for bariatric surgery Fecal metagenomics • Stool (gut microbiome) Molecular phenomics • Plasma and urine metabolomes • Liver transcriptomes Clinical phenotypes (age, cohort, BMI, and the other clinical variables) multivariate model integrating metagenomic, transcriptomic and metabolomic information Inclusion criteria ü All subjects were of Caucasian origin. ü The subjects reported a stable body weight 3 months preceding the study. ü They were not given a liquid diet before surgery. ü They were free of any infections, including the use of antibiotics, 1 month before surgery and had no systemic disease. Exclusion criteria × Subjects with a known medical history of • diabetes or self-reported use of hypoglycemic agents • presence of liver disease, specifically Hepatitis B, hepatitis C virus infection and tumor disease • thyroid dysfunction • Autoimmune hepatitis × The subjects were alcohol consumption of > 20 g/day × To avoid iron overload, serum ferritin was below 200 ng ml– 1 in all subjects. × Alpha-1 antitrypsin deficiency was excluded by anamnestic data and clinical evidence. × Drug-induced liver injury was excluded using a drug questionnaire. Hepatic steatosis signatures in non-diabetic obese women
The integration of clinical, molecular phenomics and metagenomic information and biological validations
The integration of clinical, molecular phenomics and metagenomic information and biological validations
Determination of distinction between confounders and modifiers, for inclusion of confounders in partial correlations (n = 105) • Age, cohort and body mass index (BMI) as confounders • These three confounders were taken into account in all subsequent partial Spearman’s rank-based correlation (p. SRC) patterns across clinical variables. a, Principal component analysis showing the effect of country of recruitment on clinical data. Red, Spain; blue, Italy. b, Boxplots (median, with interquartile range and 1. 5 times interquartile range) showing that based on linear modeling BMI, country and age were found to be confounders. Significant differences between the data for the Spanish (in red) and Italian (in blue) cohorts were determined using Student’s t test (two-sided, p < 0. 05). c, Example of identification of modifiers rather than confounders, using glucose disposal rate (M) (mg/(kg/min)). Any change in slope of the line between both models indicates that M (mg/(kg/min)) is a mediator not a confounder and can, therefore, not be corrected for in partial correlations. d, Heatmap of partial Spearman rank-based correlations between clinical parameters adjusted for age, BMI and country.
The integration of clinical, molecular phenomics and metagenomic information and biological validations
Metagenomic signatures of hepatic steatosis in obese women a. b. a. Boxplots showing that MGR was significantly anti-correlated with liver steatosis using p. SRC, adjusted for age, BMI and sex (two sided, n = 56). b. Heatmap showing the significant correlation of MGR with clinical data (n = 56, p. SRC, two-sided, p-FDR < 0. 05 values shown). For all panels, n = 56, groups as no liver steatosis = 10; liver steatosis 1 = 22; liver steatosis 2 = 14; liver steatosis 3 = 10. All boxplots are the median with the interquartile range, and the error bars are the 1. 5 -times interquartile range.
Metagenomic signatures of hepatic steatosis in obese women d. c. e. c. Heatmap showing the association of genus-level abundance data with clinical data (n = 56, p. SRC, two-sided, + indicates stastistical significance p-FDR < 0. 05). d & e. Boxplots showing prokaryotic taxa that are significantly associated with hepatic steatosis. § Prokaryotic taxa that are significantly anti-correlated with liver steatosis at the phylum and genus levels (n = 56, p. SRC, two-sided, p-FDR < 0. 05; see Supplementary Table 6 for the exact and the BH-adjusted P values) are shown (d). § Prokaryotic taxa that are significantly correlated with liver steatosis at the phylum and genus levels (n = 56, p. SRC, two-sided, p-FDR < 0. 05; see Supplementary Table 6 for the exact and the Benjamini-Hochberg (BH)-adjusted P values) are shown (e). For all panels, n = 56, groups as no liver steatosis = 10; liver steatosis 1 = 22; liver steatosis 2 = 14; liver steatosis 3 = 10. All boxplots are the median with the interquartile range, and the error bars are the 1. 5 -times interquartile range.
Heatmaps showing partial Spearman rank-based correlation of metagenome-derived KEGG pathway data with clinical data for the 56 patients whose metagenomes were analyzed.
The integration of clinical, molecular phenomics and metagenomic information and biological validations
Urine metabolites Metabolic profiling of urine and plasma by 1 H-NMR spectroscopy Plasma metabolites • 124 metabolite signals in the urine and 80 in the plasma that correlated with hepatic steatosis and associated clinical traits
The plasma and urinary metabolites that are most significantly partially correlated with liver steatosis Plasma metabolites Urine metabolites
The integration of clinical, molecular phenomics and metagenomic information and biological validations
Association of transcriptomic data with liver steatosis and MGR ‘NAFLD – Homo sapiens (human) LPL: encodes lipoprotein lipase ACADSB: encodes short/branched-chain acyl-Co. A dehydrogenase INSR: encodes the insulin receptor
The integration of clinical, molecular phenomics and metagenomic information and biological validations
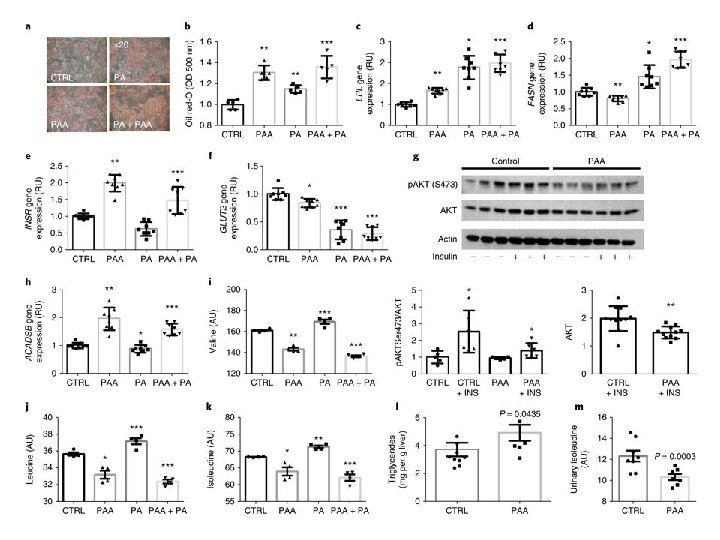
Transfer of steatotic and metabolic phenotypes to mice through FMT of material from patients with (n = 3) and without (n = 3) liver steatosis grade 3 The mice were then gavaged once a day for four consecutive days with the fecal matter suspended in the buffer
hepatic triglyceride content Fabp 4 plasma valine level
The integration of clinical, molecular phenomics and metagenomic information and biological validations
Integrative data crosstalk and steatosis signatures
Conclusion • Molecular networks between the gut microbiome and the hepatic steatosis phenome in obese woman ü Hepatic steatosis is negatively associated with MGR and that the microbiome contributes to the steatosis phenome in clinical and preclinical results. ü An increased gut microbial amino acid metabolism in steatotic subjects that has a profound effect on their liver transcriptome, biofluid metabolomes and liver fat accumulation, eventually leading to fatty liver. ü The bioinformatic analysis of metagenomic sequences combined with metabolomic data suggested a direct role for microbial degradation of AAAs into PAA in patients with steatosis.
Thank you for your attention