MIS 2502 Data Analytics Advanced Analytics Using R
 Deng deng@temple. edu http:")


 Clustering")
 Used to classify data according to a pre-defined outcome Based")


 • Basic")


 • Function & Argument Function: rm(ARGUMENT). rm() here")
 sqrt(), log(), abs(), and exp() are functions. Functions accept")


![Vector Examples > scores<-c(65, 75, 80, 88, 82, 99, 100, 50) > scores [1]](https://slidetodoc.com/presentation_image_h2/c7aa3986231e1c624a5f448294feb786/image-30.jpg "Vector Examples > scores<-c(65, 75, 80, 88, 82, 99, 100, 50) > scores [1]")
![Indexing Vectors • We use brackets [ ] to pick specific elements in the](https://slidetodoc.com/presentation_image_h2/c7aa3986231e1c624a5f448294feb786/image-31.jpg "Indexing Vectors • We use brackets [ ] to pick specific elements in the")

![Identify elements of a data frame • To retrieving cell values > BMI[1, 3]](https://slidetodoc.com/presentation_image_h2/c7aa3986231e1c624a5f448294feb786/image-33.jpg "Identify elements of a data frame • To retrieving cell values > BMI[1, 3]")
 are collections of R functions and code in")
")


 •")

![Analysis Example: [Student] t-Test • Compare differences across groups: • We want to know](https://slidetodoc.com/presentation_image_h2/c7aa3986231e1c624a5f448294feb786/image-43.jpg "Analysis Example: [Student] t-Test • Compare differences across groups: • We want to know")
 Variable of interest (Runs) Broken")
 hist() first parameter")


 general help(mean) help about function mean() ? mean same. Help about")


- Slides: 51
MIS 2502: Data Analytics Advanced Analytics Using R Zhe (Joe) Deng deng@temple. edu http: //community. mis. temple. edu/zdeng 1
The Information Architecture of an Organization Now we’re here… Data entry Data extraction Transactional Database Stores real-time transactional data Data analysis Analytical Data Stores historical transactional and summary data
What is Advanced Data Analytics/Mining? • The examination of data or content using sophisticated techniques and tools, to • discover deeper insights, • make predictions, or • generate recommendations. • Goals: Extraction of implicit, previously unknown, and potentially useful information from data Exploration and analysis of large data sets to discover meaningful patterns Prediction of future events based on historical data
What data analytics/mining is not… Sales analysis • How do sales compare in two different stores in the same state? Profitability analysis • Which product lines are the highest revenue producers this year? Sales force analysis • Did salesperson X meet this quarter’s target? If these aren’t data mining examples, then what are they ?
Advanced data analytics/mining is about… Sales analysis • Why do sales differ in two stores in the state? Profitability analysis • Which product lines will be the highest revenue producers next year? Sales force analysis • How much likely would the salesperson X meet next quarter’s target?
Example: Smarter Customer Retention • Consider a marketing manager for a brokerage company • Problem: High churn (customers leave) • Customers get an average reward of $160 to open an account • 40% of customers leave after the 6 month introductory period • Giving incentives to everyone who might leave is expensive • Getting a customer back after they leave is expensive
Answer: Not all customers have the same value One month before the end of the introductory period, predict which customers will leave Offer those customers something based on their future value Ignore the ones that are not predicted to churn
Three Analytics Tasks We Will Be Doing in this Classification (Decision Tree Approach) Clustering Analysis Association Rule Learning
Decision Trees(To Realize Classification) Used to classify data according to a pre-defined outcome Based on characteristics of that data Uses Predict whether a customer should receive a loan Flag a credit card charge as legitimate Determine whether an investment will pay off
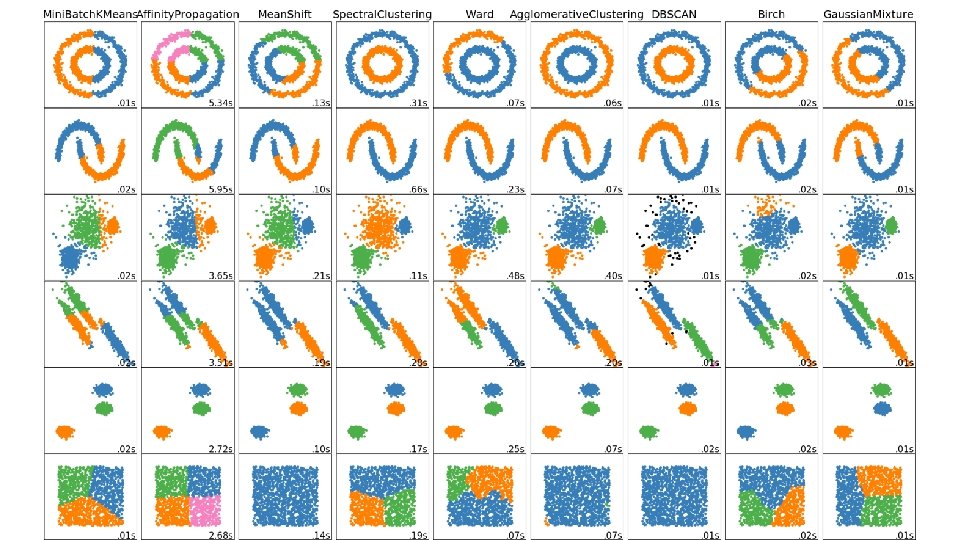
Cluster Analysis Used to determine distinct groups of data Based on data across multiple dimensions Uses Customer segmentation Identifying patient care groups Performance of business sectors
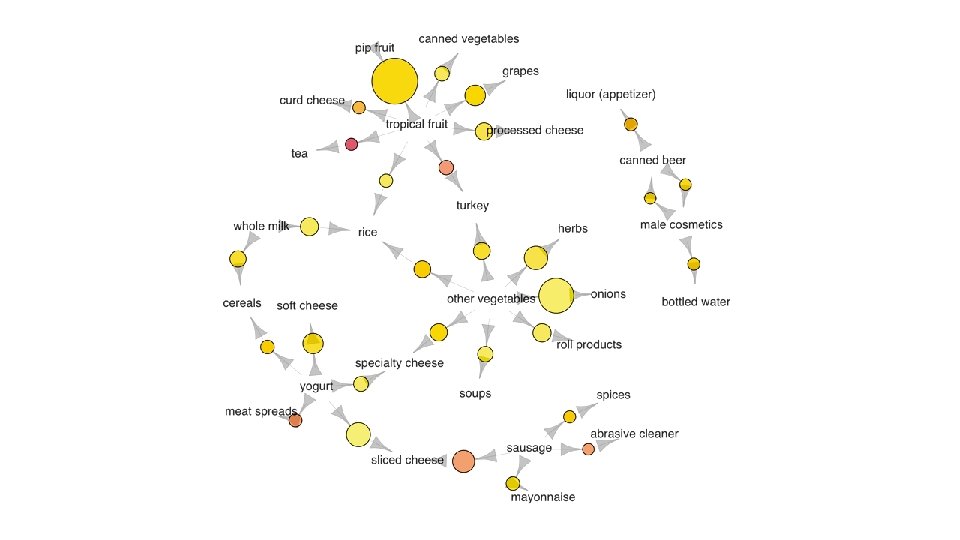
Association Rule Learning Find out which events predict the occurrence of other events Often used to see which products are bought together Uses What products are bought together? Amazon’s recommendation engine Telephone calling patterns
Introduction to R and RStudio • R has become one of the dominant language for data analysis • A large user community • Thousands of third-party packages that contribute functionality Install R with R studio both on your computer according to the installation instruction on our website.
http: //www. kdnuggets. com/2015/05/poll-r-rapidminer-python-big-data-spark. html
• Software development platform and language • Open source, free • Many, many statistical add-on “packages” that perform data analysis • Integrated Development Environment(IDE) for R • Nicer interface that makes R easier to use • Requires R to run • After install both, you only need to interact with Rstudio • Mostly, you do not need to touch R directly
Environment Panel Script Panel Utility Panel Console Panel
RStudio Interface • Script Panel • This is where the R code is shown and edited • When you open a R code file, its content shows up here • Console Panel • This is where R code is executed. Results will show up here • If there is error with your code, the error message will also show up here • Environment Panel • This is where the variables and data are displayed • It helps to keep track of the variables and data you have • Utility Panel • This window includes several tabs • Files: shows the path to your current file, not often used • Plots: if you use R to plot a graph, it will show up here • Packages: install/import packages, more on this later • Help: manuals and documentations to every R functions, very useful
Creating and opening a. R file • The R script is where you keep a record of your work in R/RStudio. • To create a. R file • Click “File|New File|R Script” in the menu • To save the. R file • click “File|Save” • To open an existing. R file • click “File|Open File” to browse for the. R file
The Basics: • Calculation • Variable & Value • Function & Argument(Parameter) • Basic Data Types: Numeric, Character, Logical • Advanced Data Types: Vector, Frame • Packages • Loading data to R • Working Directory
The Basics: Calculations • In its simplest form, R can be used as a calculator: Type commands into the console and it will give you an answer
The Basics: Variable & Value • Variable & Value Read from the right to left as “Assign [value] 5 to [variable] x”. IDE first requires OS to allocate a segment of machine memory to store a empty variable template called “x”, then requires OS to allocate another segment of memory to fill a copy of the template with a value, 5.
The Basics: Variable & Value • Variables are named containers for data • The assignment operator in R is: <- or = • Variable names can start with a letter or digits. • Just not a number by itself. • Examples: result, x 1, 2 b (not 2) • R is case-sensitive (i. e. Result is a different variable than result) <- and = do the same thing x, y, and z are variables that can be manipulated
The Basics: Function & Argument (Parameter) • Function & Argument Function: rm(ARGUMENT). rm() here is a build-in function. You can also define your own function. Some function are used to return a value, such as AVG() in SQL. The others are used to complete an operation, such as this. A function can take no argument, a single argument, or multiple arguments.
The Basics: Function & Argument(Parameter) sqrt(), log(), abs(), and exp() are functions. Functions accept parameters (in parentheses) and return a value
Simple statistics with R • You can get descriptive statistics from a vector > scores [1] 65 75 80 88 82 99 100 50 > length(scores) [1] 9 > min(scores) [1] 50 > max(scores) [1] 100 > mean(scores) [1] 82. 11111 > median(scores) [1] 82 > sd(scores) [1] 17. 09857 > var(scores) [1] 292. 3611 > summary(scores) Min. 1 st Qu. Median Mean 3 rd Qu. Max. 50. 00 75. 00 82. 11 99. 00 100. 00 Again, length(), min(), max(), mean(), median(), sd(), var() and summary() are all functions. These functions accept vectors as parameter.
The Basics: Basic Data Types Type Range Assign a Value Numbers X <-1 Y <- -2. 5 Character Text strings name<-"Mark" color<-"red" Logical (Boolean) TRUE or FALSE female<-TRUE Numeric
The Basics: Advanced Data Types – Vector & Data Frame • Vectors • Vector: a combination of elements (i. e. numbers, words) of the same basic type, usually created using c(), seq(), or rep() • Data frames • Data frame: a table consist of one or more vectors
Vector Examples > scores<-c(65, 75, 80, 88, 82, 99, 100, 50) > scores [1] 65 75 80 88 82 99 100 50 > studentnum<-1: 9 > studentnum [1] 1 2 3 4 5 6 7 8 9 > ones<-rep(1, 4) > ones [1] 1 1 > names<-c("Nikita", "Dexter", "Sherlock") > names [1] "Nikita" "Dexter" "Sherlock" c() and rep() are functions
Indexing Vectors • We use brackets [ ] to pick specific elements in the vector. • In R, the index of the first element is 1 > scores [1] 65 75 80 88 82 99 100 50 > scores[1] 65 > scores[2: 3] [1] 75 80 > scores[c(1, 4)] [1] 65 88
Data Frames • A data frame is a type of variable used for storing data tables • is a special type of list where every element of the list has same length (i. e. data frame is a “rectangular” list or table) > BMI<-data. frame( + gender = c("Male", "Female"), + height = c(152, 171. 5, 165), + weight = c(81, 93, 78), + Age = c(42, 38, 26) + ) > BMI gender height weight Age 1 Male 152. 0 81 42 2 Male 171. 5 93 38 3 Female 165. 0 78 26 > nrow(BMI) [1] 3 > ncol(BMI) [1] 4
Identify elements of a data frame • To retrieving cell values > BMI[1, 3] [1] 81 > BMI[1, ] gender height weight Age 1 Male 152 81 42 > BMI[, 3] [1] 81 93 78 • More ways to retrieve columns as vectors > BMI[[2]] [1] 152. 0 171. 5 165. 0 > BMI$height [1] 152. 0 171. 5 165. 0 > BMI[["height“]] [1] 152. 0 171. 5 165. 0
The Basics: Packages • Packages (add-ons) are collections of R functions and code in a welldefined format. • To install a package: install. packages("pysch") Each package only needs to be installed once • For every new R session (i. e. , every time you re-open Rstudio), you must load the package before it can be used or library(psych) require(psych) Must load for every new R session
Packages Downloads and installs the package (once per R installation)
The Basics: Loading Data into R • R can handle all kinds of data files. We will mostly deal with csv files • Use read. csv() function to import csv data • You need to specify path to the data file • By default, comma is used as field delimiter • First row is used as variable names Very Important!!! • You can simply do this by • Download source file and csv file into the same folder (i. e. , C: RFiles). • Set that folder as working directory by assigning source file location as working directory
Working directory • The working directory is where Rstudio will look first for scripts and files • Keeping everything in a self contained directory helps organize code and analyses • Check you current working directory with getwd()
To change working directory Use the Session | Set Working Directory Menu • If you already have an. R file open, you can select “Set Working Directory>To Source File Location”.
Loading data from a file • Usually you won’t type in data manually, you’ll get it from a file • Example: 2009 Baseball Statistics (http: //www 2. stetson. edu/~jrasp/data. htm) reads data from a CSV file and creates a data frame called team. Data that store the data table. reference the Home. Runs column in the data frame using Team. Data$Home. Runs
More On Loading Datasets Suppose you want to load a dataset called “MIS 2502”. If the dataset is in • • • an existing R package, load the package and type data(MIS 2502). RData format, type load(MIS 2502). txt or other text formats, type read. table("MIS 2502. txt"). csv format, type read. csv("MIS 2502. txt"). dta (Stata) format, load the foreign library and type read. dta(“MIS 2502. dta") Remember “function & argument” in the first part To save objects into these formats, use the equivalent write. table(), write. csv(), etc. commands.
The Basics: Summary • Calculation • Variable & Value • Function & Argument(Parameter) • Basic Data Types: Numeric, Character, Logical • Advanced Data Types: Vector, Frame • Packages • Loading data to R • Working Directory
Analysis Examples • Student t-Test: Compare means • Histogram • Plotting data
Analysis Example: [Student] t-Test • Compare differences across groups: • We want to know if National League (NL) teams scored more runs than American League (AL) Teams • And if that difference is statistically significant • To do this, we need a package that will do this analysis • In this case, it’s the “psych” package Downloads and installs the package (once per R installation)
t-Test: Compare Differences Across Groups describeby(team. Data$Runs, team. Data$League) Variable of interest (Runs) Broken up by group (League) Results of t-test for differences in Runs by League
Analysis Example: Histogram hist(team. Data$Batting. Avg, xlab="Batting Average", main="Histogram: Batting Average") hist() first parameter – data values xlab parameter – label for x axis main parameter - sets title for chart
Analysis Example: Plotting data plot(team. Data$Batting. Avg, team. Data$Winning. Pct, xlab="Batting Average", ylab="Winning Percentage", main="Do Teams With Better Batting Averages Win More? ") plot() first parameter – x data values second parameter – y data values xlab parameter – label for x axis ylab parameter – label for y axis main parameter - sets title for chart
Execute the script Use the Code | Run Region | Run All Menu Commands can be entered one at a time, but usually they are all put into a single file that can be saved and run over and over again.
Getting help. start() general help(mean) help about function mean() ? mean same. Help about function mean() example(mean) show an example of function mean() help. search("regression") get help on a specific topic such as regression.
Online Tutorials • If you’d like to know more about R, check these out: • • Quick-R (http: //www. statmethods. net/index. html) R Tutorial (http: //www. r-tutor. com/r-introduction) Learn R Programing (https: //www. tutorialspoint. com/r/index. htm) Programming with R (https: //swcarpentry. github. io/r-novice-inflammation/ • There is also an interactive tutorial to learn R basics, highly recommended! (http: //tryr. codeschool. com/)
Time for our th 9 ICA!