
Infineon Technologies Dresden Advanced Data Processing Combining full
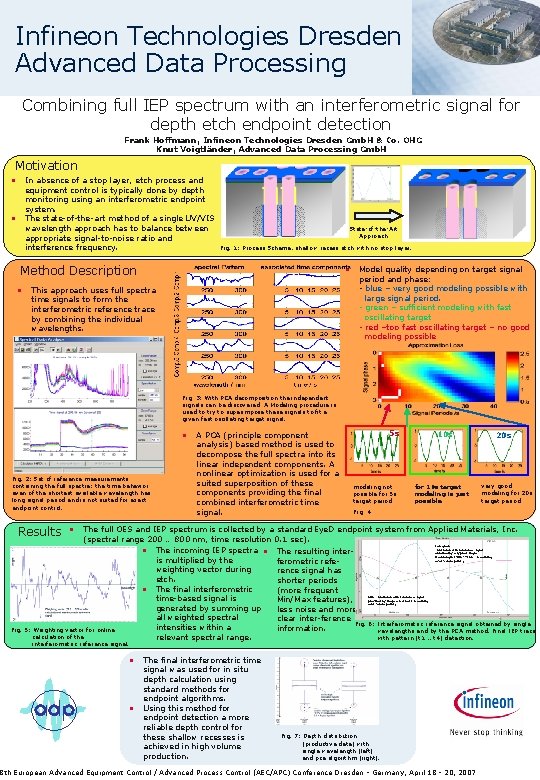
Infineon Technologies Dresden Advanced Data Processing Combining full IEP spectrum with an interferometric signal for depth etch endpoint detection Frank Hoffmann, Infineon Technologies Dresden Gmb. H & Co. OHG Knut Voigtländer, Advanced Data Processing Gmb. H Motivation • In absence of a stop layer, etch process and equipment control is typically done by depth monitoring using an interferometric endpoint system. The state-of-the-art method of a single UV/VIS wavelength approach has to balance between appropriate signal-to-noise ratio and interference frequency. • State-of-the-Art Approach Fig. 1: Process Scheme, shallow recess etch with no stop layer. Method Description • • This approach uses full spectra time signals to form the interferometric reference trace by combining the individual wavelengths. Model quality depending on target signal period and phase: - blue – very good modeling possible with large signal period. - green – sufficient modeling with fast oscillating target - red –too fast oscillating target – no good modeling possible Fig. 3: With PCA decomposition the independent signals can be discovered. A Modeling procedure is used to try to superimpose these signals to fit a given fast oscillating target signal. • Fig. 2: Set of reference measurements containing the full spectra; the time behavior even of the shortest available wavelength has long signal period and is not suited for exact endpoint control. Results A PCA (principle component analysis) based method is used to decompose the full spectra into its linear independent components. A nonlinear optimization is used for a suited superposition of these components providing the final combined interferometric time signal. 5 s modeling not possible for 5 s target period 10 s for 10 s target modeling is just possible 20 s very good modeling for 20 s target period Fig. 4 • The full OES and IEP spectrum is collected by a standard Eye. D endpoint system from Applied Materials, Inc. (spectral range 200 … 800 nm, time resolution 0. 1 sec). • The incoming IEP spectra • The resulting interis multiplied by the ferometric refeweighting vector during rence signal has etch. shorter periods • The final interferometric (more frequent time-based signal is Min/Max features), generated by summing up less noise and more all weighted spectral clear inter-ference Fig. 6: Interferometric reference signal obtained by single intensities within a information. Fig. 5: Weighting vector for online wavelengths and by the PCA method. Final IEP trace calculation of the relevant spectral range. with pattern (t 1 … t 4) detection. red/green: Interferometric reference signal obtained by a typical single wavelength (280/229 nm, smoothing over 5 data points) blue: Interferometric reference signal provided by the pca method (smoothing over 5 data points) interferometric reference signal. • • The final interferometric time signal was used for in situ depth calculation using standard methods for endpoint algorithms. Using this method for endpoint detection a more reliable depth control for these shallow recesses is achieved in high volume production. Fig. 7: Depth distribution (productive data) with single wavelength (left) and pca algorithm (right). 8 th European Advanced Equipment Control / Advanced Process Control (AEC/APC) Conference Dresden - Germany, April 18 - 20, 2007
- Slides: 1