Maximum Likelihood Maximum Likelihood Historically the newest method


 Pr(D|H) is the probability of getting the")


: p(A) =")


 = 0.")


- Slides: 24
Maximum Likelihood
Maximum Likelihood Historically the newest method. Popularized by Joseph Felsenstein, Seattle, Washington. Its slow uptake by the scientific community has to do with the difficulty of understanding theory and also the absence (initially) of good quality software with choice of models and ease of interaction with data. Also, at the time, it was computationally intractable to analyse large datasets (consider that in the mid-1980 s a typical desktop computer had a processor speed of less than 30 MHz). In recent times, software, models and computer hardware have become sufficiently sophisticated that ML is becoming a method of choice.
ML: comparison with other methods - ML is similar to many other methods in many ways, but fundamentally different. - ML assumes a model of sequence evolution (so does Maximum Parsimony and so do distance matrix methods). - ML attempts to answer the question: What is the probability that I would observe these data (a multiple sequence alignment), given a particular model of evolution (a tree and a process). L = Pr (D|H) Pr(D|H) is the probability of getting the data D given hypothesis H.
Principle of Likelihood L = Pr (D|H) Pr(D|H) is the probability of getting the data D given hypothesis H. In the context of molecular phylogenetics, D is the set of sequences being compared, and H is a phylogenetic tree and process, hence we want to find the likelihood of obtaining the observed sequences given a particular tree based on a process. The tree that makes our data the most probable evolutionary outcome is the maximum likelihood estimate of the phylogeny.
Maximum Likelihood Probability of given
What is the probability of observing a datum? If we flip a coin and get a head and we think the coin is unbiased, then the probability of observing this head is 0. 5. If we think the coin is biased so that we expect to get a head 80% of the time, then the likelihood of observing this datum (a head) is 0. 8. Therefore: The likelihood of making some observation is entirely dependent on the model that underlies our assumption. p =? Lesson: The datum has not changed, our model has. Therefore under the new model the likelihood of observing the datum has changed.
What is the probability of observing a 'G' nucleotide? • Question: If we have a DNA sequence of one nucleotide in length and the identity of this nucleotide is 'G', what is the likelihood that we would observe this 'G'? • Answer: In the same way as the coin-flipping observation, the likelihood of observing this 'G' is dependent on the model of sequence evolution that is thought to underlie the data. • e. g. – Model 1: frequency of G = 0. 4 => likelihood (G) = 0. 4 – Model 2: frequency of G = 0. 1 => likelihood (G) =0. 1 – Model 3: frequency of G = 0. 25 => likelihood (G) = 0. 25
What about longer sequences? If we consider a gene of length 2: Gene 1: GA The probability of observing this gene is the product of the probabilities of observing each character. e. g. p(G) = 0. 4; p(A) = 0. 15 (for instance) likelihood (GA) = 0. 4 x 0. 15 = 0. 06
…or even longer sequences? Gene 1: GACTAGACAGATACGAATTAC Model (simple base frequency model): p(A) = 0. 15; p(C) = 0. 2; p(G) = 0. 4; p(T) = 0. 25; (the sum of all probabilities must equal 1) Like (Gene 1) = 0. 0000000018452813
Note About Models You might notice that our model of base frequency is not the optimal model for our observed data. If we had used the following model: p(A) = 0. 4; p(C) = 0. 2; p(G) = 0. 2; p(T) = 0. 2; The likelihood of observing the gene is: Like (gene 1) = 0. 000000335544320000 (a value that is almost 10, 000 times higher) Lesson : The datum has not changed, our model has. Therefore under the new model the likelihood of observing the datum has changed.
The Model - The two parts of the model are the tree and the process (the model). - The model is composed of the composition and the substitution process -rate of change from one character state to another character state. Model = +
Simple “time-reversible” Model A simple model is that the rate of change from A to C or vice versa is 0. 4, the composition of A is 0. 25 and the composition of C is 0. 25 (a simplified version of the Jukes and Cantor 1969 model) P=
Probability of the third nucleotide position in our current alignment • p(A) = 0. 25; p(C) = 0. 25; • Starting with A, the likelihood of the nucleotide is 0. 25 and the likelihood of the substitution (branch) is 0. 4. So the likelihood of observing these data is: • *Likelihood(D|M) = 0. 25 x 0. 4 =0. 01 Note: you will get the same result if you start with c, since this model is reversible *The likelihood of the data, given the model.
Substitution Matrix For nucleotide sequences, there are 16 possible ways to describe substitutions - a 4 x 4 matrix. Convention dictates that the order of the nucleotides is A, C, G, T Note: for amino acids, the matrix is a 20 x 20 matrix and for codonbased models, the matrix is 61 x 61
Substitution matrix - an example In this matrix, the probability of an A changing to a C is 0. 01 and the probability of a C remaining the same is 0. 983, etc. Note: The rows of this matrix sum to 1 - meaning that for every nucleotide, we have covered all the possibilities of what might happen to it. The columns do not sum to anything in particular.
To calculate the likelihood of the entire dataset, given a substitution matrix, base composition and a branch length. Likelihood of Gene 1: CCAT Gene 2: CCGT given Π = [0. 1, 0. 4, 0. 2, 0. 3]
Likelihood of a two-sequence alignment • CCAT • CCGT = 0. 4 x 0. 983 x 0. 1 x 0. 007 x 0. 3 x 0. 979 = 0. 0000300 Likelihood of going from the first to the second sequence is 0. 0000300
Likelihood of a two-branch tree A O B O is the origin or root. The likelihood can be calculated in three ways: • from A to B in one step (this amounts to the previous method) • from A to B in two steps (through O) • in two parts starting at O.
Lesson about O • O is an unknown sequence. • We can only speculate what each position in the alignment would be if we could observe the sequence of O. • What we do know is that the sum of all possibilities is equal to 1. • Therefore we must sum the likielihoods for all possibilities of O. • This becomes computationally intensive. A O {C} For position 1: {A, C, G, T} B {C}
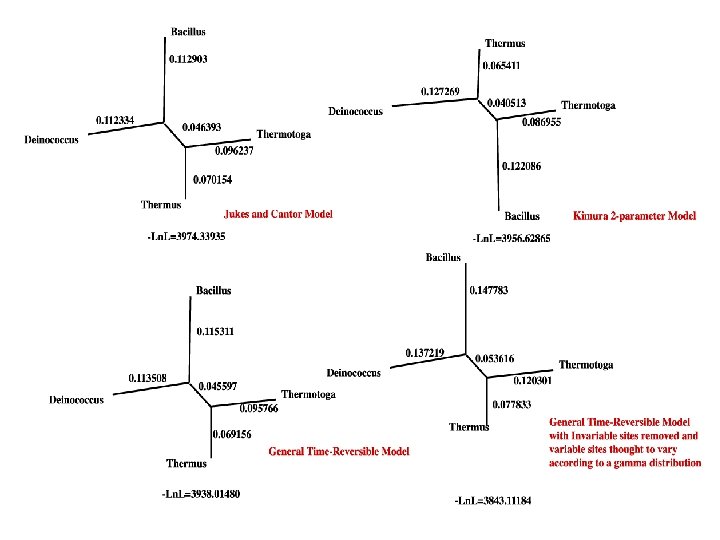
Does changing a model affect the outcome? There are different models Jukes and Cantor (JC 69): All base compositions equal (0. 25 each), rate of change from one base to another is the same Kimura 2 -Parameter (K 2 P): All base compositions equal (0. 25 each), different substitution rate for transitions and transversions). Hasegawa-Kishino-Yano (HKY): Like the K 2 P, but with base composition free to vary. General Time Reversible (GTR): Base composition free to vary, all possible substitutions can differ.
Long-Branch Attraction • In the case below, the wrong tree is often selected. ML will not be prone to this problem, if the correct model of sequence evolution is used. A A B p D p q q q C D CORRECT TREE p>q C B WRONG TREE
Strengths of ML • There is no need to ‘correct’ for anything, the models take care of superimposed substitutions. • Accurate branch lengths. • Each site has a likelihood. • If the model is correct, we should retrieve the correct tree (if we have long enough sequences and a sophisticated enough model). • ML uses all the data (no selection of sites based on informativeness, all sites are informative). • ML not only tells you about the phylogeny of the sequences, but also the process of evolution that led to the observations of current sequences.
Weaknesses of ML • Can be inconsistent if we use models that are not accurate. • Model might not be sophisticated enough. • Very computationally-intensive. Might not be possible to examine all models (substitution matrices, tree topologies, etc. ).