Leisure Sport and Tourism Politics Policy and Planning
- Slides: 49
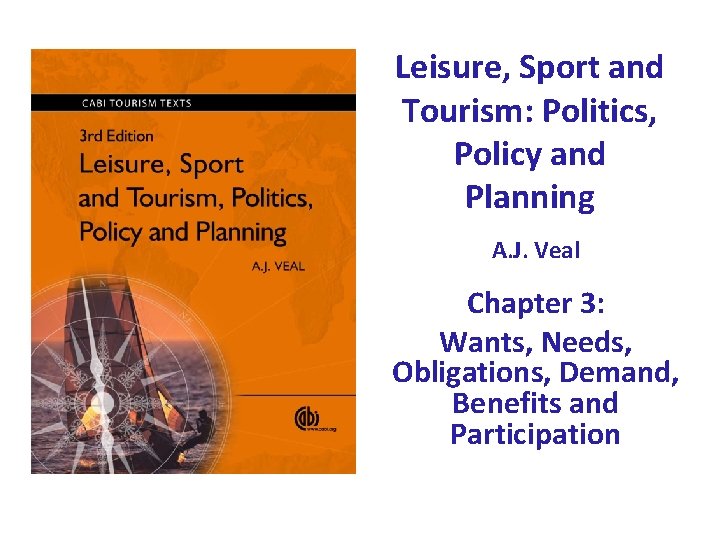
Leisure, Sport and Tourism: Politics, Policy and Planning A. J. Veal Chapter 3: Wants, Needs, Obligations, Demand, Benefits and Participation
Contents • Needs: – In leisure planning: necessities – In tourism: basis of all wants/desires • Wants: desires not classified as needs • Obligations: Participation related to social obligations • Demand: Economics-based: amounts of a good/ service purchased at various prices • Benefits: (Net) positive effects from participation • Participation: Taking part in an activity
WANTS & NEEDS: Approaches to conceptualisation • • Maslow's hierarchy of need Optimal arousal and incongruity Leisure satisfaction scales Bradshaw/Mercer typology of need Universal needs False needs Socio-economic deprivation
Needs: official statements (Box 3. 1) • UK: 1999: Local Cultural Strategies guidelines: – Local cultural strategies are to be based on 'the needs of local communities’. – One of the benefits of developing such strategies is their focus on the 'needs, demands and aspirations' of communities. (DCMS, 1999) • Australia: 2003: NSW Cultural Planning guidelines: – Cultural amenities can be seen not as something remote or apart from everyday life but fundamental to people's needs. (NSW Ministry for the Arts & Dept of Local Government, 2002: 2)
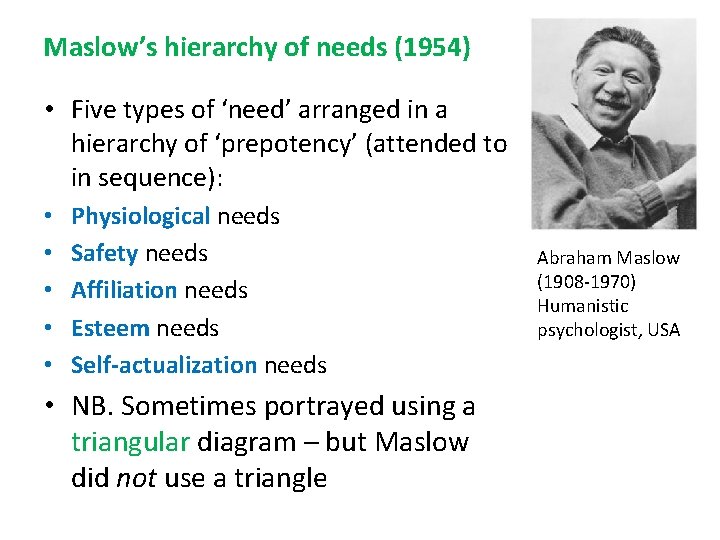
Maslow’s hierarchy of needs (1954) • Five types of ‘need’ arranged in a hierarchy of ‘prepotency’ (attended to in sequence): • • • Physiological needs Safety needs Affiliation needs Esteem needs Self-actualization needs • NB. Sometimes portrayed using a triangular diagram – but Maslow did not use a triangle Abraham Maslow (1908 -1970) Humanistic psychologist, USA
Maslow’s hierarchy of needs contd • Often applied to all desires, but Maslow said the hierarchy applies to ‘basically important needs’, defined as follows: – Thwarting of unimportant desires produces no psychopathological results: thwarting of basically important needs does produce such results' • Hence the harm prevention concept of need • Does leisure, sport, tourism activity prevent harm? • NB: unimportant desires can be seen as wants
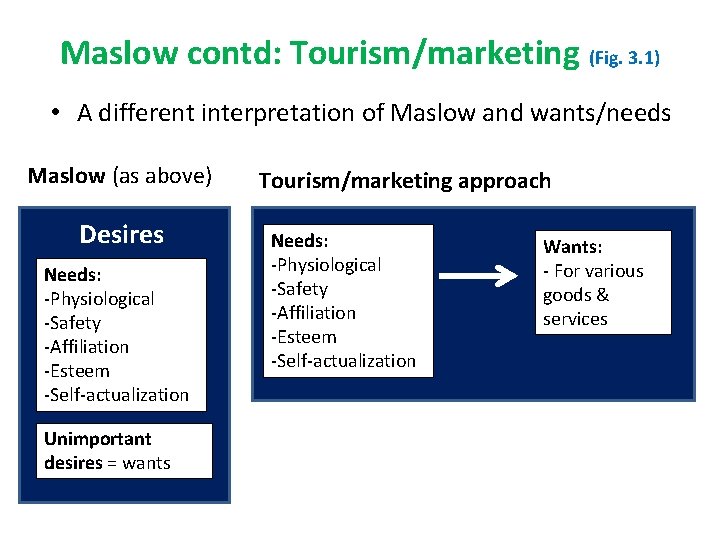
Maslow contd: Tourism/marketing (Fig. 3. 1) • A different interpretation of Maslow and wants/needs Maslow (as above) Desires Needs: -Physiological -Safety -Affiliation -Esteem -Self-actualization Unimportant desires = wants Tourism/marketing approach Needs: -Physiological -Safety -Affiliation -Esteem -Self-actualization Wants: - For various goods & services
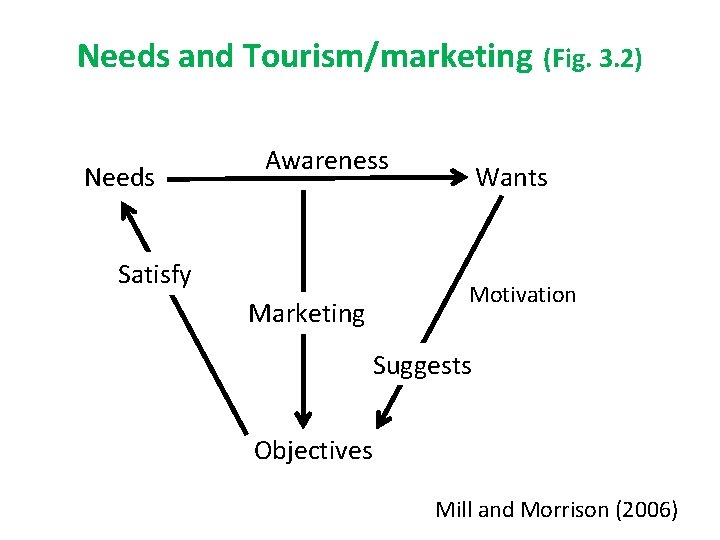
Needs and Tourism/marketing (Fig. 3. 2) Needs Awareness Satisfy Marketing Wants Motivation Suggests Objectives Mill and Morrison (2006)
Need and: Optimal Arousal and Incongruity • Iso-Ahola (US psychologist): rejects Maslow’s hierarchy, but: • Criterion for need is optimal arousal and incongruity in life, ie. : – ‘too little or too much stimulation is damaging to an individual, physiologically and psychologically’ • Therefore accepts harm prevention concept of need • NB similar to Csikzentmihalyi’s concept of ‘flow’
Need and: Leisure Satisfaction Scales • Users of leisure, sport, tourism facilities/services asked to indicate satisfaction related to aspects of the experience – eg. excitement, fitness, relaxation • LST experience assumed to have satisfied needs – So no difference between needs and wants • Level of satisfaction indicated using Likert scales • Examples of scales (all USA): – Leisure Satisfaction Scale (LSS) (Beard and Ragheb) – Paragraphs About Leisure (PAL) (Tinsley et al. ) – Recreation Experience Preference (REP) scale (Driver et al. )
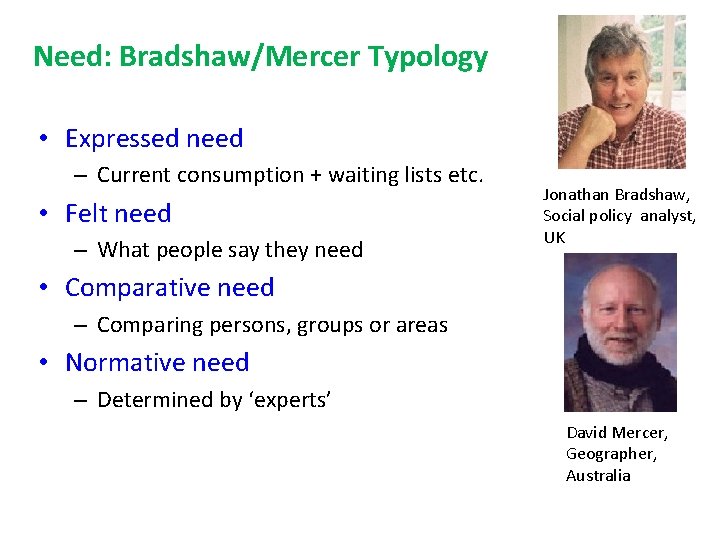
Need: Bradshaw/Mercer Typology • Expressed need – Current consumption + waiting lists etc. • Felt need – What people say they need Jonathan Bradshaw, Social policy analyst, UK • Comparative need – Comparing persons, groups or areas • Normative need – Determined by ‘experts’ David Mercer, Geographer, Australia
Bradshaw/Mercer: issues • Expressed need – What people currently do – so, in fact, includes wants and needs • Felt need – Typically identified by survey: people asked what they would like to do not what they need – Again, therefore, includes wants and needs • Comparative need – Comparing persons, groups or areas – but on what criteria are used? • Normative need – Determined by ‘experts’ – but what criteria are used? • Issue: – Four types of need or four ways of measuring need? • Use in planning/policymaking: – how to reconcile/evaluate 4 different measurements of need.
Universal needs • Maslow is ‘universal’, Bradshaw/Mercer ‘relative’ • Universal approach attempts to list needs applicable to all humans: – Doyal and Gough do not include leisure – Max-Neef includes leisure – Both use ‘harm prevention’ definition of need
False needs • Neo-Marxist concept • ‘Needs’ generated by advertising, etc. Herbert Marcuse: . . those [needs] which are superimposed upon the individual by particular social interests in his repression: the needs which perpetuate toil, aggressiveness, misery, and injustice. . . Most of the prevailing needs to relax, to have fun, to behave and consume in accordance with the advertisements, to love and hate what others love and hate, belong in this category of false needs. (Marcuse, 1964: 5)
Needs and Socio-economic deprivation • Relatively deprived socio-economic groups deemed to be generally in need • Often wide range of (local council) services give priority to deprived groups. • Question: – For people with low income/unemployed, poor housing, etc. : are leisure, sport etc. services a priority?
Need: Implications for public policy • Using harm prevention (Maslow) definition of need: – If deprivation of LST is harmful, public sector has obligations to ensure needs are met • Problem of who makes the assessment of need/harm • Leisure satisfaction scales + tourism marketing conceptualization of need: – All wants/desires are ‘needs’ – No help in determining public policy on basis of need • Bradshaw/Mercer typology: – Different measurements may be useful – But: fails to distinguish between needs/wants
WANTS • Three possibilities a) Needs = a sub-set of wants b) Needs and wants are separate and different c) Needs and wants are the same/interchangeable • (a) is most logical, but complex • (b) is simpler, so adopted in this book • (c ) often used in the literature
OBLIGATIONS • Not all LST activity is related to individual participant’s own needs or wants • Obligations can include: – Take children to park, pool, etc. – Accompanying partner – Social events you are required to attend • Work-related events • Family celebrations • Activities enjoyed by partner – Promises/commitments made • eg. Team/group member
DEMAND • Economic concept • Amount of a good/service which people will purchase at various prices • = a relationship • Demand/supply theory in economics (‘Economics 101’)
Demand curve (Fig. 3. 3)
Price elasticity (Fig. 3. 4) Elastic: demand responds more to price Inelastic: demand responds less to price
Consumer Surplus (Fig. 3. 5) Some purchasers would have been prepared to pay more than P
Demand/supply interaction (Fig. 3. 6)
Demand curve with zero price (Fig. 3. 7) Q 1 = total demand at price zero Actual provision may be : -Less (C 2) – over-use/crowding/waiting lists - More (C 1) – under-use
Researching demand/supply in leisure, sport, tourism contexts • How to establish a demand curve when price is zero or subsidized • Methods – see Chapter 11 – Willingness-to-pay method – Travel cost or Clawson method
Modelling • Quantified models to predict demand in different circumstances • Include not just price, but also: – Consumer/participant characteristics – Supply variables, eg. In addition to prices: • • Location Transport access Size Quality
Demand: critics • ‘Emphasis on price excludes zero price or subsidized services’: wrong (see, eg. Fig. 3. 7) • ‘Demand = free market’: wrong • ‘Does not deal with unmet demand’: wrong • ‘Means ‘more of the same’’: not necessarily • ‘Does not reveal motivation’: but does reveal preferences • ‘Ignores underprivileged’: wrong – see models • ‘Ignores quality of provision’: wrong – see models
BENEFITS • Widely accepted principle: public provision should generate net benefits • Government statements • Alternative approaches: – Benefits Approach to Leisure – Economic approach
Benefits: Official statements (Box 3. 3) • 1996: USA: Surgeon General's Report on Physical Activity and Health Major conclusions (first 3 of 8): 1. People of all ages, both male and female, benefit from regular physical activity. 2. Significant health benefits can be obtained by : – moderate amount of physical activity on most days of the week (e. g. , 30 mins brisk walking, 15 mins running, 45 mins volleyball). – Through a modest increase in daily activity, most Americans can improve their health and quality of life. 3. Additional health benefits can be gained through greater amounts of physical activity. (Surgeon General, 1996: 4)
Benefits: Official statements contd • 1998: Australia: Developing an Active Australia • The health benefits of physical activity have achieved recent prominence in Australia and internationally … Recent reports strongly emphasise the preventive health benefits gained by the accumulation of 30 minutes of moderate-intensity physical activity on most or all days of the week. (Commonwealth Dept of Health and Family Services, 1998) •
Benefits: Official statements contd • 2002: UK: Game Plan From Chapter 2: 'Why do we Care? Benefits and the Role for Government': • Why should government invest in sport and physical activity? • Because they have a major part to play in promoting health, and, can contribute to improved educational outcomes, reduced crime and greater social inclusion: • The benefits of physical activity on health are clear, well evidenced and widely accepted. . • . . there is some evidence that sport and physical activity can benefit education. . . • The role of sport in generating a 'feelgood factor' through international sporting success also appears to be significant (if difficult to quantify). . . (DCMS/Strategy Unit, 2002: 42 -43)
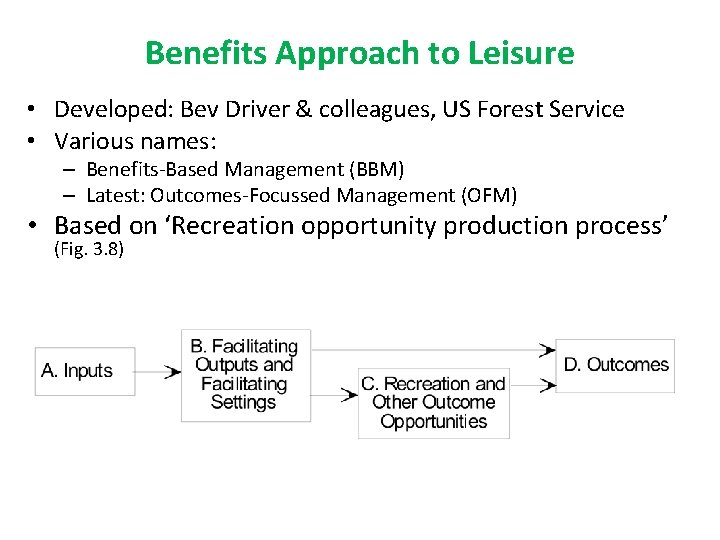
Benefits Approach to Leisure • Developed: Bev Driver & colleagues, US Forest Service • Various names: – Benefits-Based Management (BBM) – Latest: Outcomes-Focussed Management (OFM) • Based on ‘Recreation opportunity production process’ (Fig. 3. 8)
Benefits Approach contd: • Based on data from surveys of existing visitors to natural areas + other stakeholders (Table 3. 2) • Benefits assessed by Likert-scales – (similar to Leisure Satisfaction scales – see need, above) • Numerous benefits assessed: – – Experiential benefits to visitors Benefits to community residents Other health, economic, environmental benefits Negative outcomes (stress, crime, pollution, etc. ) • Large data collection requirements • Analysis? See Chapter 7
Benefits: Economic approach • Cost-benefit analysis • Measures financial expenditure/income, plus: – ‘Public goods’ effects (see Ch. 5) – ‘Externalities’ effects (see Ch. 5) – Equity/rights effects (see Ch. 4) • Large data collection/analysis requirements • Analysis: see Chapter 12
PARTICIPATION • Definition: People taking part in leisure, sport, tourism activities • Policy: Governments beginning to consider participation levels as a focus for policy • Measurement: Participation can be measured in a variety of ways
Participation: Official statements (Box 3. 4) • 2002: Britain: DCMS/Strategy Unit: Game Plan • Our vision is. . . to increase significantly levels of sport and physical activity, particularly among disadvantaged groups • Participation levels need to be raised for the whole population; but interventions should focus on the most economically disadvantaged groups, and within those especially on young people, women and older people • The Government's overall objective is to increase the participation levels of all people, to ensure that society generally achieves the minimum levels of physical activity necessary for maintaining health. (DCMS/ Strategy Unit, 2002)
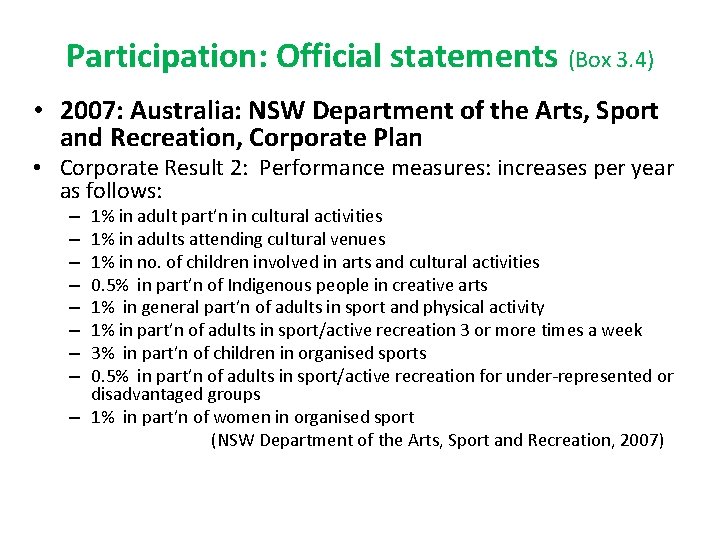
Participation: Official statements (Box 3. 4) • 2007: Australia: NSW Department of the Arts, Sport and Recreation, Corporate Plan • Corporate Result 2: Performance measures: increases per year as follows: 1% in adult part’n in cultural activities 1% in adults attending cultural venues 1% in no. of children involved in arts and cultural activities 0. 5% in part’n of Indigenous people in creative arts 1% in general part’n of adults in sport and physical activity 1% in part’n of adults in sport/active recreation 3 or more times a week 3% in part’n of children in organised sports 0. 5% in part’n of adults in sport/active recreation for under-represented or disadvantaged groups – 1% in part’n of women in organised sport (NSW Department of the Arts, Sport and Recreation, 2007) – – – –
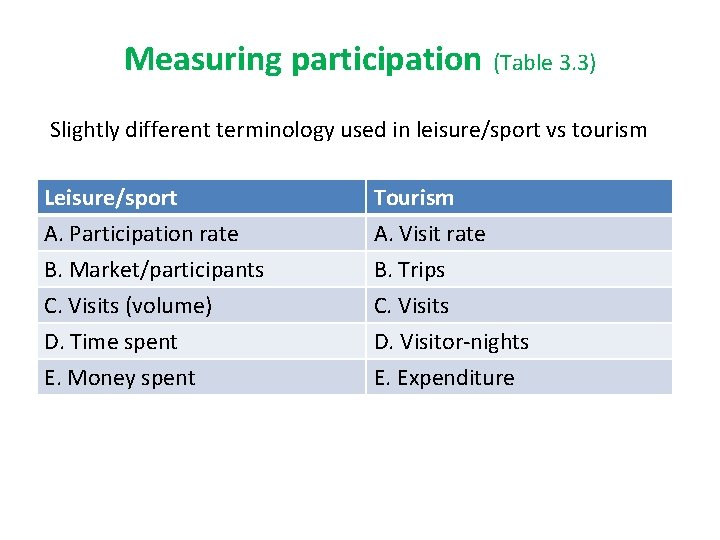
Measuring participation (Table 3. 3) Slightly different terminology used in leisure/sport vs tourism Leisure/sport A. Participation rate B. Market/participants C. Visits (volume) Tourism A. Visit rate B. Trips C. Visits D. Time spent E. Money spent D. Visitor-nights E. Expenditure
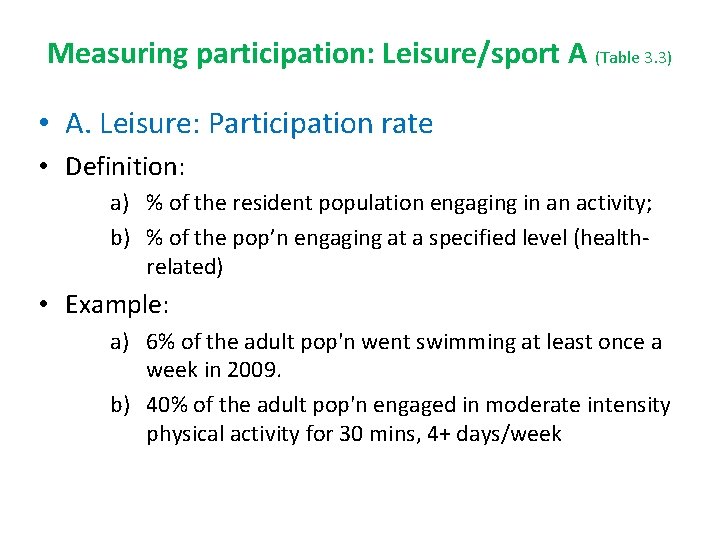
Measuring participation: Leisure/sport A (Table 3. 3) • A. Leisure: Participation rate • Definition: a) % of the resident population engaging in an activity; b) % of the pop’n engaging at a specified level (healthrelated) • Example: a) 6% of the adult pop'n went swimming at least once a week in 2009. b) 40% of the adult pop'n engaged in moderate intensity physical activity for 30 mins, 4+ days/week
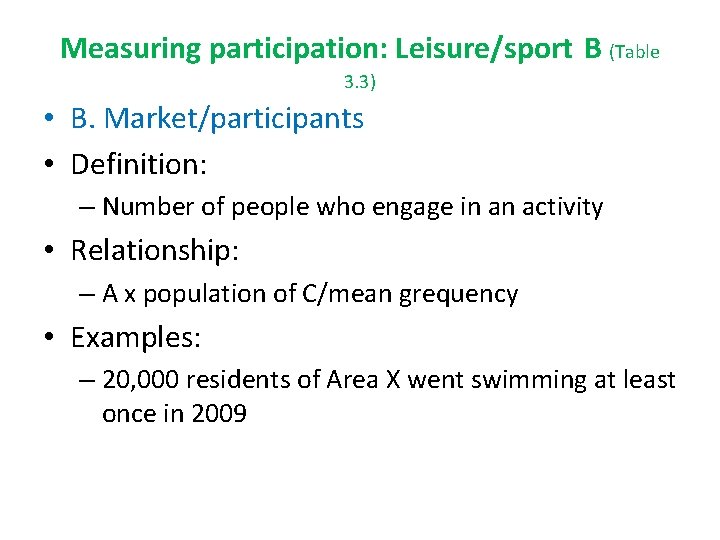
Measuring participation: Leisure/sport B (Table 3. 3) • B. Market/participants • Definition: – Number of people who engage in an activity • Relationship: – A x population of C/mean grequency • Examples: – 20, 000 residents of Area X went swimming at least once in 2009
Measuring participation: Leisure/sport C (Table 3. 3) • C. Visits (volume) • Definition: – The number of engagements (episode/visit/ session) in an activity in a defined (planning) area • Relationship: – B x mean frequency • Examples: – There were 1. 2 million visits to swimming pools in Area X (1 million by residents) in 2009
Measuring participation: Leisure/sport D (Table 3. 3) • D. Time spent • Definition: – Time spent on an activity/group of activities • Relationship: C x time per a. visit, b. period • Examples: a. The average person spends 2. 5 hours a day watching television b. The average visit to Park X lasts 23 minutes
Measuring participation: Leisure/sport E (Table 3. 3) • E. Money spent • Definition: – Money spent: total/per head/per household on a leisure activities, goods/services. • Relationship: – C x spend per visit • Example: – Consumer expenditure on leisure in Britain is £ 50 billion a year
Measuring participation: Tourism A (Table 3. 3) • A. Visit rate • Definition: – The proportion of the population of a Tourist Generating Regions (TGR) that visits a Tourist Destination Region (TDR) • Example: – 5% of the adult population of Region Y visited Region X in the year 2009
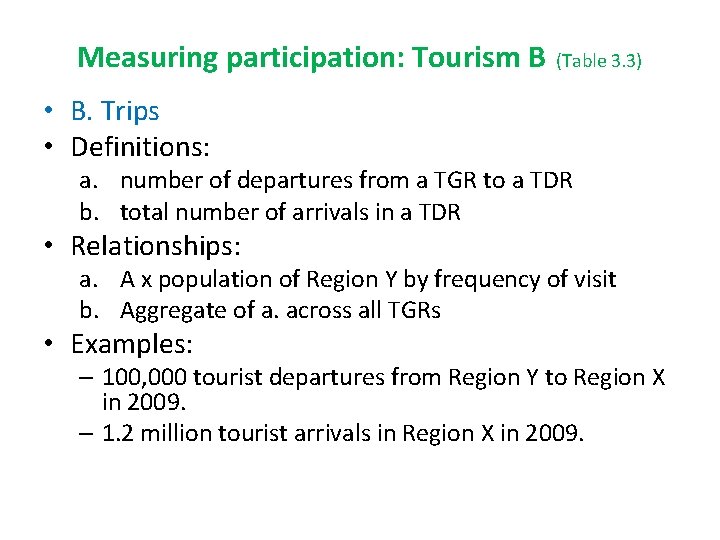
Measuring participation: Tourism B (Table 3. 3) • B. Trips • Definitions: a. number of departures from a TGR to a TDR b. total number of arrivals in a TDR • Relationships: a. A x population of Region Y by frequency of visit b. Aggregate of a. across all TGRs • Examples: – 100, 000 tourist departures from Region Y to Region X in 2009. – 1. 2 million tourist arrivals in Region X in 2009.
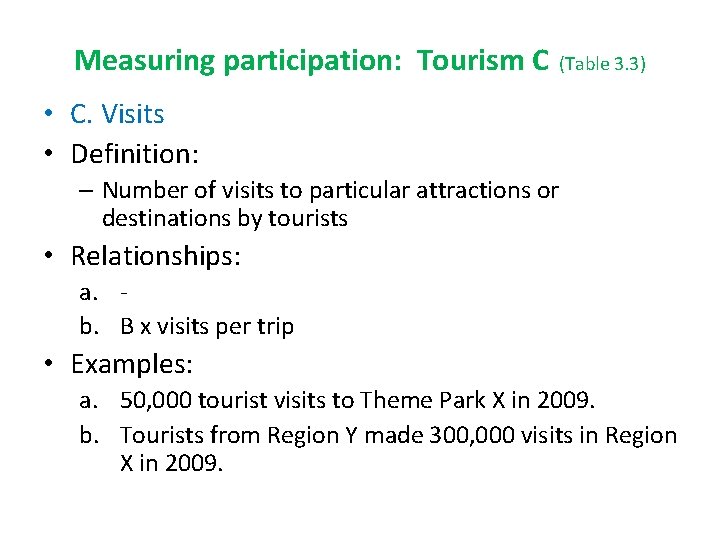
Measuring participation: Tourism C (Table 3. 3) • C. Visits • Definition: – Number of visits to particular attractions or destinations by tourists • Relationships: a. b. B x visits per trip • Examples: a. 50, 000 tourist visits to Theme Park X in 2009. b. Tourists from Region Y made 300, 000 visits in Region X in 2009.
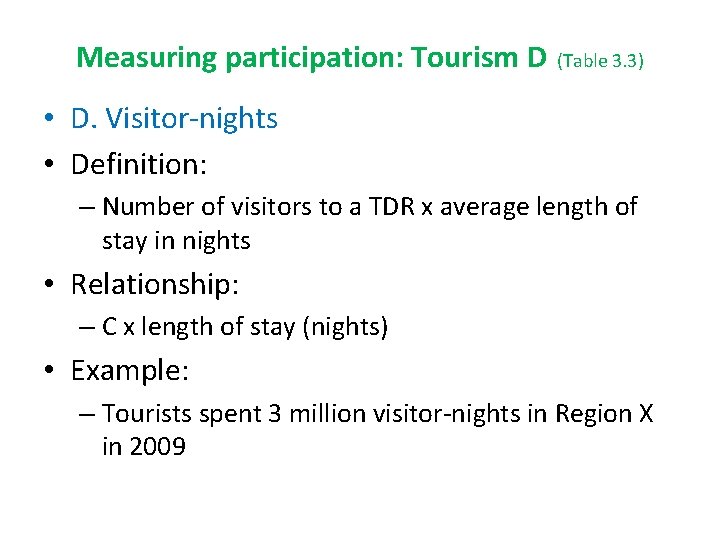
Measuring participation: Tourism D (Table 3. 3) • D. Visitor-nights • Definition: – Number of visitors to a TDR x average length of stay in nights • Relationship: – C x length of stay (nights) • Example: – Tourists spent 3 million visitor-nights in Region X in 2009
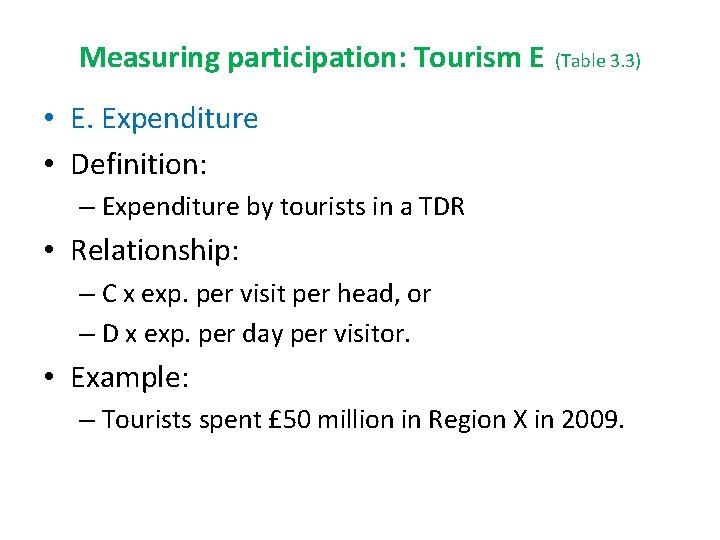
Measuring participation: Tourism E (Table 3. 3) • E. Expenditure • Definition: – Expenditure by tourists in a TDR • Relationship: – C x exp. per visit per head, or – D x exp. per day per visitor. • Example: – Tourists spent £ 50 million in Region X in 2009.
Other relevant concepts • Opportunities – Available facilities/services (see Box 3. 5 + Ch. 7) • Collective consumption – Services consumed collectively, ie. by the community (Castells) – Public services • Quality-of-life – Multi-variable measurement of standard of living, health, services available, etc. • Well-being: – Multi-variable measure of standard of living etc: – Governance, income, work, health, relationships