Introduction to Geography People Places and Environment 6


- Slides: 97

Introduction to Geography People, Places, and Environment, 6 e Carl Dahlman William H. Renwick Chapter 6: Population, Population Increase and Migration Holly Barcus Morehead State University And Joe Naumann Umsl

Population • Population geography – Distribution of humankind • Emigration • Immigration • Demography – Specific group characteristics 2

Distribution and Density • Current World Population – 6. 3 billion • Major concentrations – ranked by size 1. 2. 3. 4. 5. East Asia South Asia Europe from the Atlantic to Ural mountains Eastern United States and Canada Southeast Asia 3

World Population Cartogram 4 3 1 2 5

Population Density • Arithmetic density – Number of people per unit of area • Physiological density – Density of population per unit cropland • Carrying capacity The numbers of any population that can be adequately supported by the available resources upon which that population subsists; for humans, the numbers supportable by the known and utilized resources – usually agricultural – of an area. [closely related to physiological density]. 5

Definitions: • Birth Rate (crude birth rate) – Expressed as the number of births per year per 1000 population • Total Fertility Rate – The average number of children that would be born to each woman if during her child-bearing years, she bore children at the current year’s rate for women that age. Replacement rate is 2. 1. • Death Rate (crude death rate) – Expressed as the number of deaths per year per 1000 population. Also called mortality rate. 6

More Definitions: • Infant Mortality Rate – Expressed as the number of children who die between birth and one year of age in a year per 1000 population. • Population Pyramid – A graphic depiction of the age and sex composition of a (usually national) population. • Natural Increase – The growth of a population through excess of births over deaths, excluding the effects of immigration or emigration. This can be a negative number. 7

Even More Definitions: • Doubling Time – The time period required for any beginning total (population) experiencing a compounding growth, to double in size. • Population Density – the total population of a country divided by the total area in square miles or kilometers. • Physiological density – (population pressure) The number of persons per unit area of agricultural land. This is more meaningful than population density. 8

Factors Influencing Population Distribution • Climate – Low density – High density • Topography and soils – Flat areas = easier cultivation – Accessibility to water – Fertile soils • History – Domestication of plants and animals – Demarcation of cultural and political territories 9

World Population Growth • Crude birth rate • Crude death rate • Natural increase • Natural decrease 10

Focus on the last 600 years! 11

Exponential Population Growth • See Demographic Transition Stage Two 12

Population Explosion? • Click on the picture to see the video 13

Projections • • • Fertility rate Total fertility rate Replacement rate Zero population growth Doubling time 14

Population Growth


Population Pyramids – Age and sex structure of population • Dependency ratio – Proportion of population of working age 17


Demographic Transition • Many developing countries are in mid to late stage 2 of the transition. 20

Stages of Population Growth Birth Rate Death Rate Growth Rate Stage High 1 High Stable or growing slowly -long doubling time Stage High & beginning to 2 decline slowly Dropping sharply Continually increasing – short doubling time Stage Declining more rapidly 3 Dropping but at a slower rate Increasing but at a declining rate – doubling time still rather short Stage Low 4 Low stability, or declining – long doubling time 21

Demographic Transition Model • Stage one – Crude birth/death rate high – Fragile population • Stage two & three – Decreasing death rates – birth rate decreasing in stage 3 too – Infant mortality rate high – declining in stage 3 – Natural increase high – declining in stage 3 • Stage four – Indicative of richer developed countries – Higher standards of living/education 22


Population Growth • The meaning of large numbers is relative to a number of factors in each country. – Rate of natural increase – Average life expectancy – Carrying capacity or physiological density – Technological level of the culture and the level of infrastructure development • Increased physiological Density – increased population pressure 25

Growth – China & USA • China – A 1% growth rate in China means 12, 552, 910 more people the next year and slightly more the next. – Arable land (hectares person) 0. 10 • USA – A 1% growth rate in the USA means 2, 737, 540 more people next year and slightly more the next. – Arable land (hectares person) 0. 67 26

Pressure on the Land • Terraced rice paddies are very labor-intensive – 27 not a first choice method.

Carrying Capacity 28

Central America What accounts for growth here? 29

Canada’s population • Why the strange pattern? 30

Population Growth Projection 31

Population Structure • Broad base and narrow top will mean high growth rate • Yellow: stage 4 • Red: stage 2&3 32

Selected Countries: Patterns 33

China’s Population Policy • Under Mao Zedong – no emphasis on reducing population growth rate. • Under Deng Xiaoping – Onechild per family policy. 34

The Demographic Transition • The Western Experience – Four stages are based on the European experience • Today, we live in a world divided. – Developed vs. developing countries – Effects of urbanization and industrialization are taking longer to influence population growth rates in the developing countries. – Developing countries are not experiencing a gradual shift resulting from technological and social changes occurring within their culture – it is more a response to outside influences. 35

Difference in Transitions 36

37

Urbanization – Developed World • Europe & North America grew with the industrial revolution – lower birth rates in urban areas of developed countries. 38

Urbanization –Developing World • Asia, Africa, Latin America, etc. increased as an alternative to rural poverty or famine, but there often wasn’t enough 39 industrial development to provide jobs – favelas and barrios

Life Expectancy • Infant mortality rate • Antibiotics/immunization • Rapid increase throughout world 40


Population - Developed Countries 42

Infant Mortality Rates 43

New Influences on Birth Rates • Family planning programs • Contraceptive technology • Role of mass media 44

Declining numbers of school-age children in some Asian countries – 2000 – 2020 CE What’s different about these countries? 45

Population Control • Obstacles – Manufacture/distribution expense – Religion – Low female status – Preference of male children (females marry and join their husband’s family) 46

Birth Control Programs • One family/one child policies (China by law) – Female infanticide – Social compensation fees • • • Sterilization (India: of men by persuasion) Loss of status Termination healthcare/food coupons Free birth control Increased literacy – important for success 47

Population Data and Projections • Population Data Sources – not always clear – United Nations – World Bank – Population Reference Bureau – National censuses -- • Population Projections – estimates of future population size, age, and sex composition based on current data. Based on observed trends. 48

Based on Census Data Projected Growth 49

World Death Rates • Infectious diseases – HIV/AIDS – SARS – affects lung mechanics • Degenerative diseases – Obesity – more serious in developed countries like USA – Tobacco use – legal, insidious, money-making addiction • Epidemiology – – all the elements contributing to the occurrence or nonoccurrence of a disease in a population; ecology of a disease • Epidemiological transition – infectious to degenerative 50

Estimated Number of Persons of Concern Who Fall Under the Mandate of UNHCR

Overpopulation? • Malthus and Neo-Malthusianism – Sees a direct relationship between the size of population and the means of subsistence. – Dire predictions were not realized because N. & S. America were discovered and could greatly increase the world’s carrying capacity – for a time – Can technology be counted on to forever push back the perceived limits on food production and pollution control? • Cornucopians – Optimistic perspective: technology will find a way, somehow – Jean Antoine Condorcet • Analogy of “fruit fly jars” 52

Overpopulation? • Overpopulation – relative term – according to whose perceptions? Has some relationship to carrying capacity or physiological density 53

Cartogram 1995 population • Note Africa & Asia 54

Cartogram 2030 population • Note Africa & Asia 55

Population Prospects • Worldwide Fertility Declines – – Effects of urbanization – Government programs – India, Singapore, China • Implications of Demographic Momentum – Age structure is significant in keeping growth going – large populations below age 15 keep growing – improved health extends the time in which they may procreate • The Aging of World Population – Even in developing countries – exceeding developed ones – Must be supported by the young. . . 56

Demographic Patterns • Sex ratios – Effects of • Ultrasound, amniocentesis • Male status • Aging – Increased median age – Rich countries • Sustaining economic growth • The “sandwich generation” • Medical needs – Poor countries • Young populations • Changing social needs 57

Spatial Behavior – Migration & Immigration

Spatial Behavior • Affected by perceptions • Affected by sense of space – Personal – Community • Aspect of culture 59

Mental Maps – personal perception of reality • Vary greatly according to one’s experiences & interests & reaction to distance decay – Influence our actions and decisions – Fred Broer’s visit to St. Louis -- 1965 • I was raised in N. St. Louis and N. St. Louis County – I have a fairly accurate mental map of those areas – S. St. Louis and S. St. Louis County are much less accurate in my mental map 60

Perception of Natural Hazards • Earthquakes, tornadoes, hurricanes, tsunami, mudslides, etc. • Why do people choose to live where they occur? – Great River Road north of Alton, IL • What they know – it’s home. • Hazards occur infrequently – another “flood of 93” isn’t expected for a long time. • Prohibitive cost of relocation 61

Activity Space • Personal Activity Space – realm of free movement • Territoriality – emotional attachment to an area – Personal space varies according to cultures – Ethnic neighborhoods – some persist for a long time 62

3 variables affect activity space • Stage in Life Course – age-group membership parameters • Mobility – ability to travel – Personal ability – ownership of mode of transport and/or funds – Public access available? • Opportunities – related to infrastructure and income – Few in a subsistence economy – Many in urban/industrialized economy 63

Spatial Interaction and Information • Barriers to Interaction – Distance – technology affects the parameters – Natural obstacles – rivers, mountains, etc. – important role of technology • Spatial Interaction & Innovation – centers of high interaction became culture hearths – ideas easily cross-pollinated there – – Middle East—Eastern Mediterranean Huang He Valley—Indus Valley Meso-America & Altiplano Europe since the Renaissance 64

MIGRATIONS

Migrations are as old as humanity • Early Humans migrated from Africa and spread to the other land masses of the world • Native Americans migrated across the Bering land bridge. • Africans migrated, against their will, to the new world • The Bantu people migrated and populated from West Africa to South Africa 66

Migration • Push factors – Drive away people • Pull factors – Attract people • Migration chains 67

Decision Process • Spatial Search – process by which alternatives are evaluated – Influenced by information available • Quality • Quantity – Influenced by the utility assigned to places and the opportunities at those places • A cost/benefit analysis of sorts • Push & Pull factors can work both ways 68

Migration of Peoples • • Prehistoric Europe to the Americas African diaspora Europe to Asia & Oceania Europe to Africa Indian Overseas Chinese 69

Prehistoric Human Migrations

Crossing Beringia (land bridge) • Most ancestors of Amerindians are believed to have come to the Americas via Beringia (the Bering Strait) 71

Early Migrations – Aegean Sea 72

Overseas Chinese Migration 73

Early Pacific Migrations 74

Barbarian invasions of Rome 75

Gateway for a Major Migration 76

Slave Trade

European Migration -19 th Century

Europe after 1945 • From less to more prosperous coutnries • “Guest workers” – Often men • Worker’s remittances 79

1950 1990 Change in African-American Population 1950 -1990 80

Different Scales of Migration • • Local – Urban to Suburban State – Rural to Urban/Suburban Regional – Rust Belt to Sun Belt International – Country to Country – Legal immigration – Illegal immigration • WHATEVER THE SCALE, SOME TYPE OF PUSH AND/OR PULL FACTORS WERE INVOLVED IN THE DECISION. 81

Reasons Americans Migrate • Changes in life course – marriage, etc. • Change in career cycle – leaving college, job transfer • Forced migrations – urban development, construction projects, etc. such as airport expansion • Neighborhood changes from which some choose to flee • Changes associated with individual personality • Historically part of our culture 82

Barriers to Migration • • Physical – terrain, deserts, oceans Economic – cost increases with distance Lack of knowledge of opportunities Roots – ties to individuals and institutions in the original activity space • Regulations in the receiving country (may not be too effective) and military resistance • Psychological – perceptions of distance and difficulty • Government regulations against emigration (former 83 Soviet “Bloc”)

84

85

Government Policy? • In the light of September 11, 2001, there will be much debate about immigration policy. Most of us are glad the door was open to our ancestors; however, . . . . 86

Patterns of Migration • Migration field – An area that sends or receives major migration flows – Channelized pattern of flow – persistent patterns – Influence of past patterns of flow – Job opportunities & Economic influences – Ethnic affinity – Return migration –shortly after migrating decide to return (in free conditions, 25%) • #1 false expectations & #2 adjustment problems – Hierarchical migration • People moving up the levels of urban hierarchy from small places to large ones 87

Notable Migrations • • • Ancestors of Amerindians Phoenicians & Greeks around the Mediterranean Norsemen (Normans) Europeans to the “New World” and Australia Russians eastward into Siberia European Americans westward in USA Afro-Americans from south to north & urban centers Bantu migration to south and east in Africa Chinese to southeast Asia & islands Afrikaners to the high Veldt U. S. “Rustbelt” to the “Sunbelt” Mexicans to the U. S. southwest (illegals) 88

Migration Today • 2002 = 175 million living outside country of birth • Characteristics – Many poor, uneducated, unskilled – Enterprising, working age looking for opportunity – Many also highly educated and skilled • Refugees – 1951 Geneva convention – Asylum 89

International Migration • Increased apprehension in receiving countries – “Compassion fatigue” – Immigrants are scapegoats when unemployment rises • Emigration – Importance of remittances • Mexico = 3 rd largest source of foreign exchange 90

International Migration • Europe as a destination – – 16 million immigrants 7 -10 percent of host country population Problems = religion, education Contributions = entrepreneurs • Migration of Asians – 4 -5 million work abroad – Remittances important – Loss to home communities 91

Migration to the US and Canada • US – – Largest migration flow to US 10% US population foreign born Immigration quotas restrict immigration Implications • Hispanics as proportion of US population • Canada – 18. 4 percent population foreign born – 94 percent live in metro areas 92

Source of immigrants to the USA Foreign-born population in the USA by region of birth

New Controversies • Additional costs for public services? • Importing poverty? • Local costs of immigration – California • “Melting pot” or “cultural mosaic”? 94

Global Warming & Migration • Climate change has spurred past migrations – Oakies of U. S. dust bowl era – Huns in 5 th century CE – Ice ages • The major effect of global warming is expected to be climate change; however, no one can accurately predict what changes will occur where and to what extent? • Might this trigger new migration patterns? 95

The Demographic Equation • Demographic equation summarizes the contribution made to regional population change over time by the combination of natural change and net migration. – Population Relocation – immigration/emigration – two sides of a movement – Immigration Impacts on the demographic equation – increases as the population size of the areal unit studied decreases – TP = Natural Increase + Immigration - emigration 96

End of Chapter 5 97
 Human geography places and regions in global context
 Unit 1 people
 People and places
 People and places
 People and places
 Fantastic places geography
 Why are different places similar geography
 Quickly comparative
 Common nouns places
 People places leisure
 These bills deal with individual people or places
 Safe people safe places
 People, places, things, or ideas
 It is name of persons places or things
 What are the people as media
 Environment of business finance
 Geography/environment of olmec
 Hei ap human geography
 In the usa the big cia
 Managing people in software environment
 Ap human geography frq examples
 5 themes of geography ap human geography
 Stateless nation
 Transformed people transform people
 Justpeople
 Barker's ecological theory of environmental psychology
 Meaning of business environment in simple words
 Companies who passively accept the marketing environment
 Environment introduction
 Legal ethical and societal issues in media and information
 How to calculate upper bound
 Removes selected text and places it on the clipboard
 Places and faces of the ffa
 Whats the ffa motto
 Key issue 3 why are different places similar
 Cloud computing places the processing and
 Healthy spaces and places
 Healthy spaces and places
 Smiling faces beautiful places
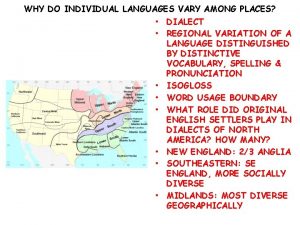
 Why do individual languages vary among places
 What is the name of the island tamal tells andy about
 Decimal place value
 Famous places in lithuania
 Places you can feel your pulse
 North dakota state animal
 Place value decimal
 What is a round number
 Round to 3 decimal places
 Images
 Les places de stationnement
 Places where plates move apart
 Contoh kalimat public places
 Locating places on earth
 4 decimal places
 Examplanning.com
 Naming words for places
 Spatial order writing
 Tens hundreds thousands
 Decimal tenths place
 How to move decimal places
 Naming words for places
 Incremental decision process model
 Match the places with pictures
 Do you know these places
 Triangle jeopardy
 Tectonic plates interact at places called plate
 1 gagnant 3 places
 Jubail tourist places
 Kirsten places her surveyor's telescope
 Good places better health
 French speaking places in the world
 En quittant cette terre
 Do you know where are these places
 Key issue 3: why do individual languages vary among places?
 Elastic potential energy ex
 Courting-places meaning
 Bubbly creek
 Unit 2 places to visit
 Who has defined style as proper words in proper places
 Going places ar barton
 Precipitation
 Describing places exercises
 Seven treasures chinatown
 Key issue 3 why do some places face health challenges
 Acid base song
 Describing places ppt
 Famous places in ukraine
 Carl herold programmer
 Bad manners are
 Why did mahayana buddhism have mass appeal in some places?
 Playgrounds are such pushy places ,know what i mean?
 Places at school vocabulary
 Holy places
 Language
 Safer places scheme
 Unsafe places in school
 Place of articulation consonants
 Adverbs of place pictures
