Introduction to Geography People Places and Environment 4


 n n n Affected by: Angle of incidence –")


 n (1) Convectional precipitation ¡ ¡ ¡ n")
 Orographic Precipitation n n Wind forces air up and over mountains Rain on")
 Frontal Precipitation n This happens when air is forced up the boundary between")


 Inter-tropical convergence")

 Polar high-pressure zones n The intense cold causes dense air because")
")


- Slides: 29
Introduction to Geography People, Places, and Environment, 4 e Edward F. Bergman William H. Renwick Chapter 2: Weather and Climate Victoria Alapo, Instructor Geog 1010
Weather and Climate n Weather ¡ n Day-to-day variations in temperature and precipitation. Examples: temporary storms, temperature changes. Climate ¡ Statistical summary of weather conditions over several decades or more, but usually 30 yrs. ¡ Thirty years was chosen as a period long enough to eliminate year-to-year variations. Source: http: //www. metoffice. gov. uk/climate/uk/averages/ ¡
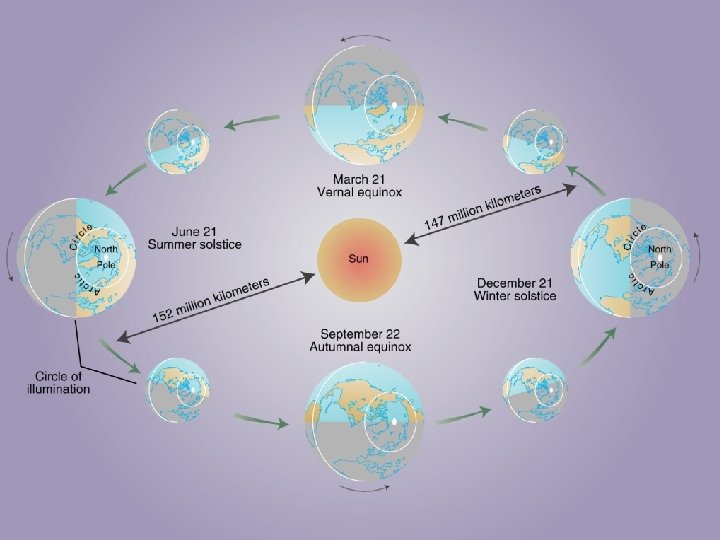
Intensity of Solar Radiation (Insolation) n n n Affected by: Angle of incidence – more vertical at the equator. Oblique towards the poles. Also, axial tilt = 23. 5 degrees.
Latitude n Summer Solstice – June 20 or 21 Longer days In the northern hemisphere n Winter Solstice – December 20 or 21 Longer nights in the northern hemisphere n But in the southern hemisphere, the opposite is occurring on both days! (June & Dec) n Equinoxes ¡ ¡ ¡ (equal day/night) – see next slide. Vernal/Spring Equinox – March 20 or 21 Autumnal Equinox – Sept. 20 or 21
Greenhouse Effect n n Explain the “Greenhouse Effect” Greenhouse gases ¡ n Water vapor, carbon dioxide, ozone, methane Increased greenhouse gases = increased global warming
Relative Humidity n Water content of air; it measures the “wetness of air”. n It’s also the percent (%) of water air could hold at a given temperature (as seen on TV).
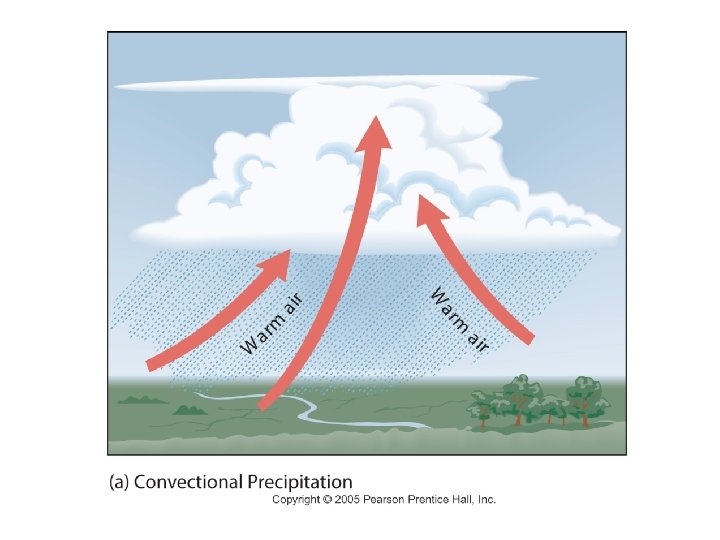
Precipitation: 3 Types (ways it forms) n (1) Convectional precipitation ¡ ¡ ¡ n Warm, humid air rises, and cools Saturation point is reached Clouds form Leads to convectional storms
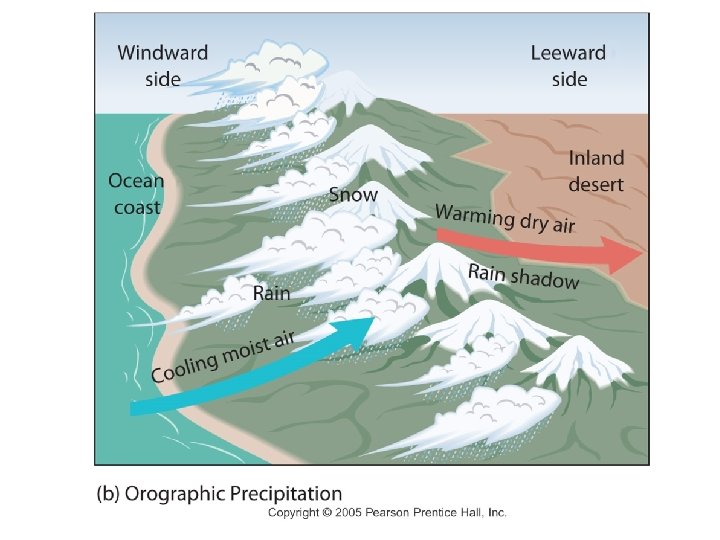
(2) Orographic Precipitation n n Wind forces air up and over mountains Rain on windward side Desert on leeward side: Rain shadow Examples ¡ The Rockies and Sierra Nevada. Also, see picture on pg 55, and caption.
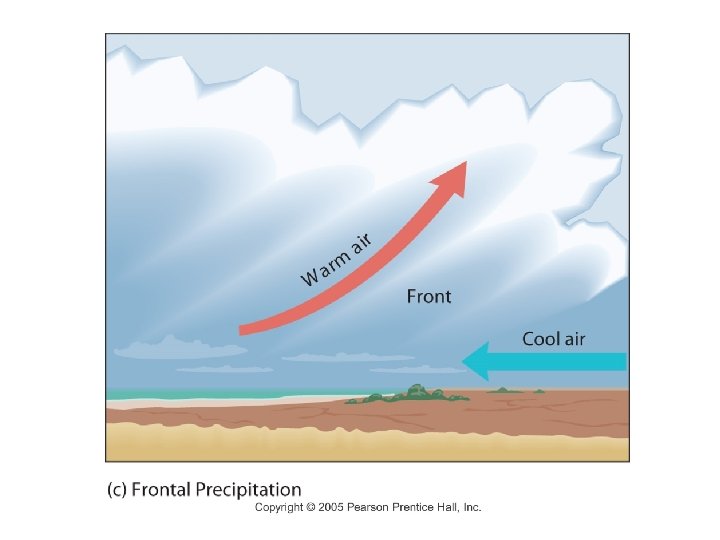
(3) Frontal Precipitation n This happens when air is forced up the boundary between cold and warm air masses (called a front). n Cold front ¡ n When cold air mass moves towards warm air mass Warm front ¡ ¡ When warm air mass moves towards cooler air mass See animation
Circulation Patterns n Air mass = 14. 7 lbs per square inch. Air has weight! Think of a cylinder of propane/oxygen. n Atmospheric pressure ¡ Varies with altitude n n ¡ Higher altitude = less atmospheric pressure That’s why your ear ‘pops’ as the pressure increases on descent in an airplane. Barometer – instrument for measuring pressure.
Pressure and Winds n Coriolis Effect ¡ An apparent deflection of any freely moving object from its expected (straight) path, caused by the Earth’s rotation. The earth rotates from west to east. ¡ Causes winds to move in an indirect, curving path, including hurricanes, and ocean currents, see next slide. If the earth did not move (rotate), winds would just move in a straight line from high pressure to low pressure. ¡ Happens to planes too, esp. when traveling in a straight line from the north pole to the equator. That’s why pilots fly in a curve. Otherwise, they’ll land to the west of their intended destination. See animation.
Ocean Circulation Patterns Gyres is the special name ocean currents are called. ¡ These are wind-driven circular flows.
Coriolis Effect
Global Circulation
Global Circulation n Only 3 of these zones will be discussed: A) Inter-tropical convergence zone (ITCZ) ¡ This is where the N/E & S/E winds converge. See previous slide. These converging winds are also called “Trade Winds”, because they were important to sailing ships. B) Subtropical high-pressure zones n These areas of dry, bright sunshine, and little precipitation. They cause deserts. It is an area of warm dry air found about 30 degrees N & S latitudes. See next slide.
Subtropical Highs Responsible for the world’s greatest deserts. Dry conditions caused by no uplift of air due to high pressure.
Global Circulation C) Polar high-pressure zones n The intense cold causes dense air because coldness causes contraction, and so there is little molecular space, therefore air can’t lift. This causes high pressure. n As a result, the air stays close to the ground and there is little precipitation, leading to “polar deserts”. Polar deserts are typically drier than hot deserts – see climograph of Mc. Murdo, Antarctica.
Storms n Cyclones ¡ ¡ These are low-pressure systems There are 2 types: A) Hurricanes (N/America) and Typhoons (Pacific) ¡ Also known as tropical cyclones B) Midlatitude cyclones – tornadoes, Box on pg 66.
Storms Hurricanes/ Typhoons: ¡ Need warm, moist air n n ¡ Most powerful over oceans (occur more during summer). Once the winds reach 74 miles/hr they are called hurricanes/typhoons. They cause storm surges n This is when there is an elevated sea level in the center of the storm. i. e. high waves crashing inland (e. g. Katrina). 90% of people die from this.
World Precipitation 2 primary measures of climate are: Temperature & Precipitation
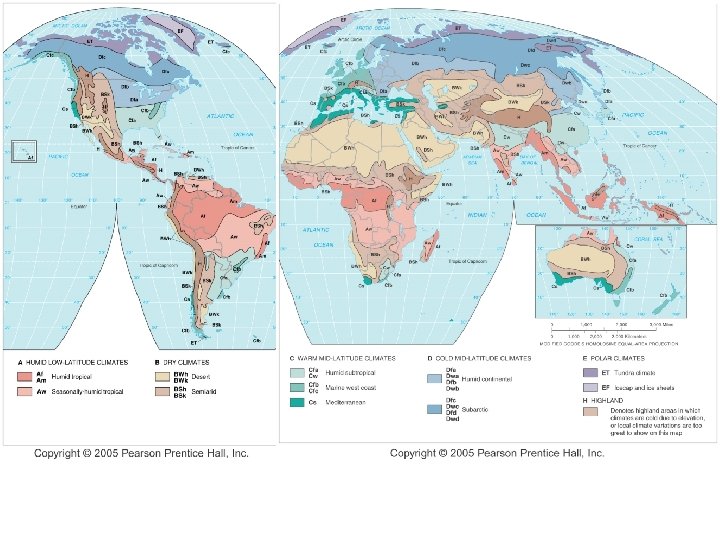
Classifying Climate n The Köppen System ¡ It is the most widely used system and was developed by Wladimir Köppen in 1918. ¡ He used the distribution of plants to help draw boundaries btw climate regions (because vegetation types tend to closely follow precipitation and hence temperature in area). So these 3 are interrelated. ¡ Köppen identified 5 basic climate types, and subdivided them further to reveal important distinctions. See page 74 & 75 of text and next slide. An American Professor added the H Climate (Mountains) ¡ These classifications allows analysis and planning by geographers, govts, etc.
Climate Regions n As the map shows, these regions are horizontal bands based on latitude. Read about each climatic region (A to E) on your own. Pages 76 to 86. n Sometimes climatologists use climographs to show temp and precipitation for every month of the year. Every climatic region and every city in the world has one. Draw a simple one for the test. n The on next slide is for Lanzhou, China (pg 79). n Also see website for Omaha climograph: http: //www. hprcc. unl. edu/stations/index. php? action=metada ta&network_station_id=256255 n
Omaha – Eppley Station Data: http: //www. hprcc. un l. edu/stations/index. php? action=metada ta&network_station _id=256255
Climate Change The earth has alternated btw warm & cold periods over time. 3 hypotheses – reasons given for climate change: n Astronomical n ¡ n Geologic ¡ n Sunspots – relatively cool regions on the surface of the sun, which varies in #, in a cycle lasting 11 yrs. Volcanic eruptions – large amts of dust & gases can be ejected to reduce solar radiation, and cool the earth. E. g. Krakatau, Indonesia. Human ¡ ¡ Atmosphere – increase in CO 2 in the atmosphere since the start of the industrial revolution in the 18 th century. CO 2 is a greenhouse gas. Vegetation – clearing