Incorporating AVs in Ohio 3 C CTRAMP 2


- Slides: 61
Incorporating AVs in Ohio 3 C CT-RAMP 2 Model Peter Vovsha, Gaurav Vyas (WSP) September 14, 2018 1
General approach to incorporate AVs Expected impacts and affected sub-models 2
AV implications for transportation/urban planning • Earlier focuses: • Congestion reduction due to a better use of road capacity • VMT growth due to ZOV and higher trip rates • Replacement for transit (especially with MAAS/TNCs) • Recent recognition: • Parking demand, regulations, and tradeoffs with ZOV repositioning; possibility to remove parking from the city centers and replace it with AV staging areas • Integration with mass rapid transit and reshaping stations & services • Impacts on car ownership and interplay between privately owned AVs and shared AVs in TNCs • Mobility equity and special population groups (elderly, disable) • Far-reaching concept of a “smart city” (how the land-use could/should be reshaped with AVs) 3
AV impacts reflected in travel model 4
Requirements for consistent modeling of AVs • One generic approach that can handle regular vehicles and AVs in a single modeling framework: • Not a special AV model or post-processing! • AV penetration rate as a scenario parameter: • If 0% - standard 3 C ABM for all HHs • If 100% - AV version for all HHs • If between 0% and 100% - HHs are split into 2 groups • Other essential parameters / AV assumptions: • Listed in the global control file • Due to many factors of uncertainty multiple scenario analysis is essential 5
AV impacts on travel demand How AVs affect travel demand 6
How vehicles are used • Elderly, youth, disable, and other people without a driver license will have access to AVs; auto driver mode availability should not be constrained by age of 16 but extended to age of 12, 8, or even 5: • Mode choice • Escorting needs reduced or completely eliminated • Cars become available at any location any time, including non-home locations even if not used earlier in tour, and not necessarily from home for the entire tour: • Mode choice and multi-modal tour mode combinations • Empty repositioning trips made by AVs facilitate intra-household sharing of cars (and TNC): • car. Track • Ease to order a shared AV from TNC: • Mode choice (cheap ubiquitous driverless taxi/TNC that can increase the currently negligible share) • Accessibility impact on car ownership 7
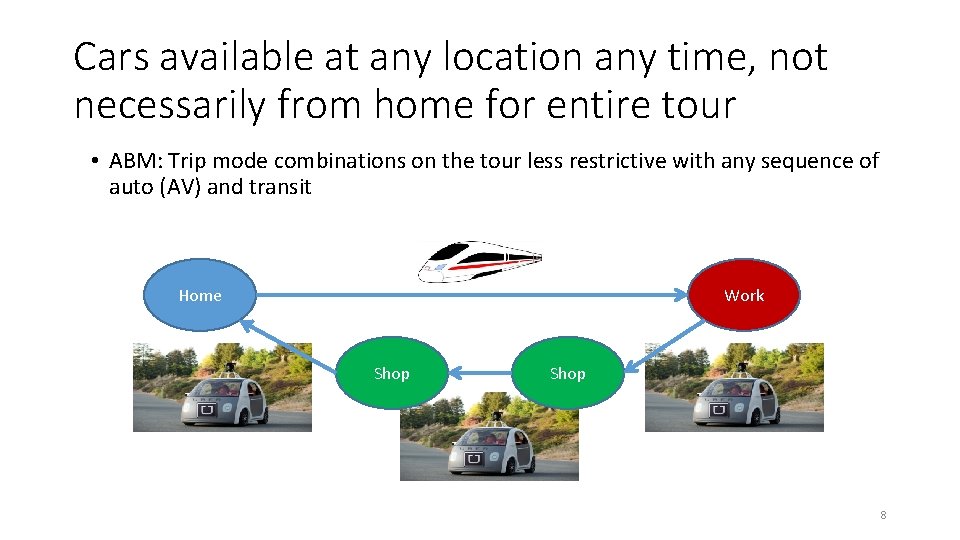
Cars available at any location any time, not necessarily from home for entire tour • ABM: Trip mode combinations on the tour less restrictive with any sequence of auto (AV) and transit Home Work Shop 8
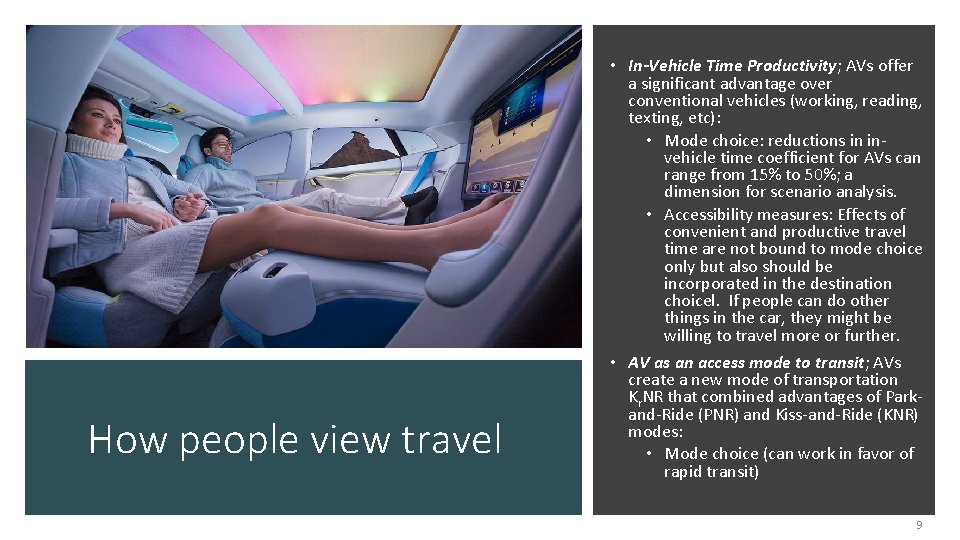
How people view travel • In-Vehicle Time Productivity; AVs offer a significant advantage over conventional vehicles (working, reading, texting, etc): • Mode choice: reductions in invehicle time coefficient for AVs can range from 15% to 50%; a dimension for scenario analysis. • Accessibility measures: Effects of convenient and productive travel time are not bound to mode choice only but also should be incorporated in the destination choicel. If people can do other things in the car, they might be willing to travel more or further. • AV as an access mode to transit; AVs create a new mode of transportation Kr. NR that combined advantages of Parkand-Ride (PNR) and Kiss-and-Ride (KNR) modes: • Mode choice (can work in favor of rapid transit) 9
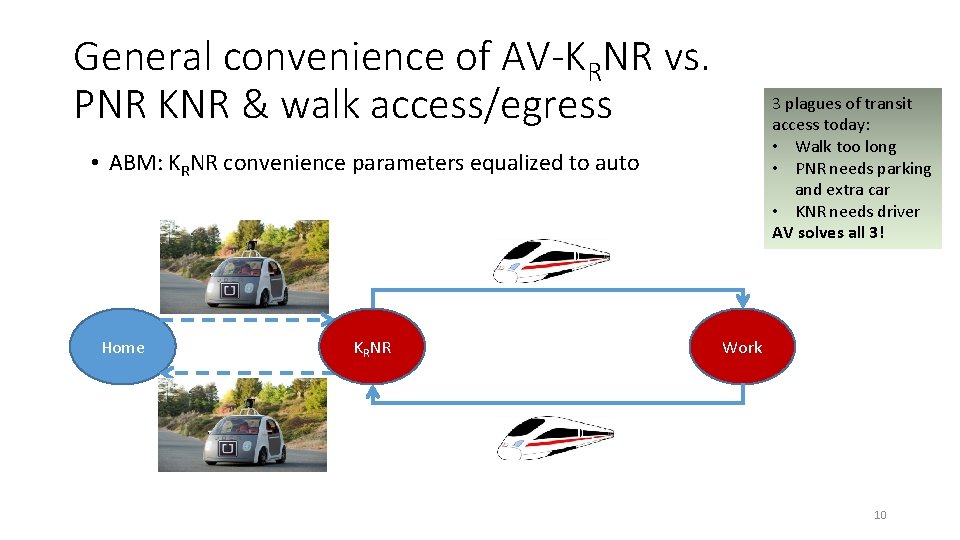
General convenience of AV-KRNR vs. PNR KNR & walk access/egress 3 plagues of transit access today: • Walk too long • PNR needs parking and extra car • KNR needs driver AV solves all 3! • ABM: KRNR convenience parameters equalized to auto Home KRNR Work 10
Impacts of AV on travel demand (Summary) 11
car. Track New sub-model that predicts intra-household car allocation and use (routing and parking details) 12
HH car allocation and tracking (car. Track) • What is does: • Allocated HH cars to trips taking into account time-space constraints • Reports car trips that cannot be served by HH cars (feedback to mode choice) • Generates complete daily car routes including: • AV repositioning (ZOVs) for traffic assignment • Parking choices for AVs • Graphical output to analyze individual HH (time-space car-tracking diagram) • Discrete LP: • Assumes HH schedule, trips, and modes are given but allows for schedule relaxations (and consequently extra “wait” or “early departure”) • Optimizes HH objective function that combines weighted components: • • • Penalty for schedule adjustment Usual driver for each car Cost for unsatisfied car demand (assumes taxi/Uber used for the trip) Car repositioning cost Car parking cost 13
HH car allocation conflict • Occurs when number of car driver trips in the same time interval exceeds number of cars: • Mode choice does not have a “hard” constraint, only a “soft” probabilistic one • Ways to resolve: • Adjust /relax/stretch individual activity schedules: • Especially effective with AV repositioning • Rescheduling feasibility and penalties compared to cost of unsatisfied demand • Generic Maa. S service available (Uber, etc) for unsatisfied auto demand: • Part of mode choice • Not fully processed for traffic assignment since there is no yet routing for them • Feedback to: • Car ownership • Mode choice • Joint travel arrangements 14
AV parking trade-off with empty trips • Regular vehicle: • Parked at the trip destination for activity duration (or tour duration for PNR) • Taken from parking by the same driver • Drivers can switch only at home • AV: • Has multiple parking options for location, duration and switching of drivers by means of vehicle repositioning (ZOVs) 15
AV parking and repositioning options 16
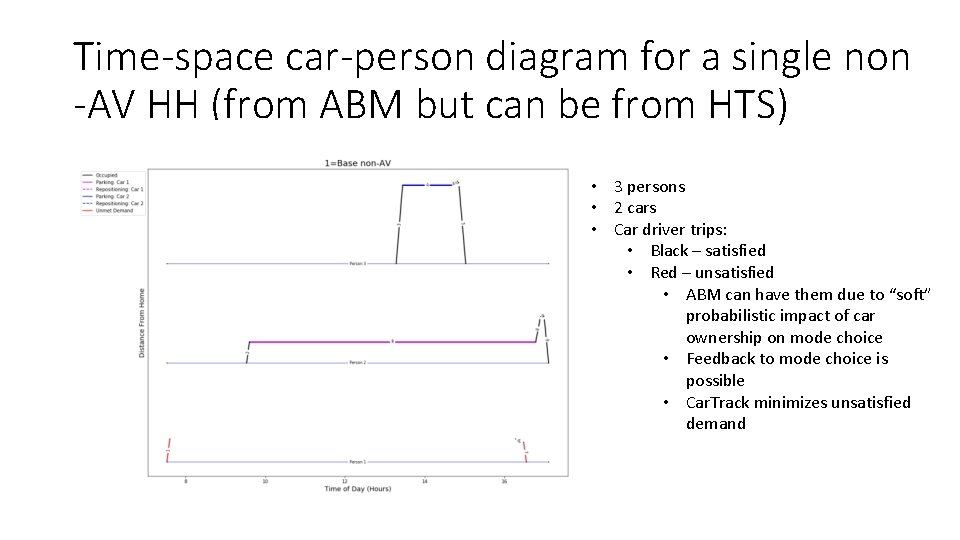
Time-space car-person diagram for a single non -AV HH (from ABM but can be from HTS) • 3 persons • 2 cars • Car driver trips: • Black – satisfied • Red – unsatisfied • ABM can have them due to “soft” probabilistic impact of car ownership on mode choice • Feedback to mode choice is possible • Car. Track minimizes unsatisfied demand
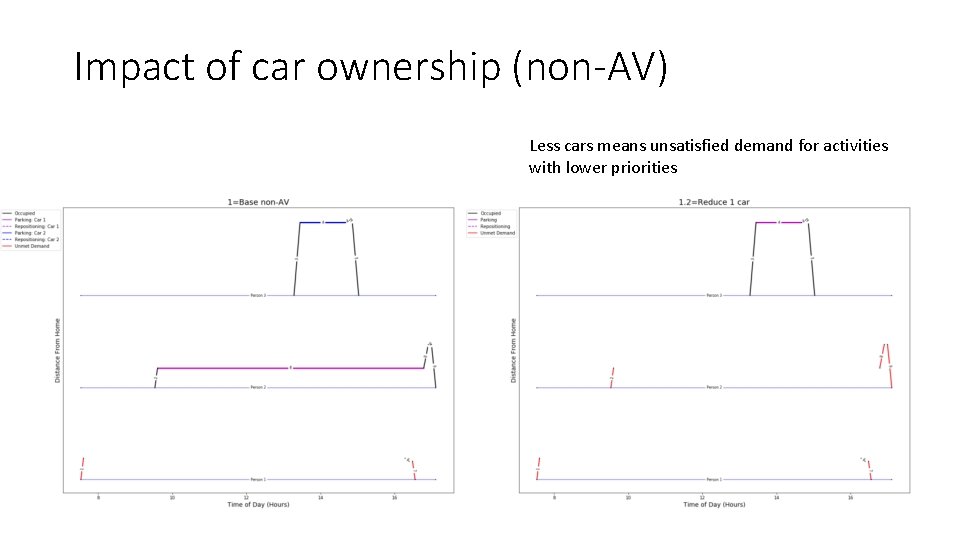
Impact of car ownership (non-AV) Less cars means unsatisfied demand for activities with lower priorities
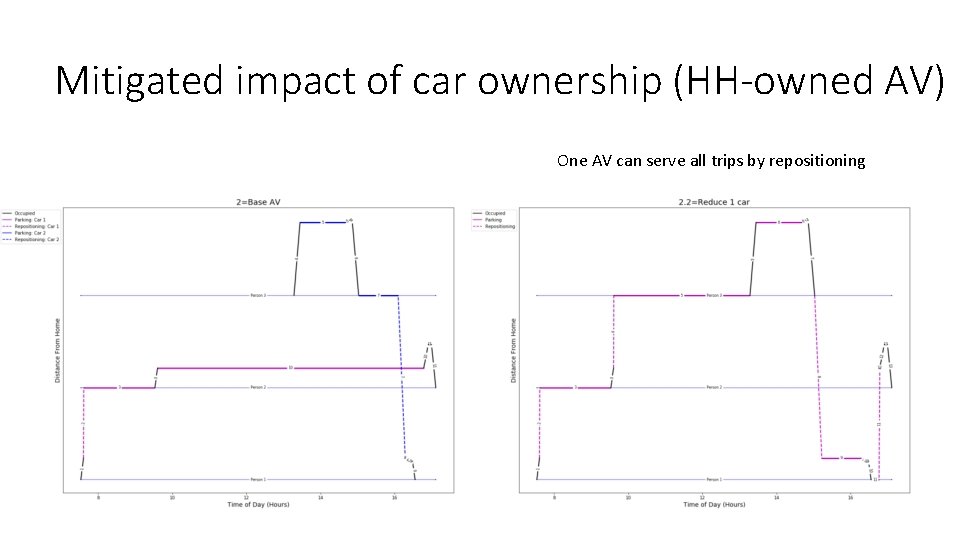
Mitigated impact of car ownership (HH-owned AV) One AV can serve all trips by repositioning
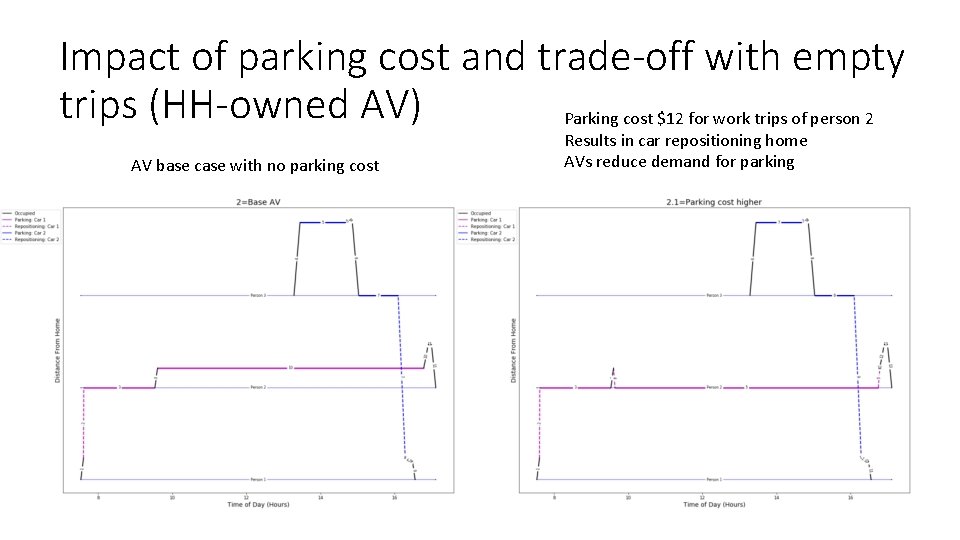
Impact of parking cost and trade-off with empty trips (HH-owned AV) Parking cost $12 for work trips of person 2 AV base case with no parking cost Results in car repositioning home AVs reduce demand for parking
Adjustments of network capacity and speed for AVs How to adjust network capacities an speeds for different AV penetration rates 21
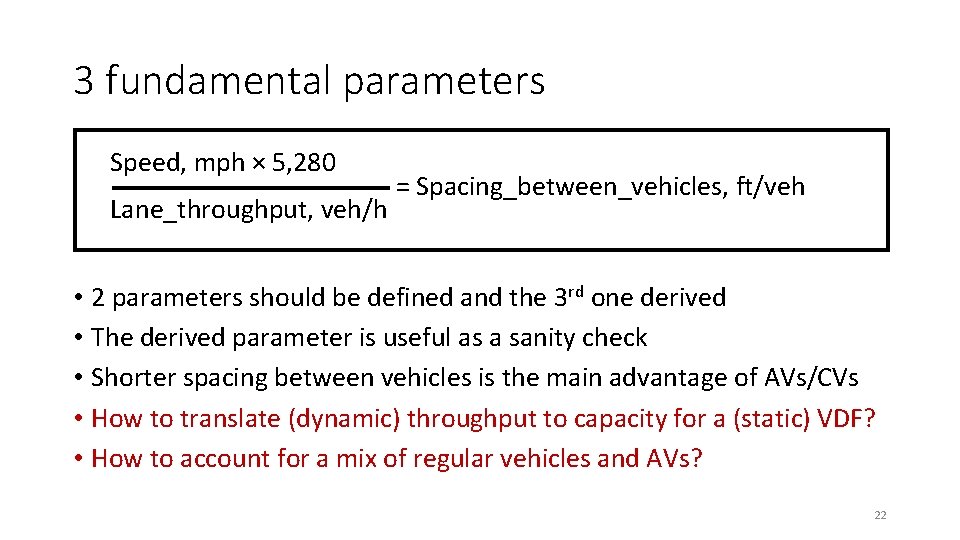
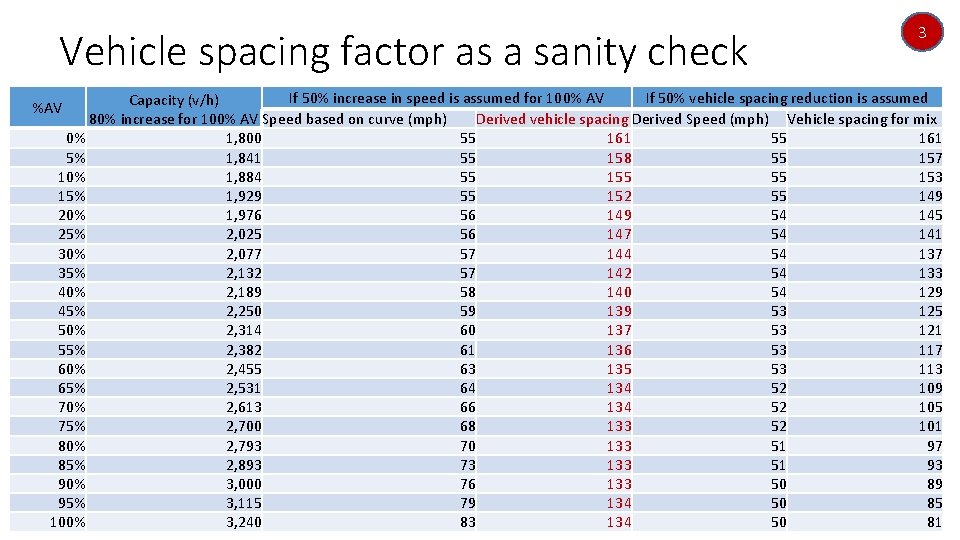
3 fundamental parameters Speed, mph × 5, 280 Lane_throughput, veh/h = Spacing_between_vehicles, ft/veh • 2 parameters should be defined and the 3 rd one derived • The derived parameter is useful as a sanity check • Shorter spacing between vehicles is the main advantage of AVs/CVs • How to translate (dynamic) throughput to capacity for a (static) VDF? • How to account for a mix of regular vehicles and AVs? 22
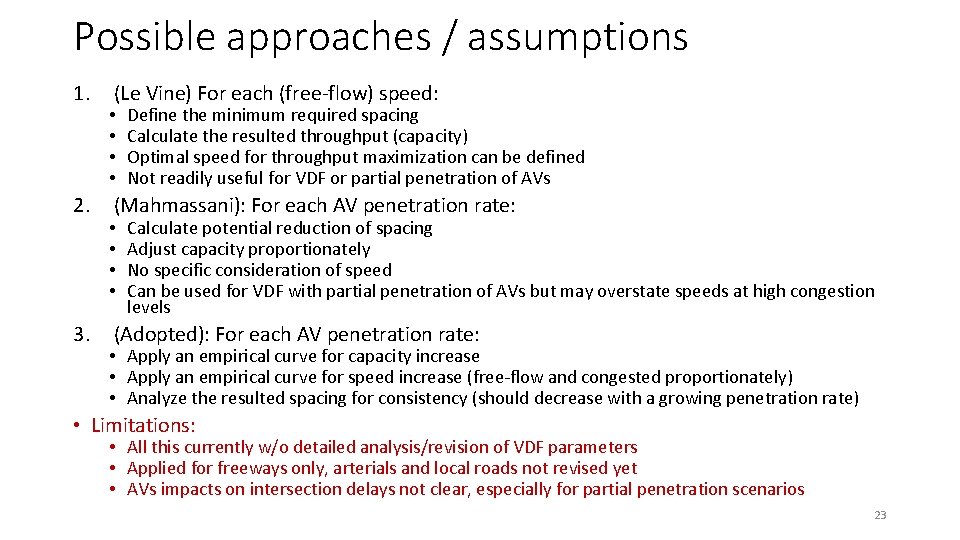
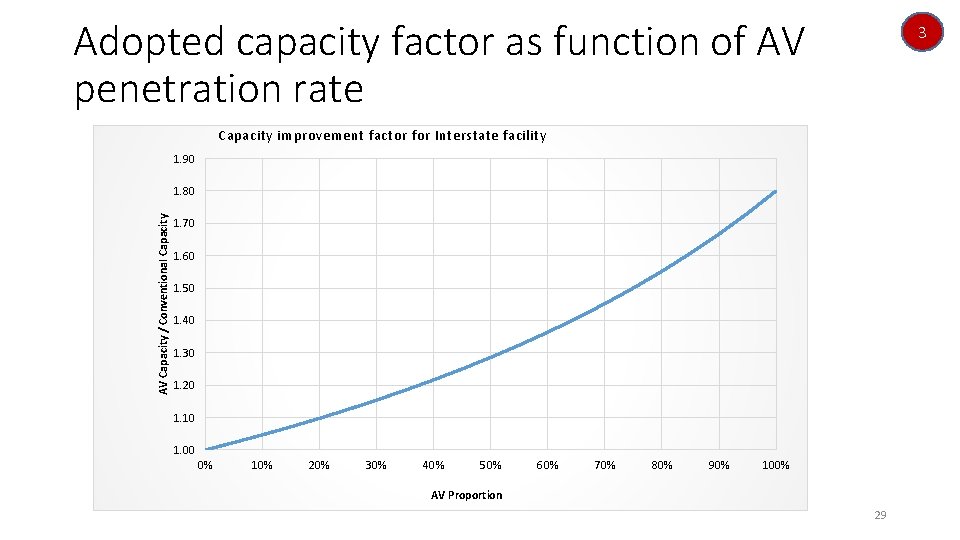
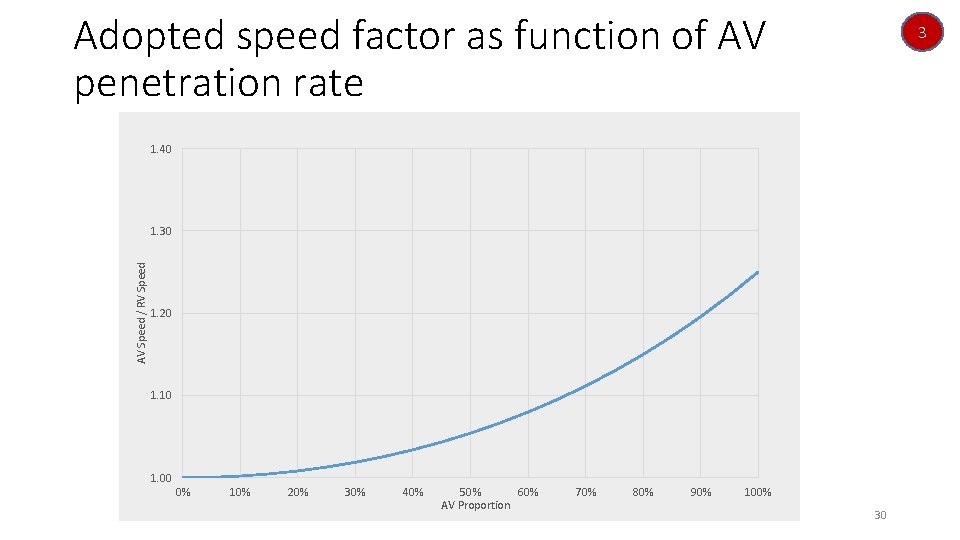
Possible approaches / assumptions 1. 2. 3. (Le Vine) For each (free-flow) speed: • • Define the minimum required spacing Calculate the resulted throughput (capacity) Optimal speed for throughput maximization can be defined Not readily useful for VDF or partial penetration of AVs (Mahmassani): For each AV penetration rate: • • Calculate potential reduction of spacing Adjust capacity proportionately No specific consideration of speed Can be used for VDF with partial penetration of AVs but may overstate speeds at high congestion levels (Adopted): For each AV penetration rate: • Apply an empirical curve for capacity increase • Apply an empirical curve for speed increase (free-flow and congested proportionately) • Analyze the resulted spacing for consistency (should decrease with a growing penetration rate) • Limitations: • All this currently w/o detailed analysis/revision of VDF parameters • Applied for freeways only, arterials and local roads not revised yet • AVs impacts on intersection delays not clear, especially for partial penetration scenarios 23
1 Le Vine et al, 2017 Scenarios based on assumptions on upper limit of vehicle deceleration and reaction time 24
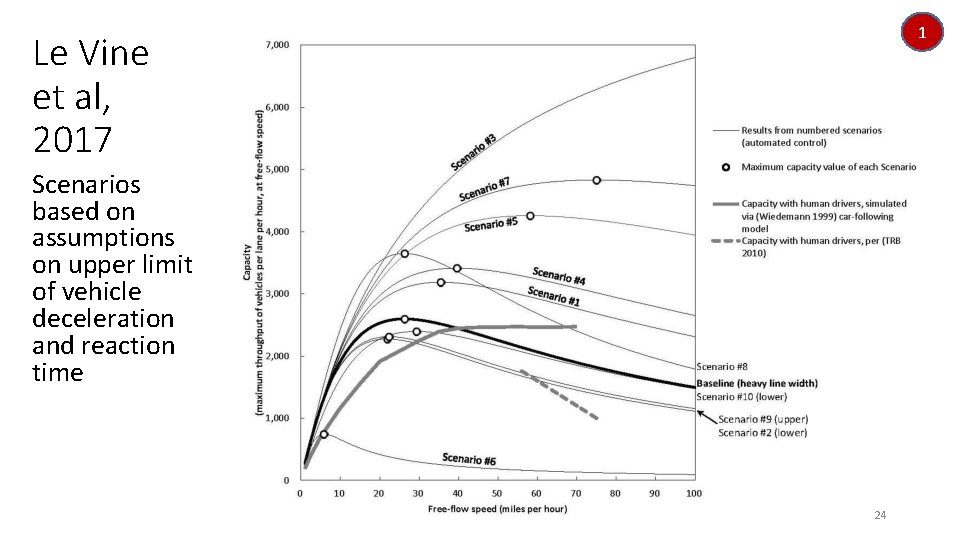
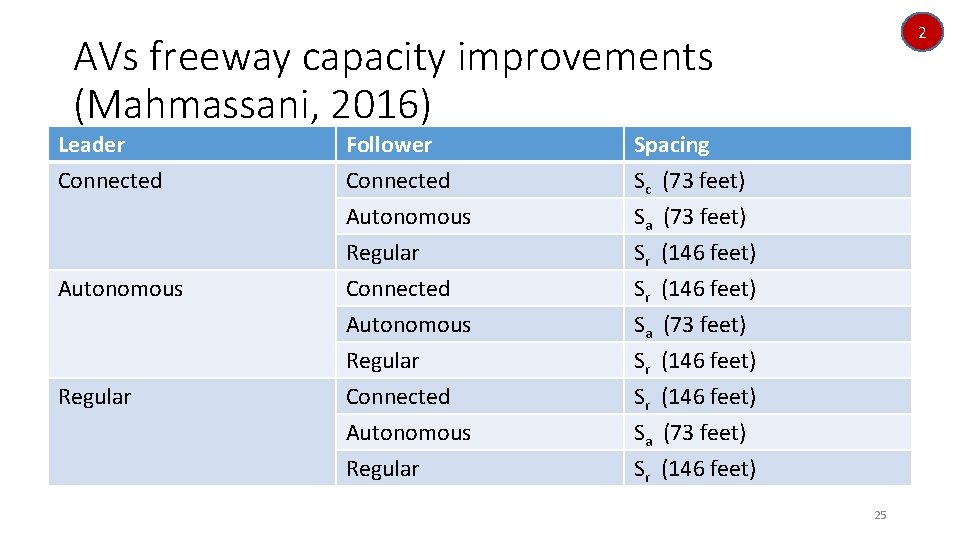
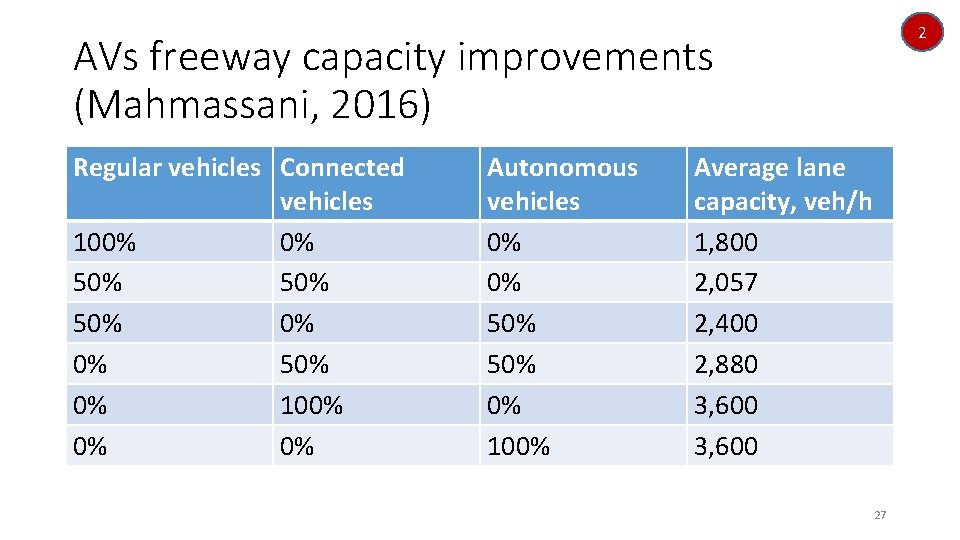
2 AVs freeway capacity improvements (Mahmassani, 2016) Leader Connected Follower Connected Autonomous Regular Spacing Sc (73 feet) Sa (73 feet) Sr (146 feet) Autonomous Connected Autonomous Regular Sr (146 feet) Sa (73 feet) Sr (146 feet) Regular 25
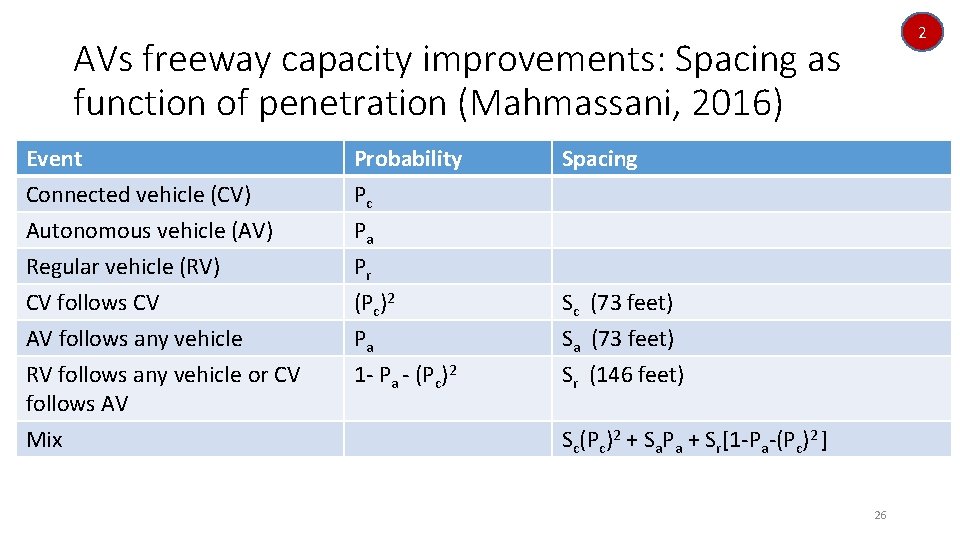
2 AVs freeway capacity improvements: Spacing as function of penetration (Mahmassani, 2016) Event Connected vehicle (CV) Autonomous vehicle (AV) Regular vehicle (RV) CV follows CV AV follows any vehicle RV follows any vehicle or CV follows AV Mix Probability Pc Pa P r (Pc)2 Pa 1 - Pa - (Pc)2 Spacing Sc (73 feet) Sa (73 feet) Sr (146 feet) Sc(Pc)2 + Sa. Pa + Sr[1 -Pa-(Pc)2 ] 26
2 AVs freeway capacity improvements (Mahmassani, 2016) Regular vehicles Connected vehicles 100% 0% 50% 50% 0% 100% 0% 0% Autonomous vehicles 0% 0% 50% 0% 100% Average lane capacity, veh/h 1, 800 2, 057 2, 400 2, 880 3, 600 27
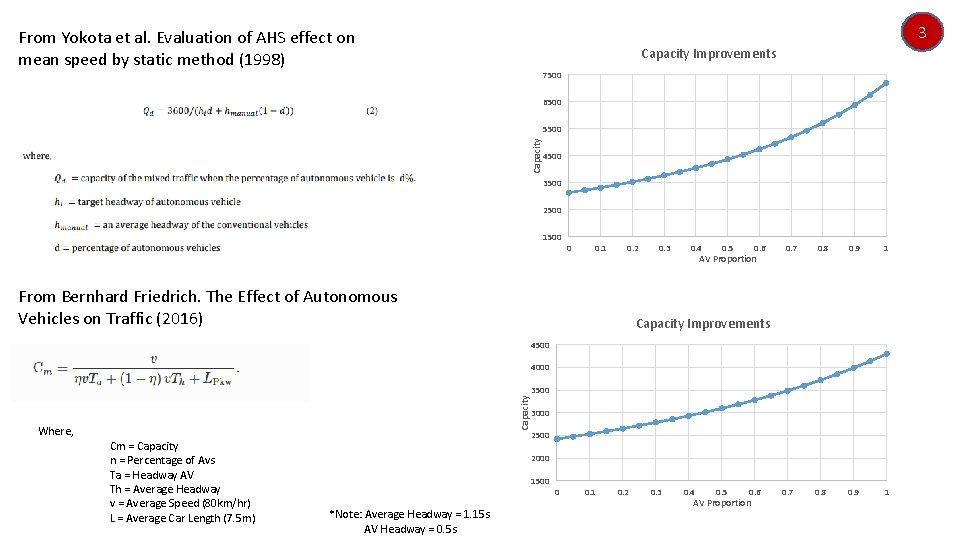
3 From Yokota et al. Evaluation of AHS effect on mean speed by static method (1998) Capacity Improvements 7500 6500 Capacity 5500 4500 3500 2500 1500 0 0. 1 0. 2 From Bernhard Friedrich. The Effect of Autonomous Vehicles on Traffic (2016) 0. 3 0. 4 0. 5 0. 6 AV Proportion 0. 7 0. 8 0. 9 1 Capacity Improvements 4500 4000 Capacity 3500 3000 Where, Cm = Capacity n = Percentage of Avs Ta = Headway AV Th = Average Headway v = Average Speed (80 km/hr) L = Average Car Length (7. 5 m) 2500 2000 1500 *Note: Average Headway = 1. 15 s AV Headway = 0. 5 s 0 0. 1 0. 2 0. 3 0. 4 0. 5 0. 6 AV Proportion 0. 7
Adopted capacity factor as function of AV penetration rate 3 Capacity improvement factor for Interstate facility 1. 90 AV Capacity / Conventional Capacity 1. 80 1. 70 1. 60 1. 50 1. 40 1. 30 1. 20 1. 10 1. 00 0% 10% 20% 30% 40% 50% 60% 70% 80% 90% 100% AV Proportion 29
Adopted speed factor as function of AV penetration rate 3 1. 40 AV Speed / RV Speed 1. 30 1. 20 1. 10 1. 00 0% 10% 20% 30% 40% 50% 60% AV Proportion 70% 80% 90% 100% 30
Vehicle spacing factor as a sanity check 3 If 50% increase in speed is assumed for 100% AV If 50% vehicle spacing reduction is assumed Capacity (v/h) Derived vehicle spacing Derived Speed (mph) Vehicle spacing for mix 80% increase for 100% AV Speed based on curve (mph) 0% 1, 800 55 161 5% 1, 841 55 158 55 157 10% 1, 884 55 155 55 153 15% 1, 929 55 152 55 149 20% 1, 976 56 149 54 145 25% 2, 025 56 147 54 141 30% 2, 077 57 144 54 137 35% 2, 132 57 142 54 133 40% 2, 189 58 140 54 129 45% 2, 250 59 139 53 125 50% 2, 314 60 137 53 121 55% 2, 382 61 136 53 117 60% 2, 455 63 135 53 113 65% 2, 531 64 134 52 109 70% 2, 613 66 134 52 105 75% 2, 700 68 133 52 101 80% 2, 793 70 133 51 97 85% 2, 893 73 133 51 93 90% 3, 000 76 133 50 89 95% 3, 115 79 134 50 85 31 100% 3, 240 83 134 50 81 %AV
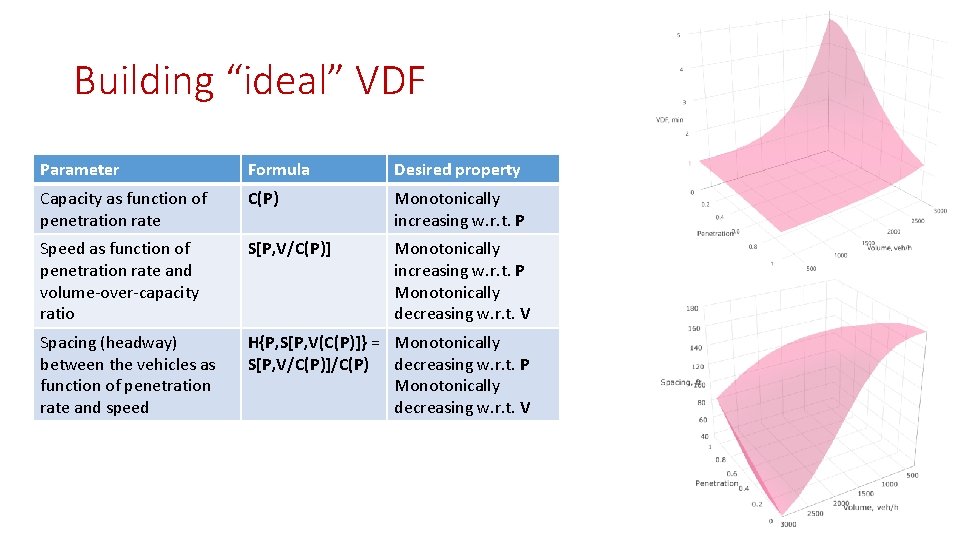
Building “ideal” VDF Parameter Formula Desired property Capacity as function of penetration rate C(P) Monotonically increasing w. r. t. P Speed as function of penetration rate and volume-over-capacity ratio S[P, V/C(P)] Monotonically increasing w. r. t. P Monotonically decreasing w. r. t. V Spacing (headway) between the vehicles as function of penetration rate and speed H{P, S[P, V(C(P)]} = Monotonically S[P, V/C(P)]/C(P) decreasing w. r. t. P Monotonically decreasing w. r. t. V 32
AV scenario controls Switches to toggle to manage scenarios 33
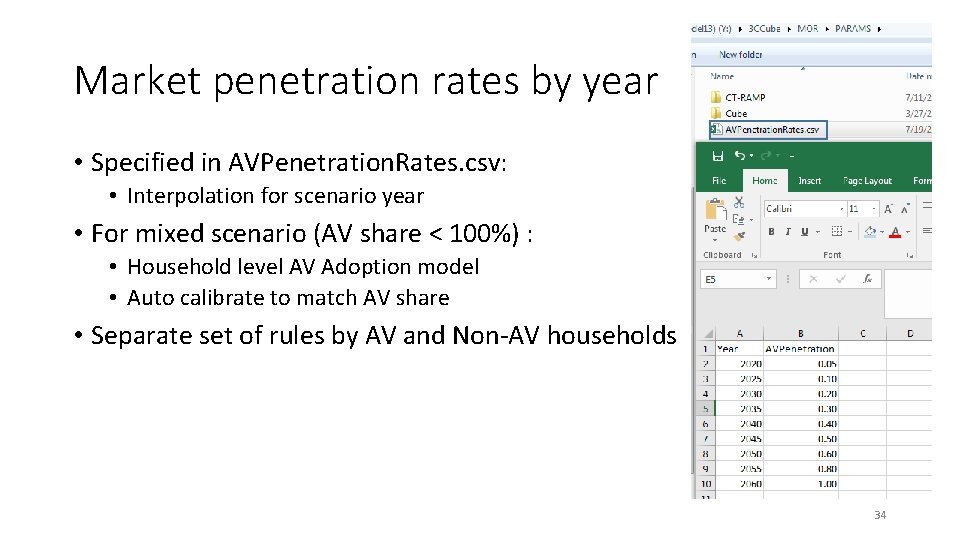
Market penetration rates by year • Specified in AVPenetration. Rates. csv: • Interpolation for scenario year • For mixed scenario (AV share < 100%) : • Household level AV Adoption model • Auto calibrate to match AV share • Separate set of rules by AV and Non-AV households 34
Other scenario controls • Specified in PARAMETERS. TXT file 35
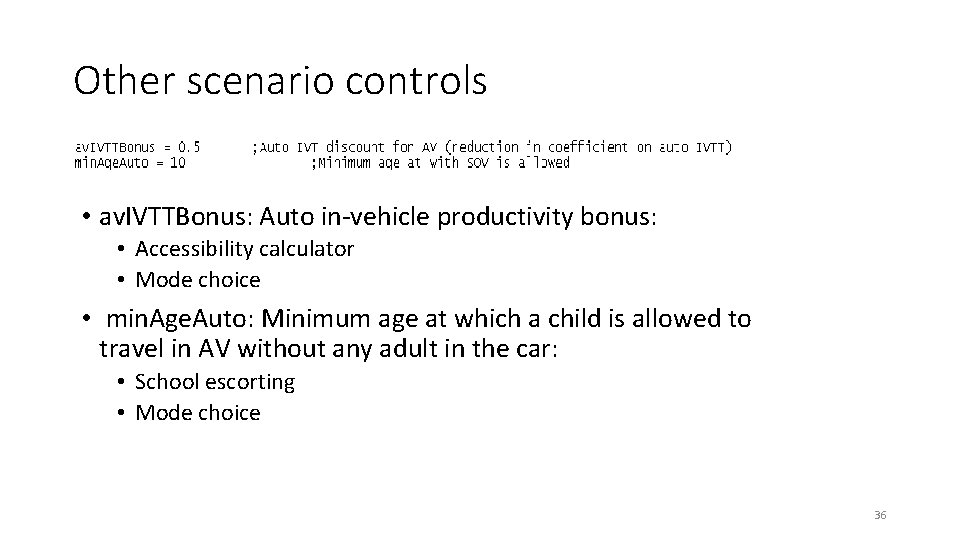
Other scenario controls • av. IVTTBonus: Auto in-vehicle productivity bonus: • Accessibility calculator • Mode choice • min. Age. Auto: Minimum age at which a child is allowed to travel in AV without any adult in the car: • School escorting • Mode choice 36
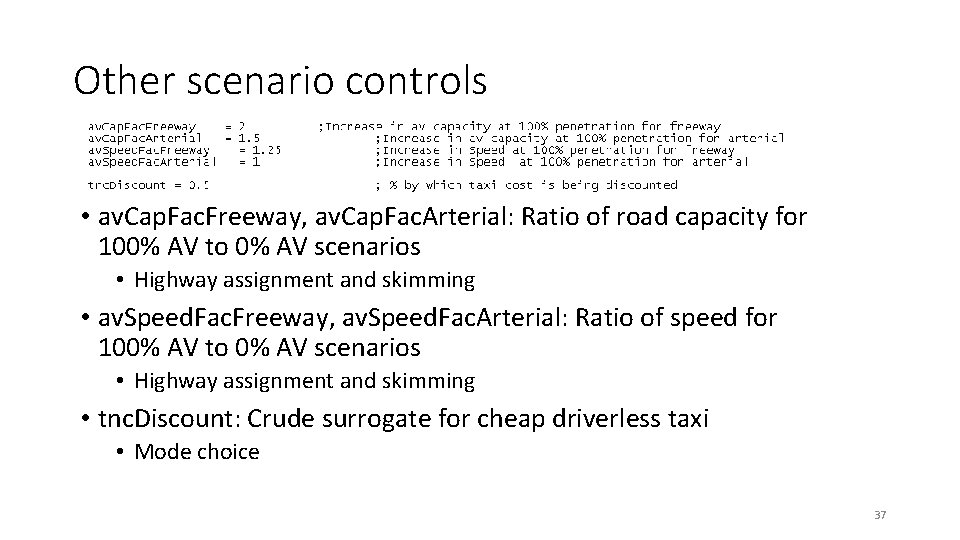
Other scenario controls • av. Cap. Fac. Freeway, av. Cap. Fac. Arterial: Ratio of road capacity for 100% AV to 0% AV scenarios • Highway assignment and skimming • av. Speed. Fac. Freeway, av. Speed. Fac. Arterial: Ratio of speed for 100% AV to 0% AV scenarios • Highway assignment and skimming • tnc. Discount: Crude surrogate for cheap driverless taxi • Mode choice 37
Other AV Parameters • KRNR bonus: Constant to nullify the inconvenience of KNR • “No escort” bonus: Constant to cancel out the effect of constants for escorting • Not scenario specific 38
Results for modeled scenarios Summary of first results 39
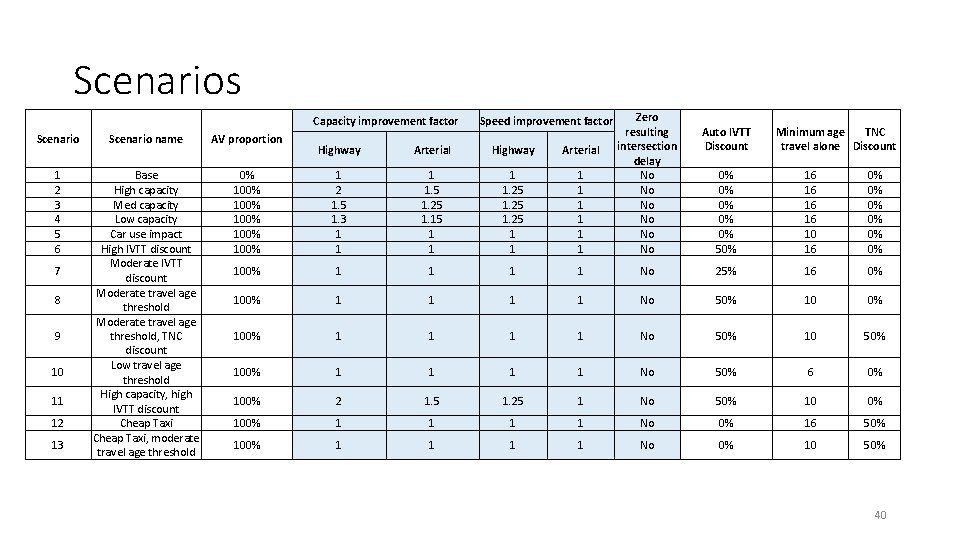
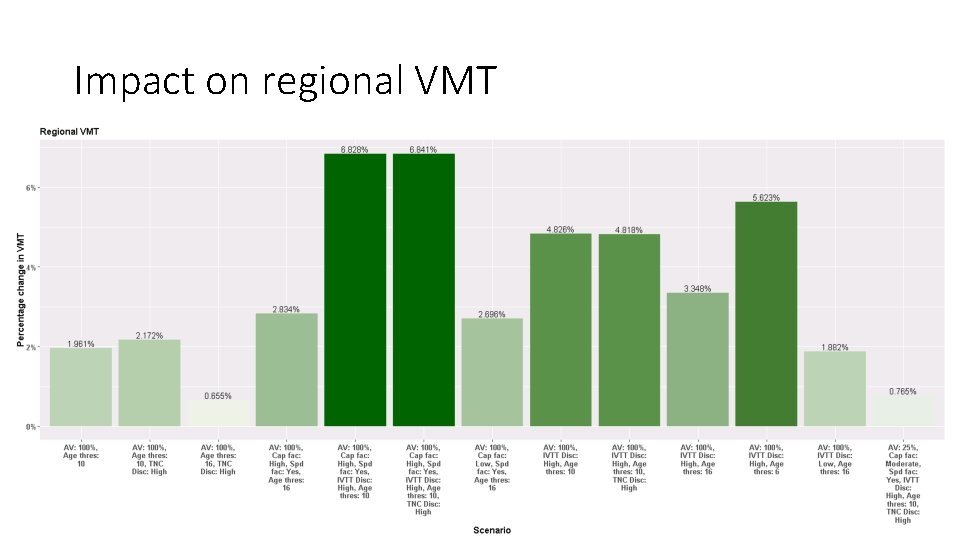
Scenarios Highway Arterial 0% 100% 100% 1 2 1. 5 1. 3 1 1. 5 1. 25 1. 15 1 1. 25 1 1 1 1 Zero resulting intersection delay No No No 100% 1 1 100% Capacity improvement factor Scenario name AV proportion 1 2 3 4 5 6 Base High capacity Med capacity Low capacity Car use impact High IVTT discount Moderate travel age threshold, TNC discount Low travel age threshold High capacity, high IVTT discount Cheap Taxi, moderate travel age threshold 7 8 9 10 11 12 13 Speed improvement factor Auto IVTT Discount Minimum age TNC travel alone Discount 0% 0% 0% 50% 16 16 10 16 0% 0% 0% No 25% 16 0% 1 No 50% 10 0% 1 1 No 50% 10 50% 1 1 1 No 50% 6 0% 2 1. 5 1. 25 1 No 50% 100% 1 1 No 0% 16 50% 100% 1 1 No 0% 10 50% 40
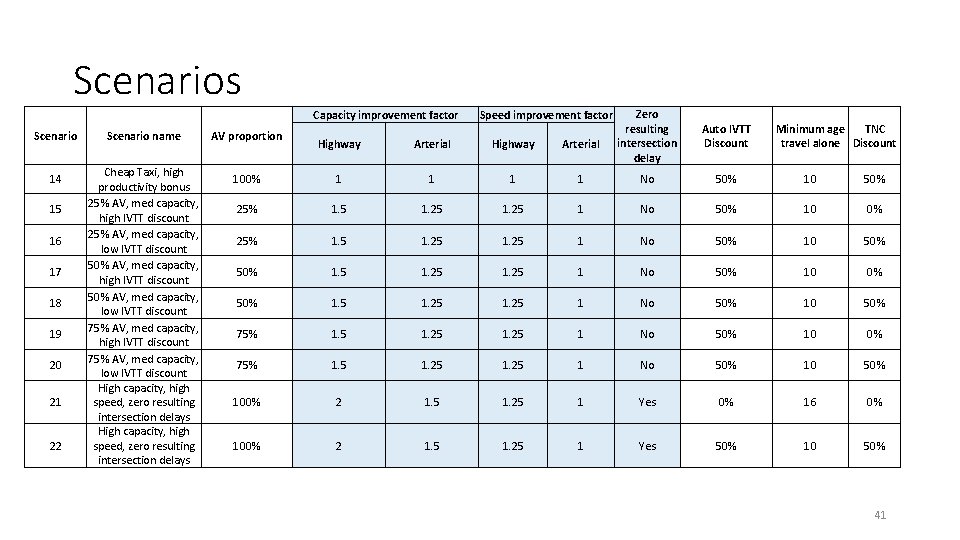
Scenarios Capacity improvement factor Scenario 14 15 16 17 18 19 20 21 22 Scenario name Cheap Taxi, high productivity bonus 25% AV, med capacity, high IVTT discount 25% AV, med capacity, low IVTT discount 50% AV, med capacity, high IVTT discount 50% AV, med capacity, low IVTT discount 75% AV, med capacity, high IVTT discount 75% AV, med capacity, low IVTT discount High capacity, high speed, zero resulting intersection delays AV proportion Speed improvement factor Zero resulting intersection delay Auto IVTT Discount Minimum age TNC travel alone Discount Highway Arterial 100% 1 1 No 50% 10 50% 25% 1. 5 1. 25 1 No 50% 10 50% 1. 5 1. 25 1 No 50% 10 0% 50% 1. 5 1. 25 1 No 50% 10 50% 75% 1. 5 1. 25 1 No 50% 100% 2 1. 5 1. 25 1 Yes 0% 16 0% 100% 2 1. 5 1. 25 1 Yes 50% 10 50% 41
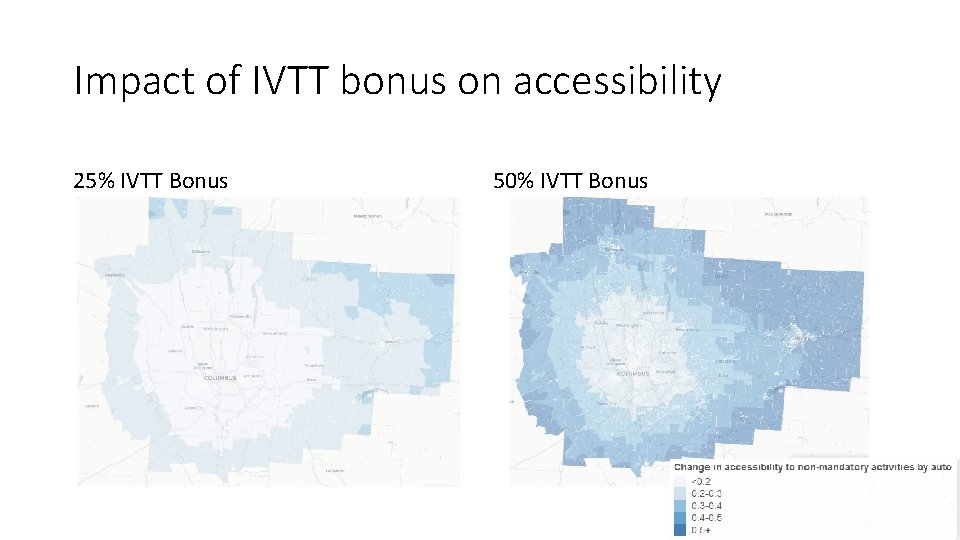
Impact of IVTT bonus on accessibility 25% IVTT Bonus 50% IVTT Bonus 42
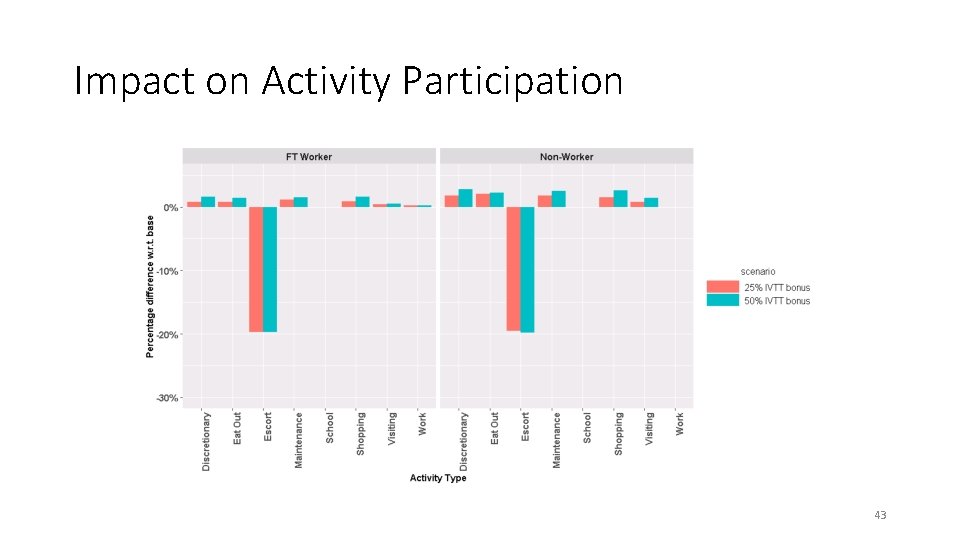
Impact on Activity Participation 43
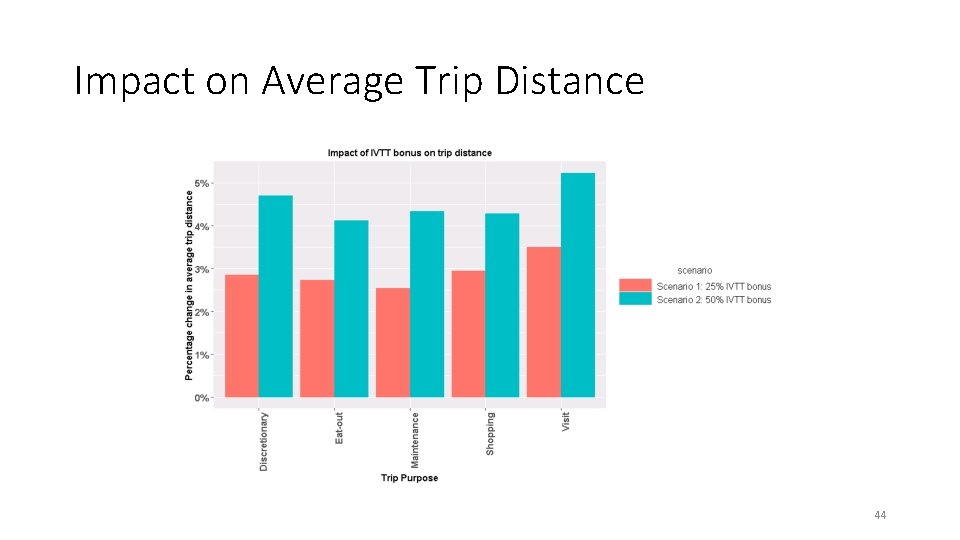
Impact on Average Trip Distance 44
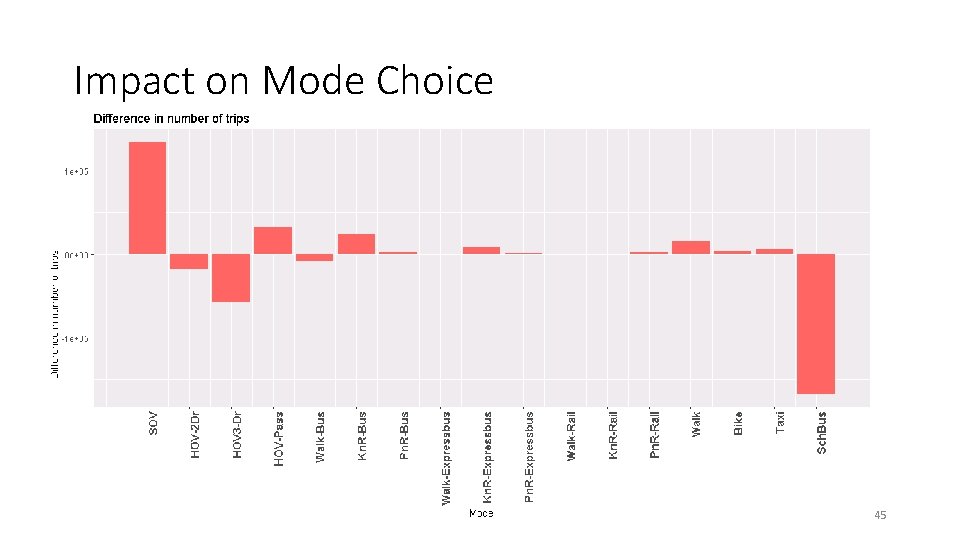
Impact on Mode Choice 45
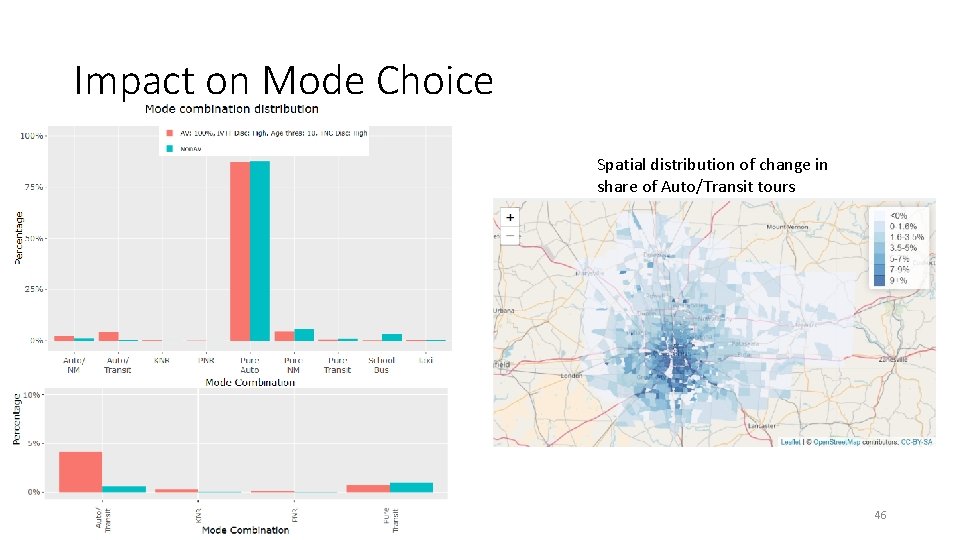
Impact on Mode Choice Spatial distribution of change in share of Auto/Transit tours 46
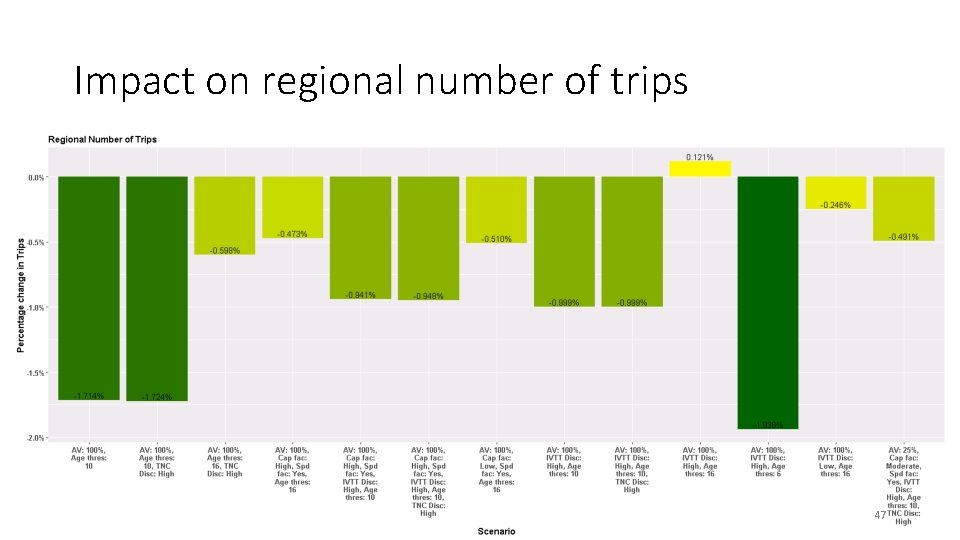
Impact on regional number of trips 47
Impact on regional VMT 48
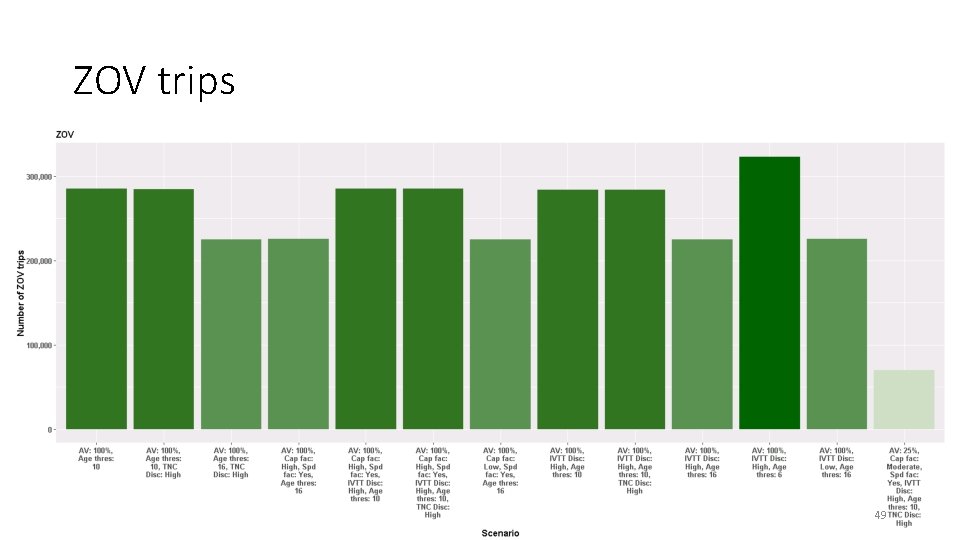
ZOV trips 49
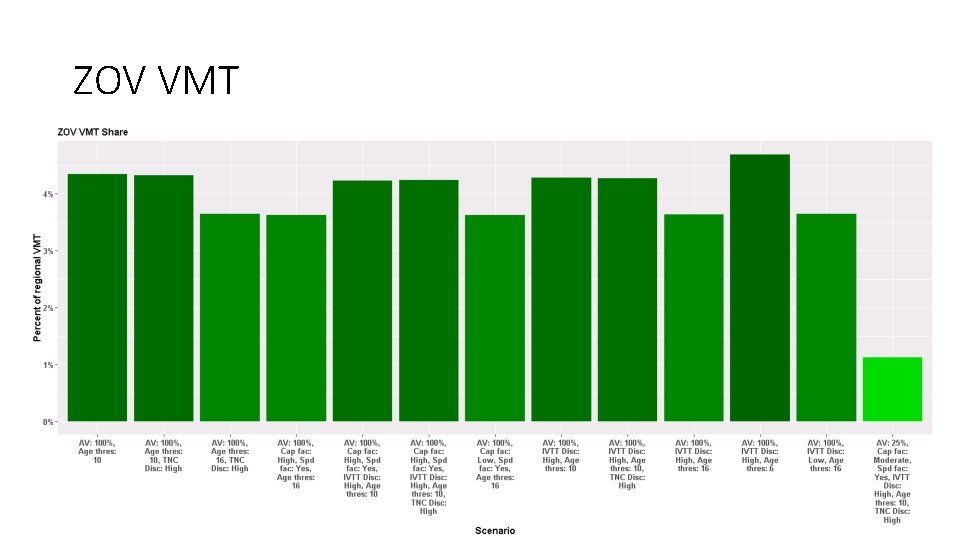
ZOV VMT 50
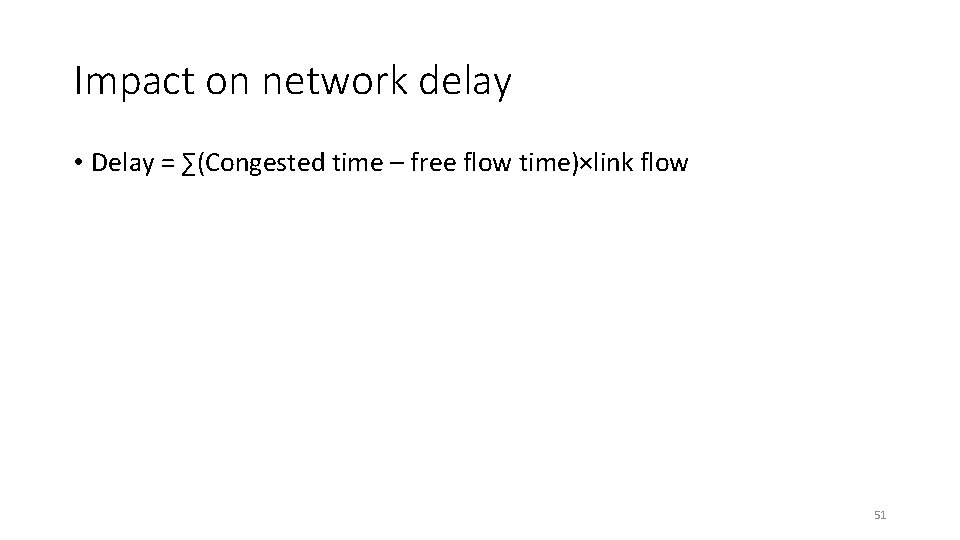
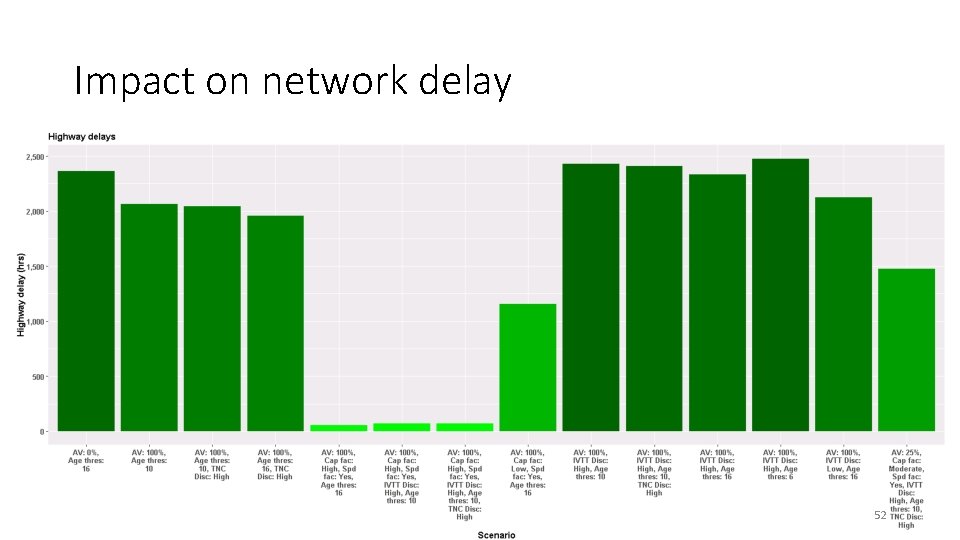
Impact on network delay • Delay = ∑(Congested time – free flow time)×link flow 51
Impact on network delay 52
Next steps Possible further improvements 53
General directions for model improvements that relate to AVs • Moving towards Ag. BM: • Identify additional model components to replace or complement probabilistic models with Agent-Based simulation to allow more enforcement of absolute time-space constraints on locations of people/vehicles • Integration with advanced network models: • ABM-DTA integration and eventually a complete Ag. BM • AV simulation in DTA instead of tweaking capacity/speed/VDF • Substitution between in-home and out-of-home activities: • E-shopping/delivery substitution for shopping trips 54
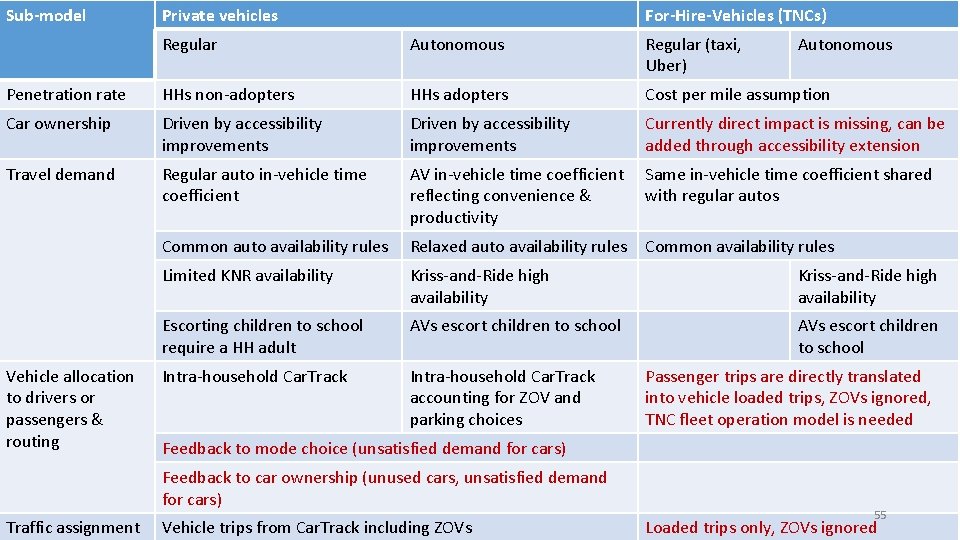
Sub-model Private vehicles For-Hire-Vehicles (TNCs) Regular Autonomous Regular (taxi, Uber) Penetration rate HHs non-adopters HHs adopters Cost per mile assumption Car ownership Driven by accessibility improvements Currently direct impact is missing, can be added through accessibility extension Travel demand Regular auto in-vehicle time coefficient AV in-vehicle time coefficient Same in-vehicle time coefficient shared reflecting convenience & with regular autos productivity Common auto availability rules Relaxed auto availability rules Limited KNR availability Kriss-and-Ride high availability Escorting children to school require a HH adult AVs escort children to school Intra-household Car. Track accounting for ZOV and parking choices Vehicle allocation to drivers or passengers & routing Common availability rules Passenger trips are directly translated into vehicle loaded trips, ZOVs ignored, TNC fleet operation model is needed Feedback to mode choice (unsatisfied demand for cars) Feedback to car ownership (unused cars, unsatisfied demand for cars) Traffic assignment Autonomous Vehicle trips from Car. Track including ZOVs 55 Loaded trips only, ZOVs ignored
Loose ends and short-term improvements • Auto ownership model: • Currently not affected by AVs directly • For owned AVs: • (“Unused cars”) Potential for a decrease in the private auto ownership due to the ease in sharing vehicles among household members • (“Unsatisfied demand”) Potential for growth due to the replacement of escorting and overall AV attractiveness • For shared AVs: • (“Unused cars”) Potential for a decrease in the private auto ownership due to the ease in sharing vehicles among household members • Consistent owned car availability and parking consideration in mode choice and car. Track: • Currently two standalone components that are applied sequentially • More lines for the model system equilibration: • Inform mode choice that car is not available for a certain trip • Inform mode choice that parking cost can be avoided by repositioning 56
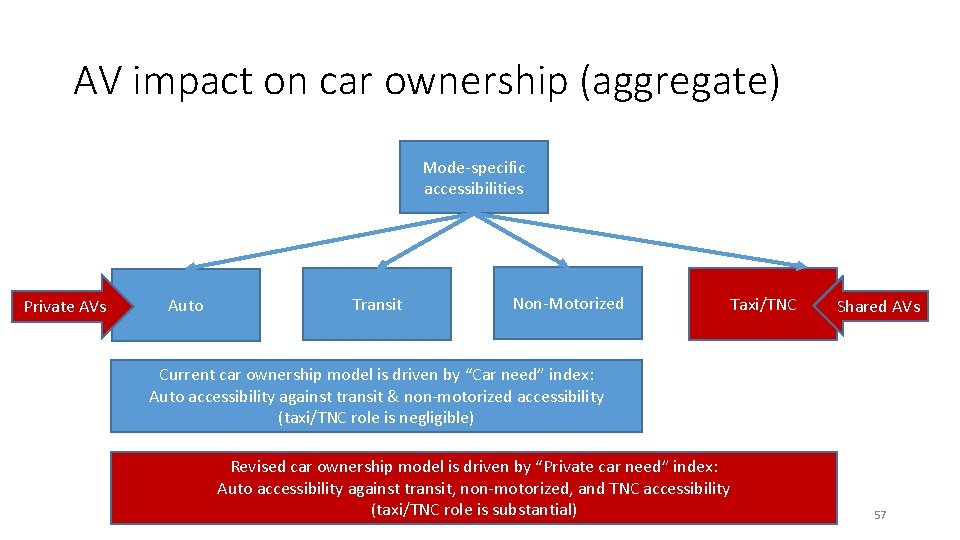
AV impact on car ownership (aggregate) Mode-specific accessibilities Private AVs Auto Transit Non-Motorized Taxi/TNC Shared AVs Current car ownership model is driven by “Car need” index: Auto accessibility against transit & non-motorized accessibility (taxi/TNC role is negligible) Revised car ownership model is driven by “Private car need” index: Auto accessibility against transit, non-motorized, and TNC accessibility (taxi/TNC role is substantial) 57
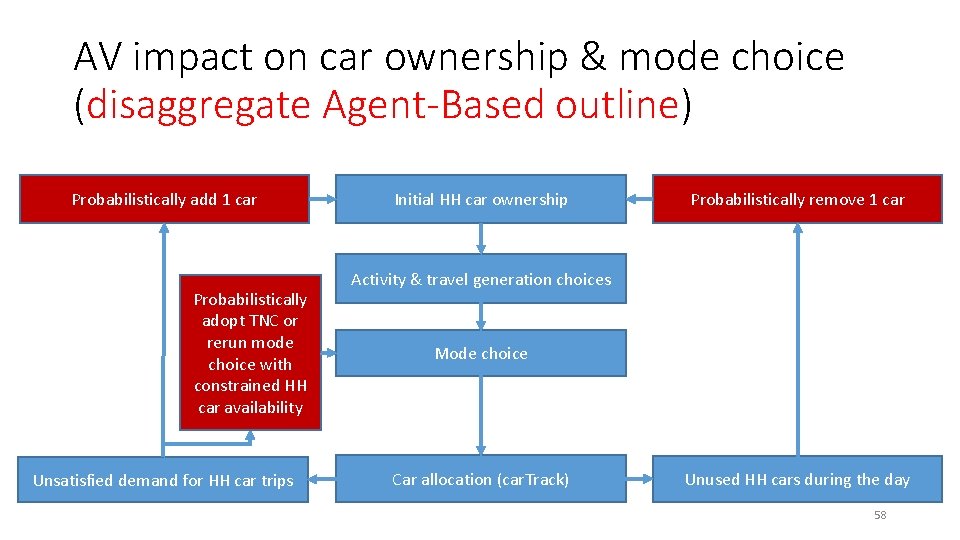
AV impact on car ownership & mode choice (disaggregate Agent-Based outline) Probabilistically add 1 car Probabilistically adopt TNC or rerun mode choice with constrained HH car availability Unsatisfied demand for HH car trips Initial HH car ownership Probabilistically remove 1 car Activity & travel generation choices Mode choice Car allocation (car. Track) Unused HH cars during the day 58
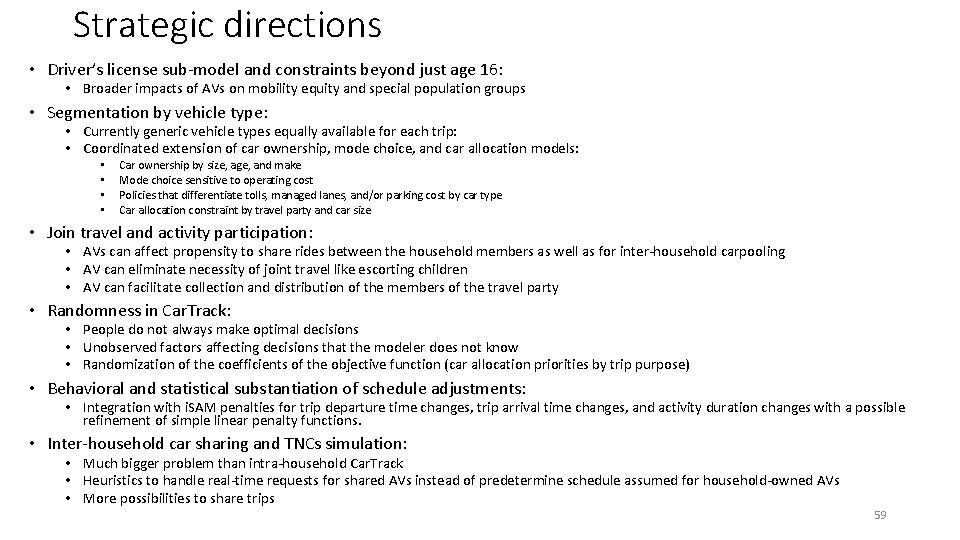
Strategic directions • Driver’s license sub-model and constraints beyond just age 16: • Broader impacts of AVs on mobility equity and special population groups • Segmentation by vehicle type: • Currently generic vehicle types equally available for each trip: • Coordinated extension of car ownership, mode choice, and car allocation models: • • Car ownership by size, age, and make Mode choice sensitive to operating cost Policies that differentiate tolls, managed lanes, and/or parking cost by car type Car allocation constraint by travel party and car size • Join travel and activity participation: • AVs can affect propensity to share rides between the household members as well as for inter-household carpooling • AV can eliminate necessity of joint travel like escorting children • AV can facilitate collection and distribution of the members of the travel party • Randomness in Car. Track: • People do not always make optimal decisions • Unobserved factors affecting decisions that the modeler does not know • Randomization of the coefficients of the objective function (car allocation priorities by trip purpose) • Behavioral and statistical substantiation of schedule adjustments: • Integration with i. SAM penalties for trip departure time changes, trip arrival time changes, and activity duration changes with a possible refinement of simple linear penalty functions. • Inter-household car sharing and TNCs simulation: • Much bigger problem than intra-household Car. Track • Heuristics to handle real-time requests for shared AVs instead of predetermine schedule assumed for household-owned AVs • More possibilities to share trips 59
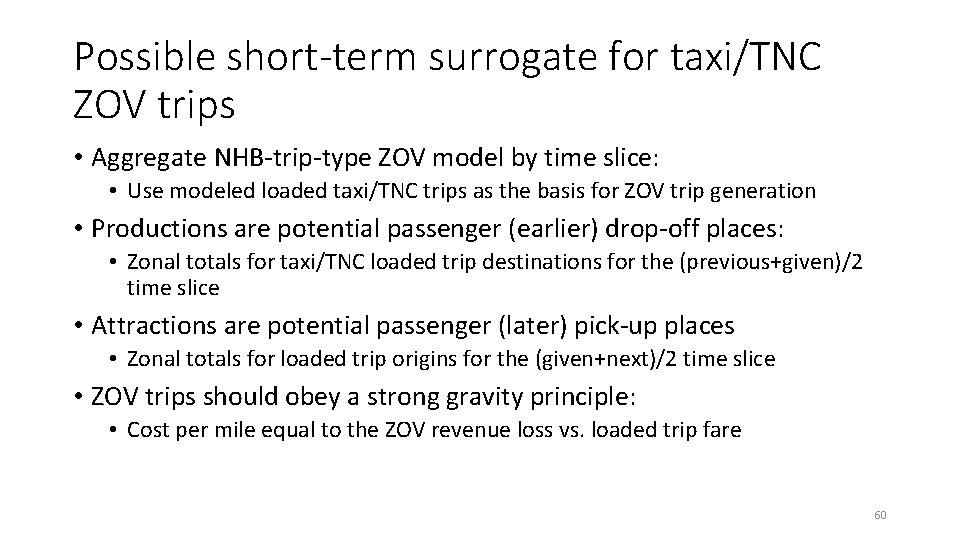
Possible short-term surrogate for taxi/TNC ZOV trips • Aggregate NHB-trip-type ZOV model by time slice: • Use modeled loaded taxi/TNC trips as the basis for ZOV trip generation • Productions are potential passenger (earlier) drop-off places: • Zonal totals for taxi/TNC loaded trip destinations for the (previous+given)/2 time slice • Attractions are potential passenger (later) pick-up places • Zonal totals for loaded trip origins for the (given+next)/2 time slice • ZOV trips should obey a strong gravity principle: • Cost per mile equal to the ZOV revenue loss vs. loaded trip fare 60
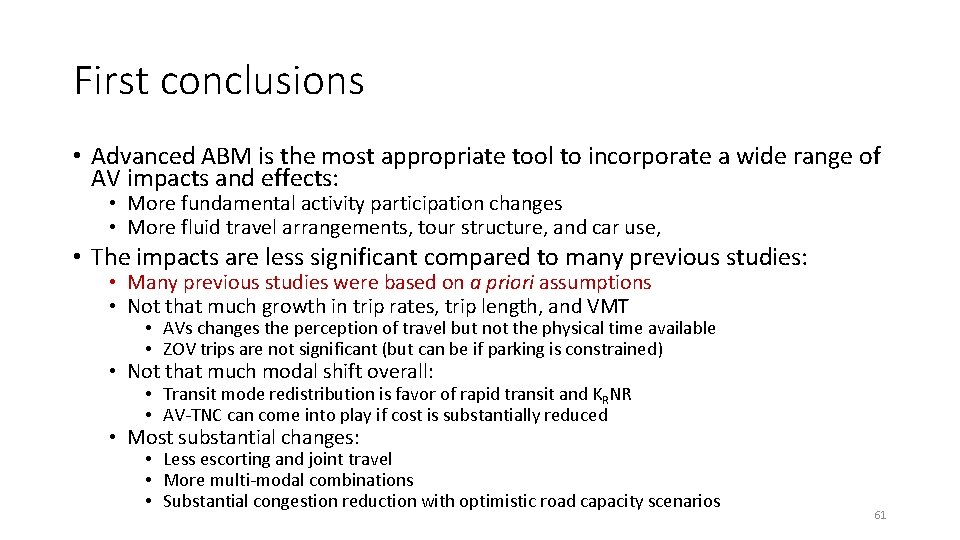
First conclusions • Advanced ABM is the most appropriate tool to incorporate a wide range of AV impacts and effects: • More fundamental activity participation changes • More fluid travel arrangements, tour structure, and car use, • The impacts are less significant compared to many previous studies: • Many previous studies were based on a priori assumptions • Not that much growth in trip rates, trip length, and VMT • AVs changes the perception of travel but not the physical time available • ZOV trips are not significant (but can be if parking is constrained) • Not that much modal shift overall: • Transit mode redistribution is favor of rapid transit and KRNR • AV-TNC can come into play if cost is substantially reduced • Most substantial changes: • Less escorting and joint travel • More multi-modal combinations • Substantial congestion reduction with optimistic road capacity scenarios 61