IES Summer Research Institute Singlecase Intervention Design and

 § Parameters Associated with")


 Consistency of separation across comparisons JABA")


- Slides: 46
IES Summer Research Institute: Single-case Intervention Design and Analysis Day 2: 2: 45 – 4: 30 Day 3: 8: 30 - 10: 00 Tom Kratochwill , Rob Horner, and John Ferron Visual Analysis of Single-case Intervention Data Acknowledgement: Chris Swoboda George Sugai Hariharan Swaminathan Dan Maggin
Goals § Overview of Visual Analysis of Single-case Data (TK) § Parameters Associated with Visual Analysis (RH) § Four steps in visual analysis § Six features considered in visual analysis § Additional considerations for MBL and ATD § Concerns about Visual Analysis (JF)
Evaluate the Design Meets Design Standards Meets with Reservations Does Not Meet Design Standards Evaluate the Evidence Strong Evidence Moderate Evidence Effect-Size Estimation Social Validity Assessment No Evidence
Evidence Standard § Strong § Baseline § Documentation of research question “problem” § Documentation of predictable pattern (>5 data points) § Each Phase of the Analysis § Documentation of predictable pattern (> 5 data points) § Basic effects § Documentation of predicted change in the DV when IV is manipulated § Experimental Control § Three demonstrations of basic effect, each at a different point in time. § No demonstrations of intervention failure
Evidence Standards § Moderate § All of “Strong” criteria, with these exceptions: § Only 3 -4 data points per phase § Three demonstrations of effect, but with additional demonstrations of failure-to-document effect. § Non-concurrent multiple baseline § No Evidence § Misnomer § Evidence does not meet Moderate level.
Visual Analysis of Single Case Designs § Baseline § Document the “problem” requiring intervention § Typically 5 or more data points § Documentation of a pattern of responding that allows prediction into the future. § Each Phase § Documents a clear pattern of responding § Typically 5 or more data points § Adjacent phases § Do data document a “basic effect” § Whole study § Do the phases document experimental control (e. g. at least three demonstrations of a basic effect, each at a different point in time.
Visual Analysis within Single-case design § Documenting Experimental Control § Three demonstrations of a “basic effect” at three different points in time. § A “basic effect” is a predicted change in the dependent variable when the independent variable is actively manipulated. § To assess a “basic effect” Visual Analysis includes simultaneous assessment of: § Level, Trend, Variability, Immediacy of Effect, Overlap across Adjacent Phases, Consistency of Data Pattern in Similar Phases. § (Parsonson & Baer, 1978; Kratochwill & Levin, 1992)
Assessing within phase “pattern” and Between phase “basic effect” § Level § Trend Within § Variability Phase + § Overlap § Immediacy of Effect § Consistency across similar phases _____________________ § Other: vertical analysis; intercept gap Between Phases
Six Variables Considered in Visual Analysis § 1. Level § The mean of the data within a phase § Also can be used to assess the level of the last 3 -5 data points within a phase. § 2. Trend § The slope of the best-fit straight line describing data within a phase § 3. Variability § The level deviation of data around the slope of the best fit straight line (range, standard deviation)
Level 10 9 8 7 6 5 4 3 2 1 0 1 2 3 4 5 6
Level 10 9 8 7 6 5 4 3 2 1 0 1 2 3 4 5 6 7 8 9
Level 10 9 8 7 6 5 4 3 2 1 0 1 2 3 4 5 6 7 8
Level 10 9 8 7 6 5 4 3 2 1 0 1 2 3 4 5 6 7 8 9
Trend 10 9 8 7 6 5 4 3 2 1 0 1 2 3 4 5 6 7 8 9 10 11 12
Trend 10 9 8 7 6 5 4 3 2 1 0 1 2 3 4 5 6 7 8 9
Trend 10 9 8 7 6 5 4 3 2 1 0 1 2 3 4 5 6 7 8 9 10 11 12 13
Trend 9 8 7 6 5 4 3 2 1 0 1 2 3 4 5 6 7 8 9 10 11 12 13
Variability NO Not, the way to assess variability 10 9 8 7 6 5 4 3 2 1 0 1 2 3 4 5 6 7 8 9 10 11 12 13
Variability YES The way to assess variability 10 9 8 7 6 5 4 3 2 1 0 1 2 3 4 5 6 7 8 9 10 11 12 13
Variability 10 9 8 7 6 5 4 3 2 1 0 1 2 3 4 5 6 7 8 9
Variability 10 9 8 7 6 5 4 3 2 1 0 1 2 3 4 5 6 7 8 9 10 11
Variables Considered in Visual Analysis 4. Overlap The percentage of data from one phase (typically the intervention phase) that overlaps with the range of data from the previous phase (typically the baseline phase)
Overlap 100% overlap 0% non. Overlap 10 9 8 7 6 5 4 3 2 1 0 1 2 3 4 5 6 7 8 9 10 11 12 13 14 15 16 17 18
2/8 = 25% Overlap 6/8 = 75% non-Overlap
Variables Considered in Visual Analysis 5. Immediacy of Effect The magnitude of change (in level, trend or variability) between the last 3 -5 data points in one phase and the first 3 -5 data points in the next phase. 6. Consistency of Data Pattern in Similar Phases The extent to which phases with similar conditions are associated with data similar data patterns.
Immediacy of Effect
Immediacy of Effect
Consistency across Similar Phases § Level, Trend, Variability define “similar” pattern across phases with “similar” status of the Independent Variable. § “A” phases are more similar to each other than “B” phases… and vice versa.
Visual Analysis: The Interactions within Visual Analysis Assessing change in Level The greater the variability the more data points needed to build a confident index of “level” The greater the trend the less useful “level” becomes for predicting future performance, or assessing overlap Assessing change in Trend Within phase trends may be linear or non-linear. The greater the trend, the more data points needed to document a predictable pattern. The shift in trend at the end of a phase should not be moving in the direction of the anticipated IV effect.
Visual Analysis: The Interaction of the Visual Analysis Variables Assessing change in Variability The greater the variability the more data points are needed within a phase to document a predictable pattern Within phase shift in variability requires more data points to establish a stable pattern Outliers require more data points within a phase, and a phase should not end with an outlier. Assessing Overlap (using range) becomes less relevant with increased trend. Instead use overlap projected by confidence intervals around best fit straight line.
Visual Analysis: The Interaction of the Visual Analysis Variables § Immediacy of Effect § Variability at end of first phase and beginning of second phase reduce the impact of “immediacy of effect. ”
Visual Analysis: The core discriminations once the Design is selected as meeting standards § Is the Baseline adequate? § Are there sufficient data within a phase to document a “pattern? ” § Is there a “basic effect” between two phases? § As this for each pair of phases. § Is there a functional relationship documented by the full data set within a study?
Reversal/ Withdrawal Designs
First Demonstration of Effect Third Demonstration of Effect Second Demonstration of Effect Visual Analysis: 1. Change in Level 2. Change in Trend 3. Change in Variability 4. Immediacy of Effect Parsonson & Baer, 1978; Kratochwill & Levin, 1992 5. Overlap 6. Consistency of Data Patterns across similar Phases
First Demonstration of Effect Third Demonstration of Effect Second Demonstration of Effect Comparison of actual against projected data (Analysis of Transition States versus Analysis of Steady States)
First Demonstration of Effect Third Demonstration of Effect Second Demonstration of Effect Consistency in data pattern across similar phases
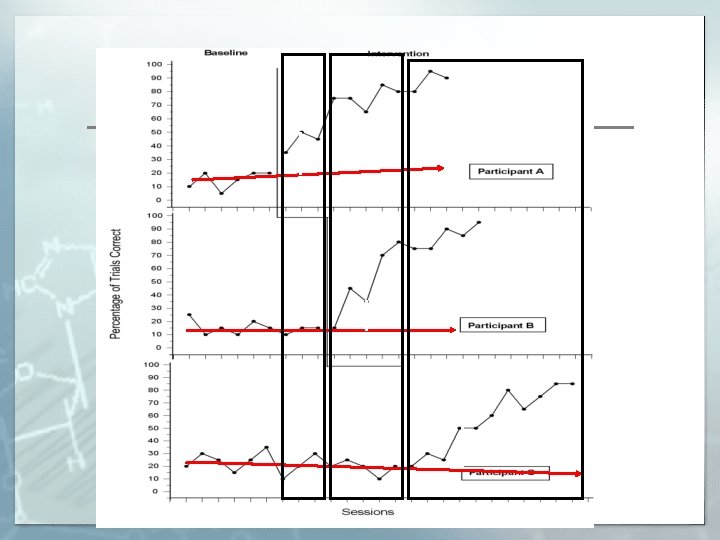
Multiple Baseline Design § § Level, Trend, Variability, Overlap Immediacy of Effect Consistency across similar phases Stability in non-intervened series when effect demonstrated in one series
Use the Intercept Gap to assess a “basic effect” § The magnitude of the intercept gap between the best-fit straight lines associated with two phases at each point of intervention.
X Z Y Assess the magnitude of the intercept gap (Point X, Point Y, Point Z)
X Y Z
Alternating Treatment/ Multi-element designs § Magnitude of separation § Greater the difference between two conditions, larger the demonstration of a functional relation § Consistency of separation § Greater consistency of separation between two conditions (no overlap) larger the demonstration of a functional relation § Number of data points used to establish experimental control § At least 4 comparisons. The more points documenting separation the stronger the demonstration of experimental control.
Tangibl e Escap e Control Attention * * *
Magnitude of separation Number of comparisons (data points) Consistency of separation across comparisons JABA 1994
Social Attention
Implications for Construction of Research Questions in Single-case Research § Increase the precision of Research Questions § Define conceptual logic for research question § Define research question with greater precision § IV related to change in level, trend, variability? “Is there is a functional relation between Functional Communication Training and reduction in the level and variability of problem behavior? ”