Highlights of the Ready Mixed Concrete Industry Data


- Slides: 36
Highlights of the Ready Mixed Concrete Industry Data Report Presented to the 47 th Annual Business Administration Conference by William B. Allen - Villere Partners October 17, 2005
Benchmarking l Assists in helping to analyze the cost of doing business l Assists in helping to analyze the efficiency of an operation
Surveys Available l Industry Data Survey l Fleet Benchmarking Survey l Safety Benchmarking Survey l Environmental Costs Survey l Compensation Survey
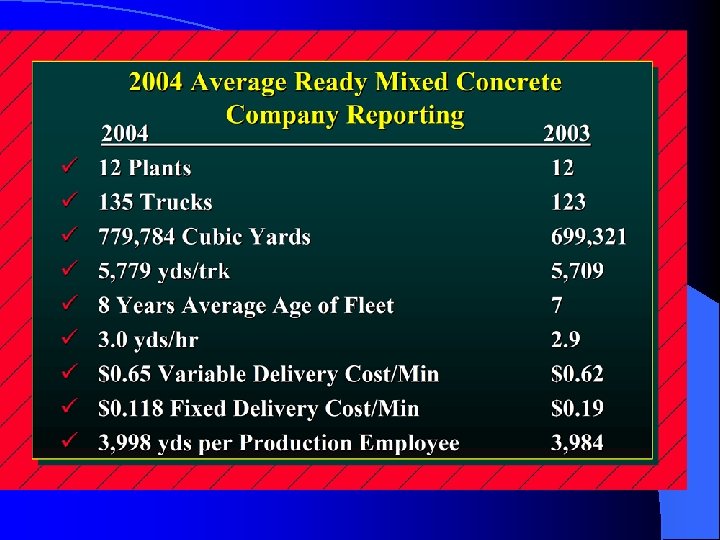
The Industry Data Survey l Company Size Analysis By % Sales & $-Per-Yd l Regional Analysis By % Sales & $-Per-Yd l Rural, Urban & Mixed Region Analyses l Five Year Trend Analysis
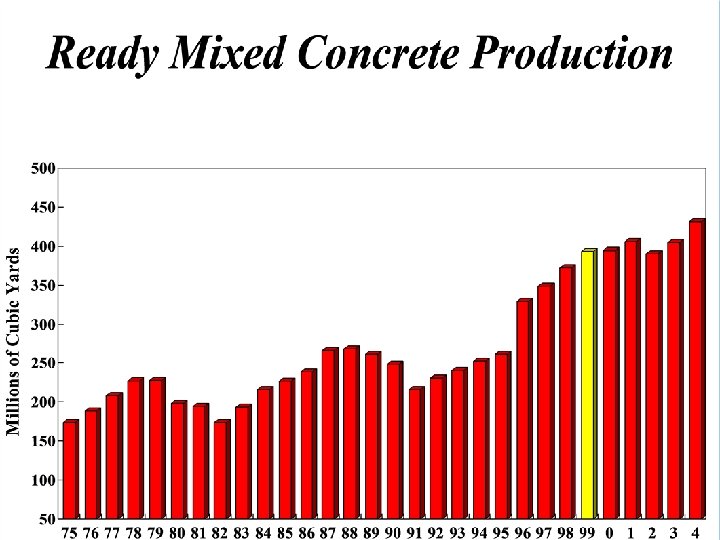
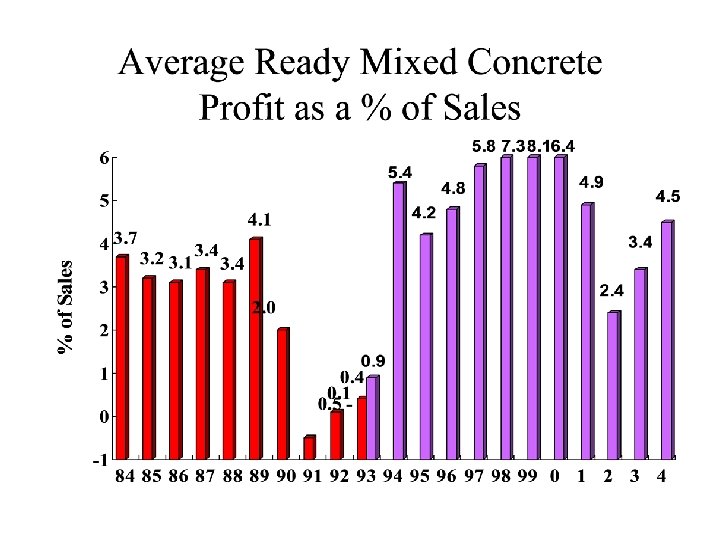
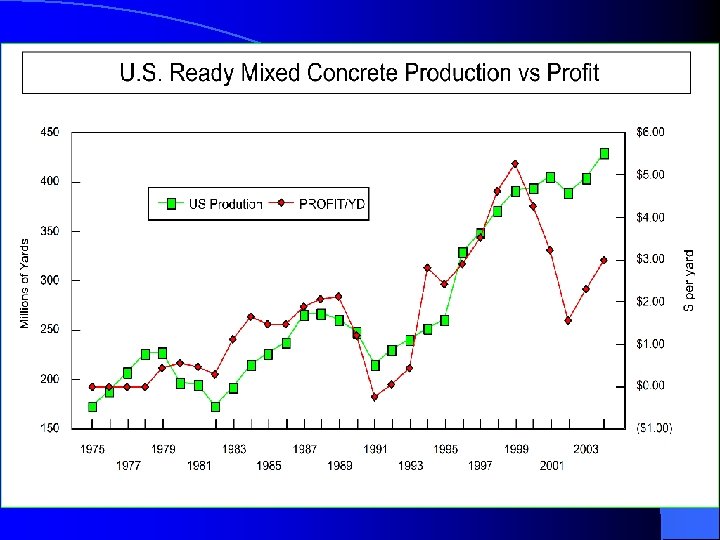
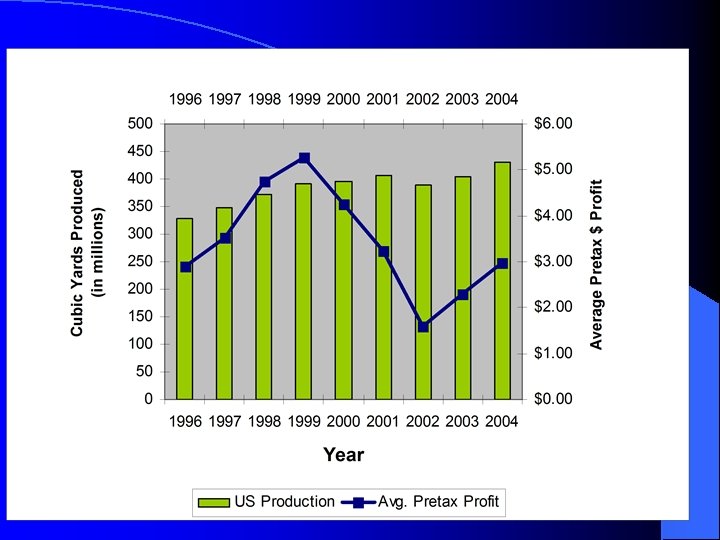
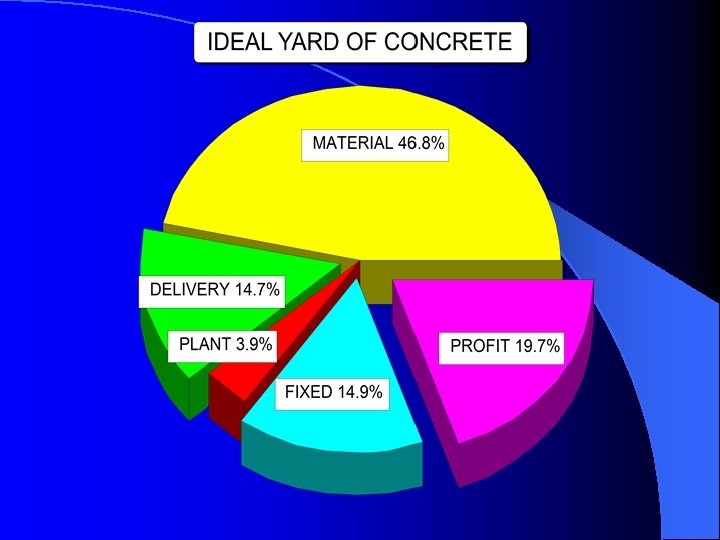
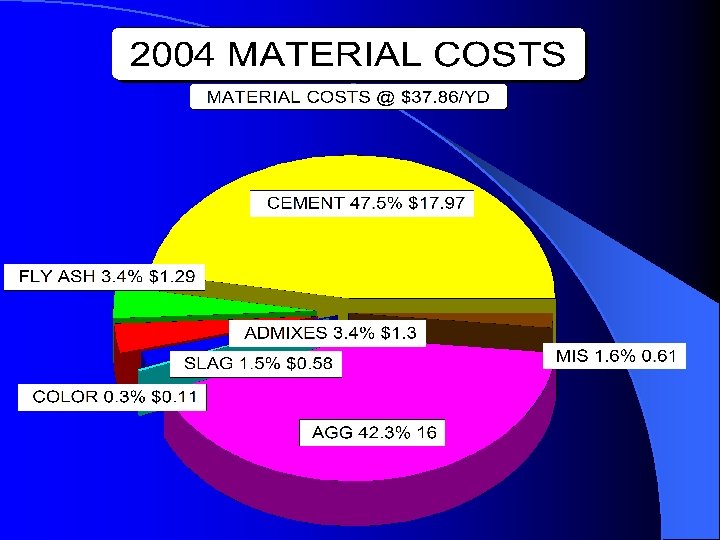
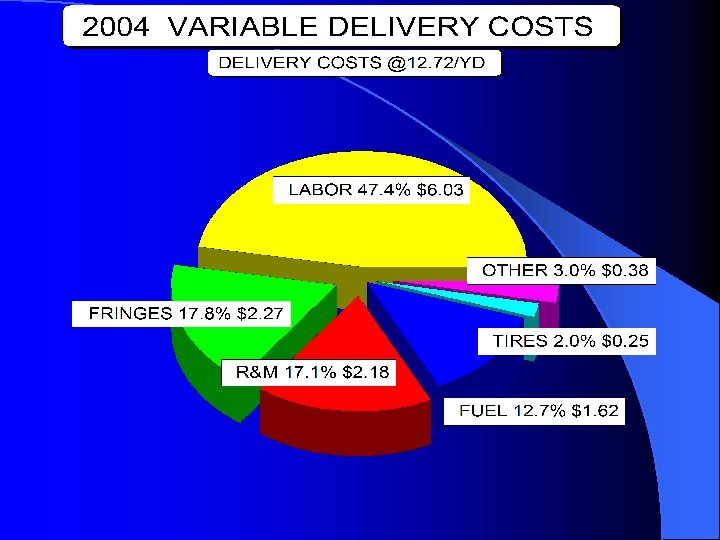
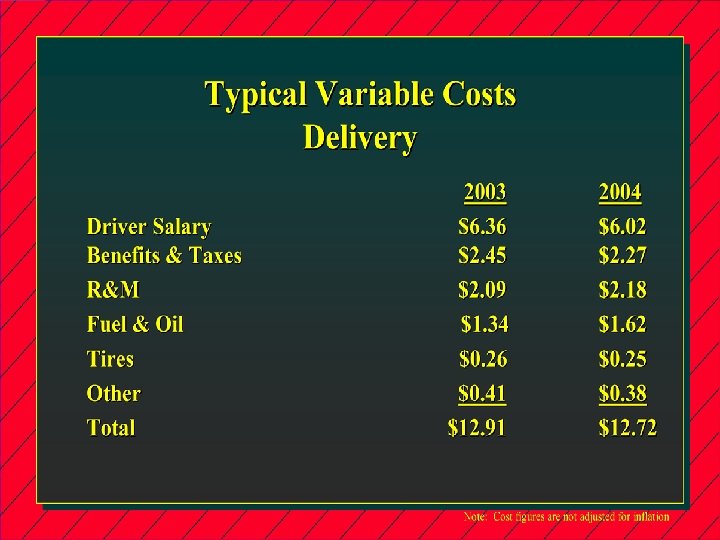
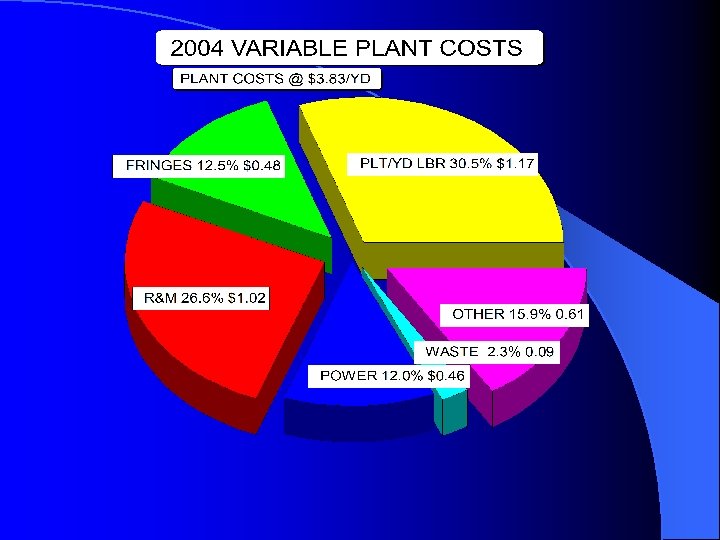
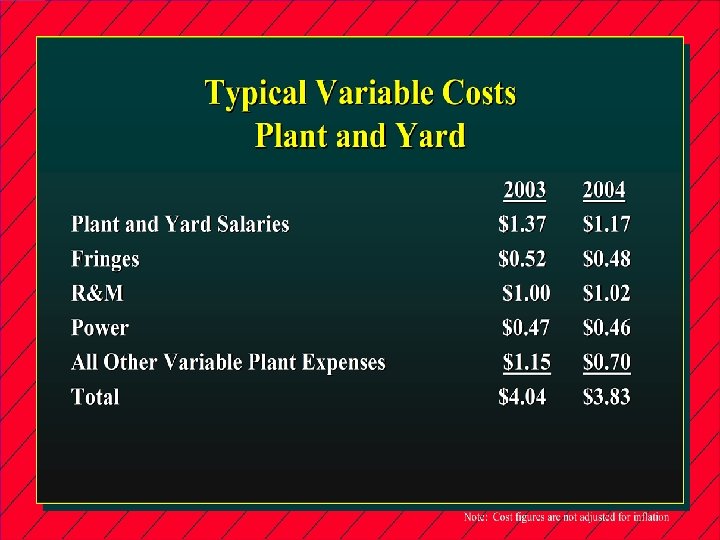
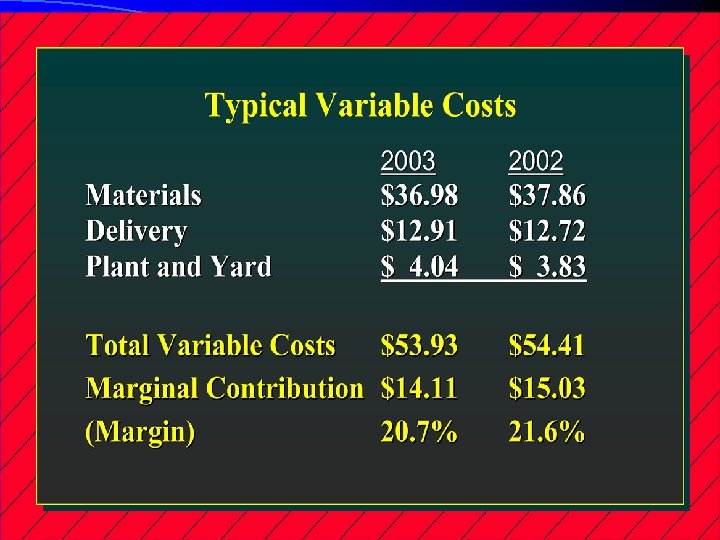
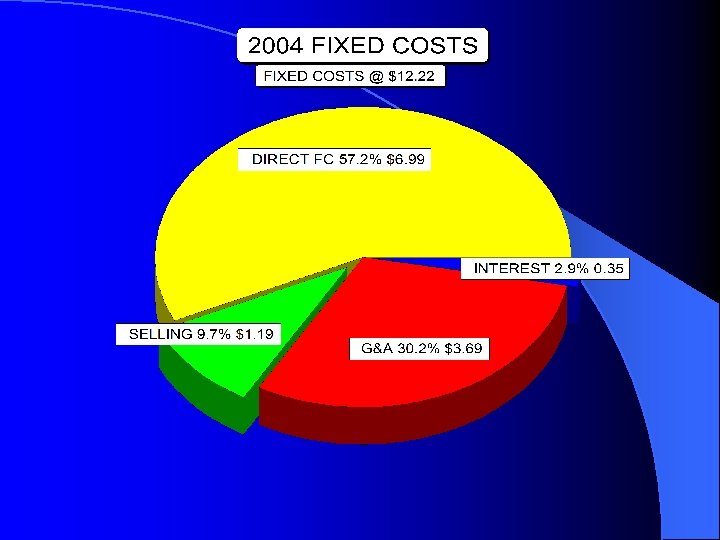
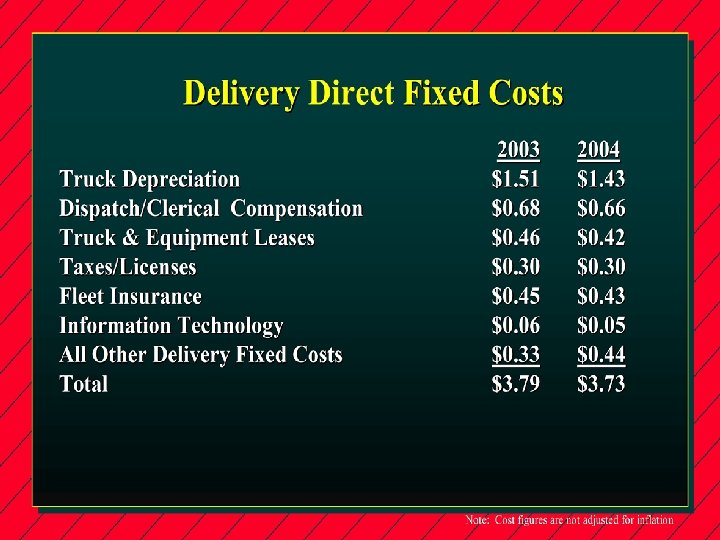
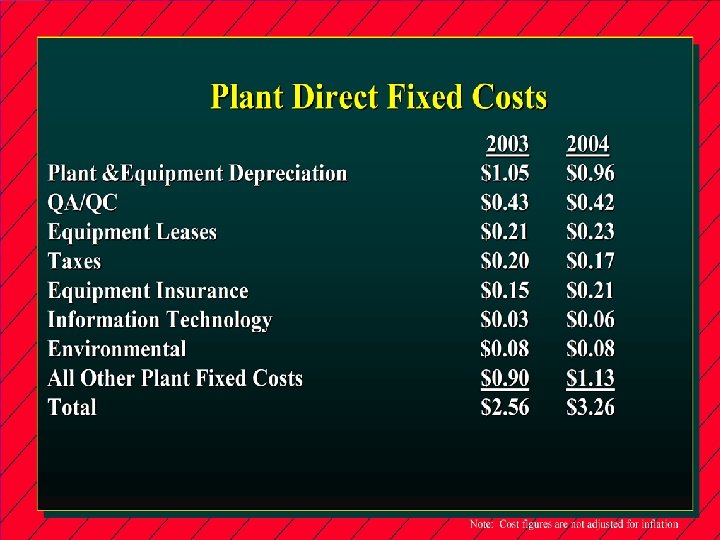
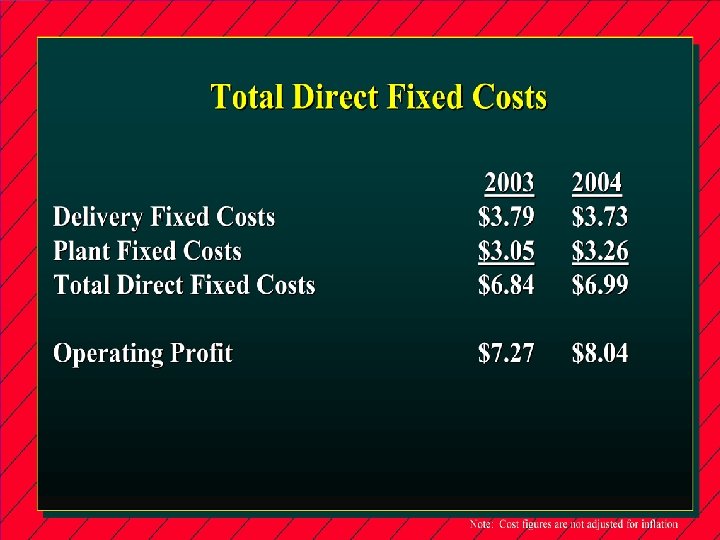
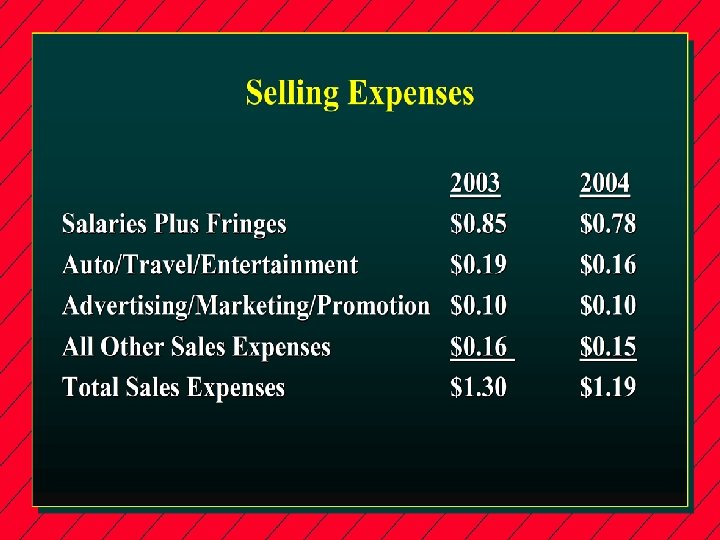
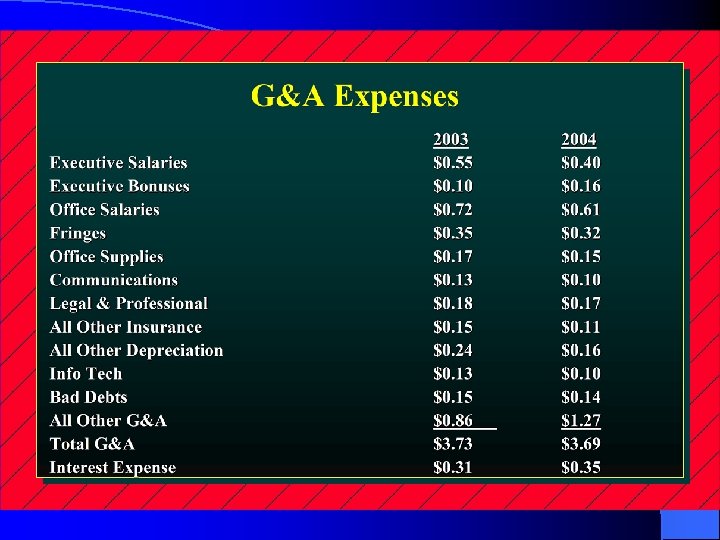
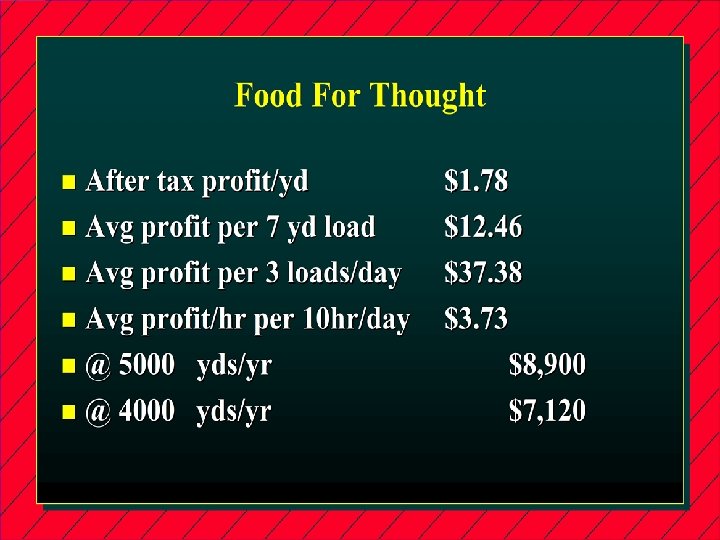
$ Per Yard Ready Mixed Concrete Profitability
Growth Comparison YTY % Change
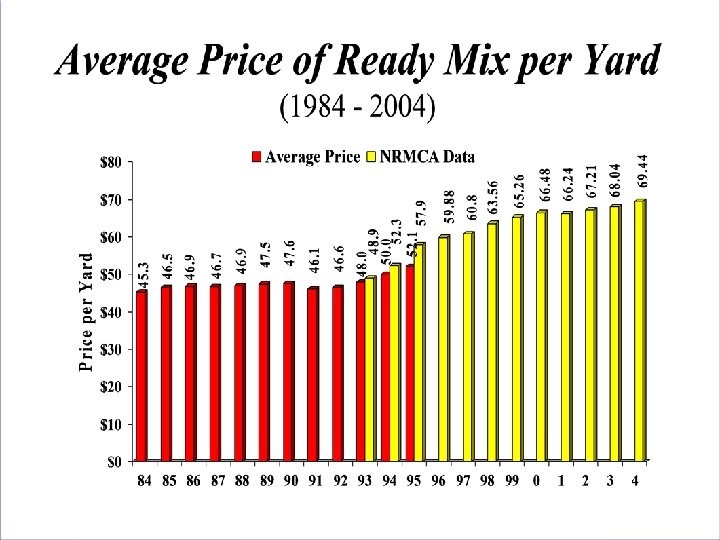
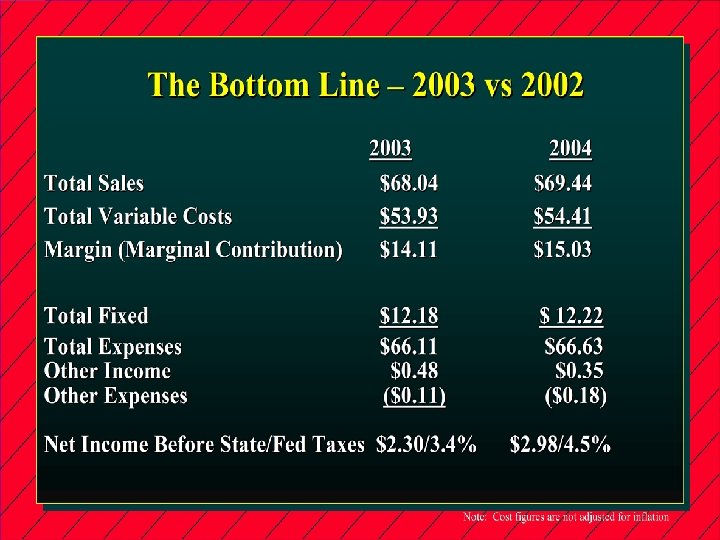
Profit vs Sales Price
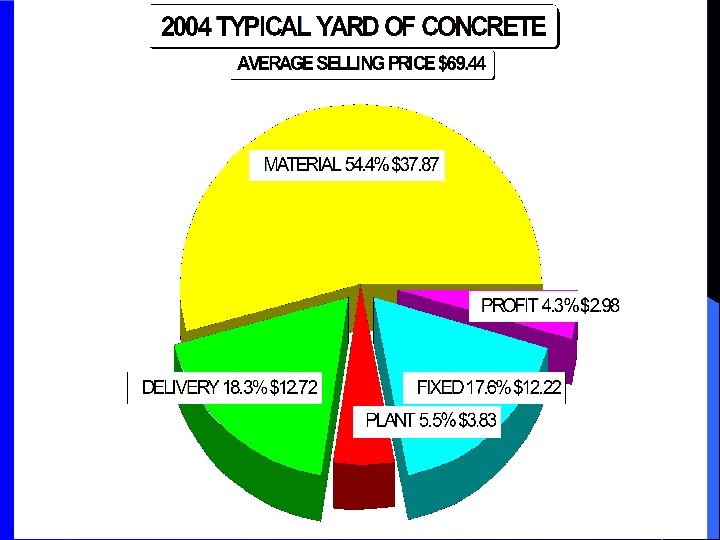
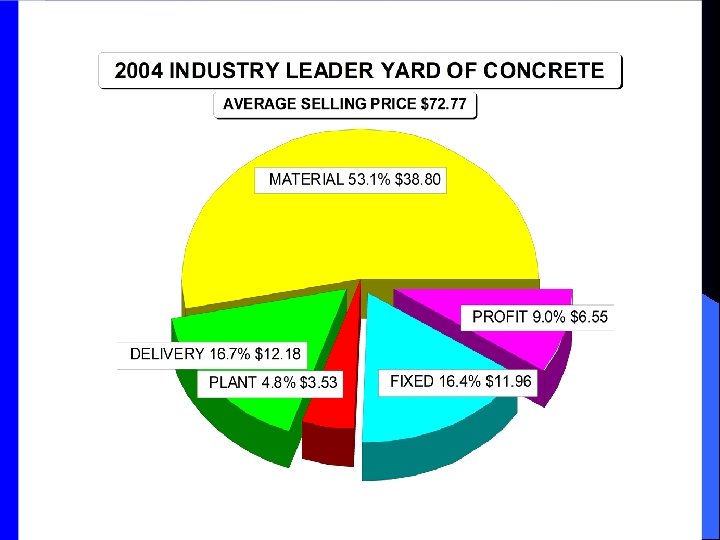
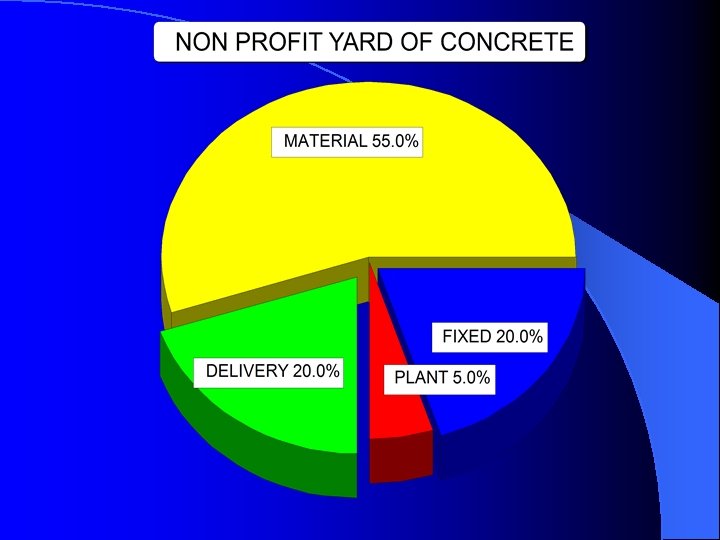
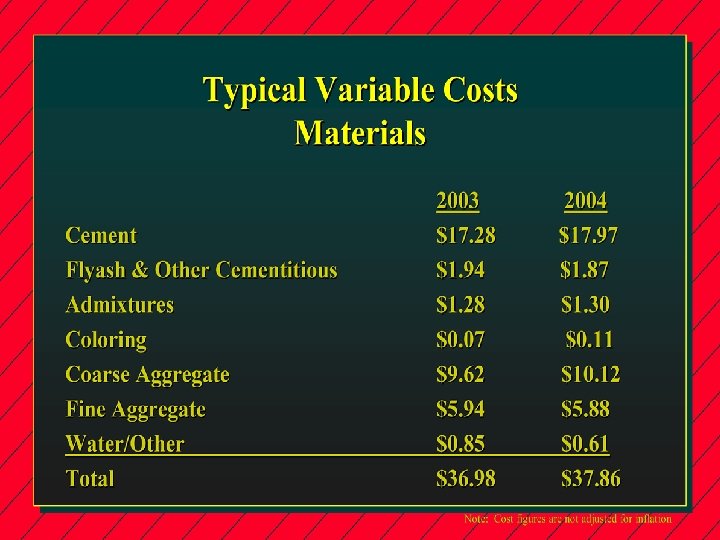
Price vs Cost
TABLE 1: Efficiency Ratios by Company Size Item <100 K 100 -299 K 300 -500 K >500 K Typical Leader DSO 43. 2 49. 9 46. 8 52. 2 51. 6 43. 3 Yds/Hour 2. 2 2. 1 3. 0 3. 2 3. 0 3, 415 4, 892 5, 186 5, 976 5, 779 6, 112 Sales/Employee $160, 416 $195, 036 $233, 996 $227, 896 $225, 230 $244, 609 Var. Del/minute $0. 57 $0. 47 $0. 69 $0. 66 $0. 65 $0. 62 Yds/Truck/Yr
TABLE 2: Efficiency Ratios by Regions Item NE/MA DSO SE 63. 2 45. 1 2. Yds/Hour 7 Yds/Truck/Y r 1 NC 45. 0 2. 9 4, 77 Leader 51. 6 43. 3 3. 8 5, 48 9 Typical 45. 8 2. 6 6, 19 2 PSW 58. 7 3. 2 4, 76 7 PNW 38. 3 2. 7 6, 66 2 RM 65. 3 3. 5 4, 89 2 GL 51. 3 2. 9 5, 93 7 SC 3. 0 7, 01 0 3. 0 5, 77 9 6, 11 2
Summary What Can We Do To Improve Our Bottom Line? l Compare Strengths & Weaknesses to Peers l Improve Your Management Financial Cost Data (Use NRMCA’s Chart of Accounts) l Know Your Break-Even Point l Cost Out Jobs (Use NRMCA’s Job Cost Program) l Price Jobs Based On A Desired Return