High Performance Computing Concepts Methods Means Performance 3

- Slides: 48

High Performance Computing: Concepts, Methods & Means Performance 3 : Measurement Prof. Thomas Sterling Department of Computer Science Louisiana State University February 27 th, 2007

Term Projects • • • Graduate students only Due date: April 19 th, 2007 Total time: approx. 40 hours 20% of final grade 4 categories of projects: – – A) technology evolution report (20 page report) B) Fixed application code execution scaling (7 page report) C) Synthetic code parametric studies (7 page report) D) Parallel application development (7 page report) • 1 paragraph abstract due March 9 th – Email to Chirag by COB Friday

Term Projects – Technology Evolution • In depth survey of an enabling technology • Report on capability with respect to time and factors • Two general classes of technology: – Device technology • • Main memory Secondary storage System network Logic – Architecture • • SIMD Vector Systolic Dataflow

Term Project – Fixed Application Scaling • Select an application code – Need not be one of those in class – Must be a parallel code – You need not write this yourself • Select two or more system parameters to scale with – – # processors # nodes Network bandwidth and/or latency Data block partition size • Use performance measurement and profiling tools – Describe measured trends – Diagnose reasons for observed results

Term Project – Synthetic Parametric Study • Write a code expressly to exercise one or more system functions – Parallelism – Network bandwidth – Memory bandwidth • Allow at least one dimension to be independent and adjust – Message insert rate – Message packet size – Overhead time • Show system operation with respect to parameter

Term Project – Roll your own • Write a small parallel application program – Preferably not one we’ve done in class – Can be something you’ve done in another class or research project modified for MPI or Open. MP – Please! Do this yourself!! – Libraries permitted • Use profiling tools to determine where most of the work is being done • Demonstrate scaling wrt # processors

Topics • • Introduction Performance Characteristics & Models Performance Models : Log. P Performance Models : Log. GP Benchmarks : b_eff MPI Tracing : PMPI TAU & MPI Summary – Materials for Test 7

Topics • Introduction • • Performance Characteristics & Models Performance Models : Log. P Performance Models : Log. GP Benchmarks : b_eff MPI Tracing : PMPI TAU & MPI Summary – Materials for Test 8

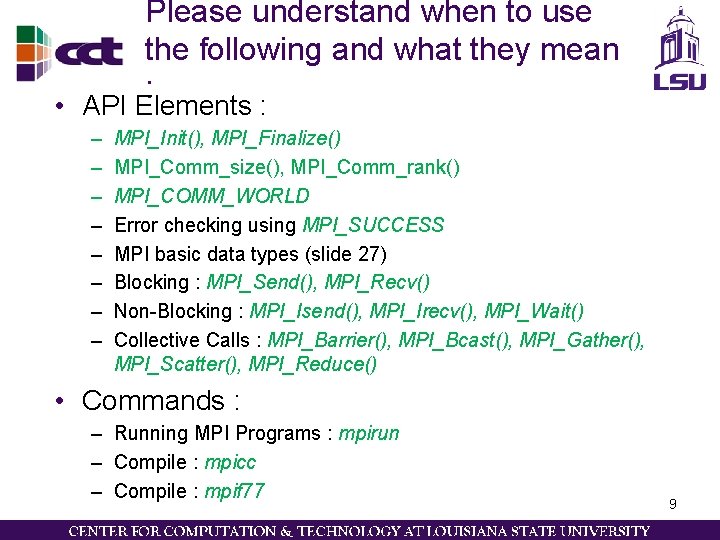
Please understand when to use the following and what they mean : • API Elements : – – – – MPI_Init(), MPI_Finalize() MPI_Comm_size(), MPI_Comm_rank() MPI_COMM_WORLD Error checking using MPI_SUCCESS MPI basic data types (slide 27) Blocking : MPI_Send(), MPI_Recv() Non-Blocking : MPI_Isend(), MPI_Irecv(), MPI_Wait() Collective Calls : MPI_Barrier(), MPI_Bcast(), MPI_Gather(), MPI_Scatter(), MPI_Reduce() • Commands : – Running MPI Programs : mpirun – Compile : mpicc – Compile : mpif 77 9

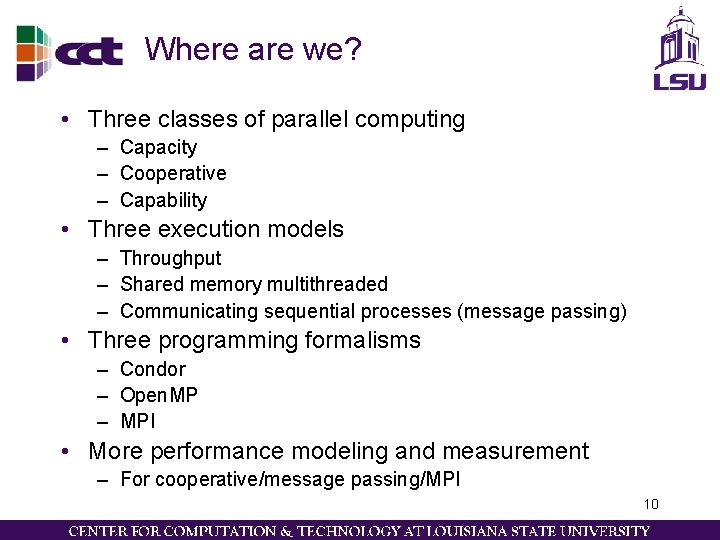
Where are we? • Three classes of parallel computing – Capacity – Cooperative – Capability • Three execution models – Throughput – Shared memory multithreaded – Communicating sequential processes (message passing) • Three programming formalisms – Condor – Open. MP – MPI • More performance modeling and measurement – For cooperative/message passing/MPI 10

Topics • Introduction • Performance Characteristics & Models • • • Performance Models : Log. P Performance Models : Log. GP Benchmarks : b_eff MPI Tracing : PMPI TAU & MPI Summary – Materials for Test 11

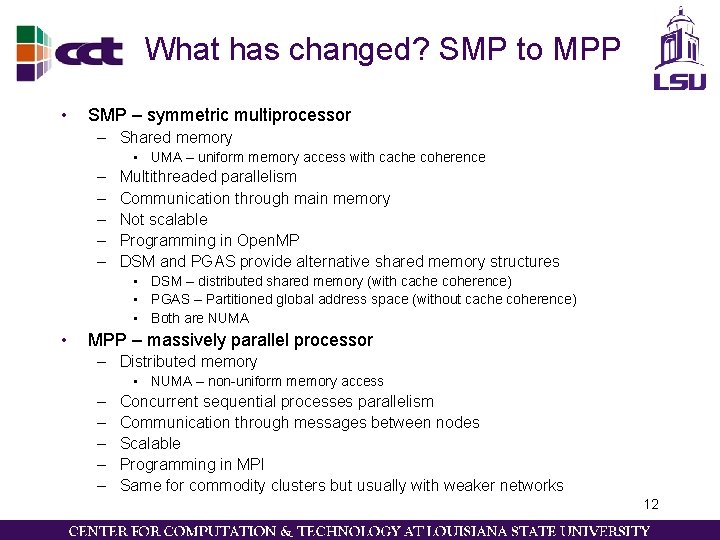
What has changed? SMP to MPP • SMP – symmetric multiprocessor – Shared memory • UMA – uniform memory access with cache coherence – – – Multithreaded parallelism Communication through main memory Not scalable Programming in Open. MP DSM and PGAS provide alternative shared memory structures • DSM – distributed shared memory (with cache coherence) • PGAS – Partitioned global address space (without cache coherence) • Both are NUMA • MPP – massively parallel processor – Distributed memory • NUMA – non-uniform memory access – – – Concurrent sequential processes parallelism Communication through messages between nodes Scalable Programming in MPI Same for commodity clusters but usually with weaker networks 12

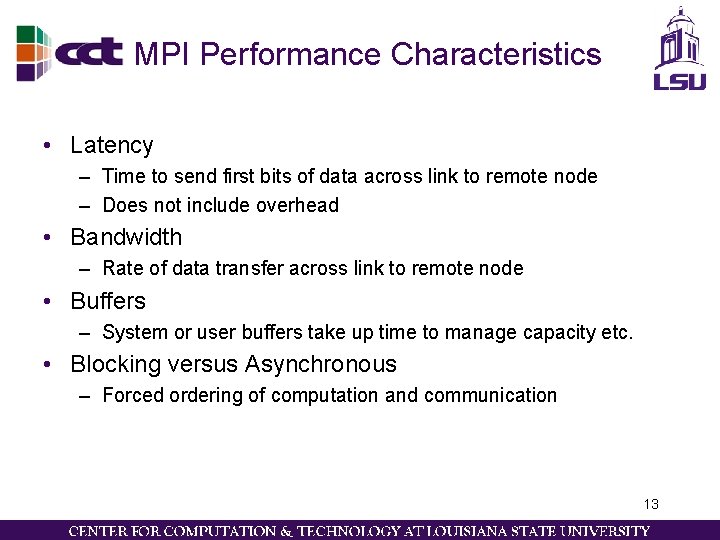
MPI Performance Characteristics • Latency – Time to send first bits of data across link to remote node – Does not include overhead • Bandwidth – Rate of data transfer across link to remote node • Buffers – System or user buffers take up time to manage capacity etc. • Blocking versus Asynchronous – Forced ordering of computation and communication 13

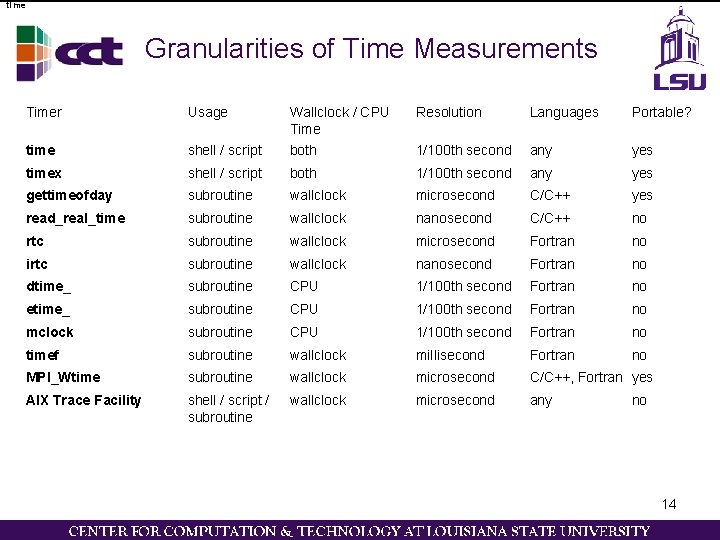
time Granularities of Time Measurements Timer Usage Resolution Languages Portable? shell / script Wallclock / CPU Time both time 1/100 th second any yes timex shell / script both 1/100 th second any yes gettimeofday subroutine wallclock microsecond C/C++ yes read_real_time subroutine wallclock nanosecond C/C++ no rtc subroutine wallclock microsecond Fortran no irtc subroutine wallclock nanosecond Fortran no dtime_ subroutine CPU 1/100 th second Fortran no etime_ subroutine CPU 1/100 th second Fortran no mclock subroutine CPU 1/100 th second Fortran no timef subroutine wallclock millisecond Fortran no MPI_Wtime subroutine wallclock microsecond C/C++, Fortran yes AIX Trace Facility shell / script / subroutine wallclock microsecond any no 14

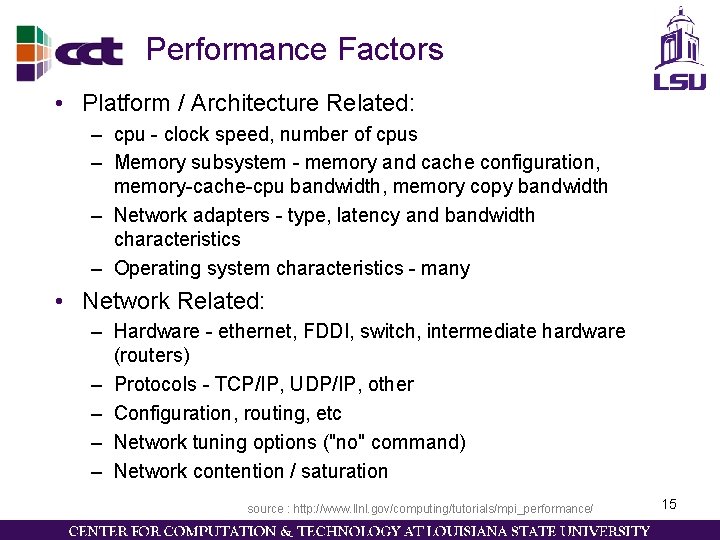
Performance Factors • Platform / Architecture Related: – cpu - clock speed, number of cpus – Memory subsystem - memory and cache configuration, memory-cache-cpu bandwidth, memory copy bandwidth – Network adapters - type, latency and bandwidth characteristics – Operating system characteristics - many • Network Related: – Hardware - ethernet, FDDI, switch, intermediate hardware (routers) – Protocols - TCP/IP, UDP/IP, other – Configuration, routing, etc – Network tuning options ("no" command) – Network contention / saturation source : http: //www. llnl. gov/computing/tutorials/mpi_performance/ 15

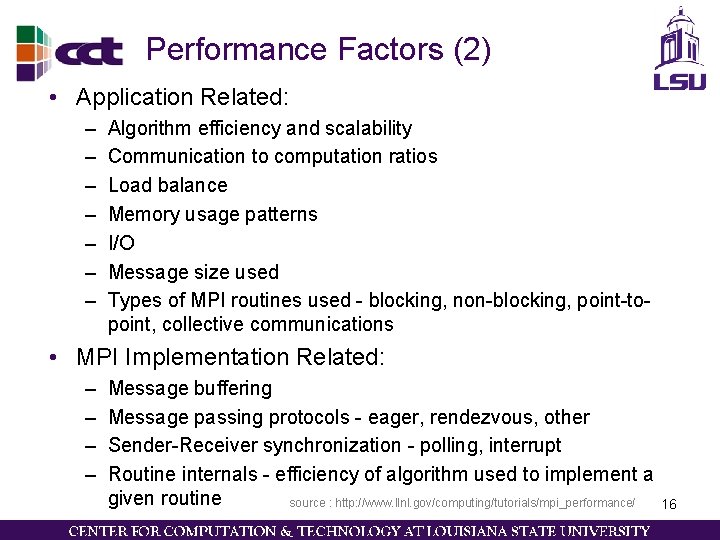
Performance Factors (2) • Application Related: – – – – Algorithm efficiency and scalability Communication to computation ratios Load balance Memory usage patterns I/O Message size used Types of MPI routines used - blocking, non-blocking, point-topoint, collective communications • MPI Implementation Related: – – Message buffering Message passing protocols - eager, rendezvous, other Sender-Receiver synchronization - polling, interrupt Routine internals - efficiency of algorithm used to implement a given routine source : http: //www. llnl. gov/computing/tutorials/mpi_performance/ 16

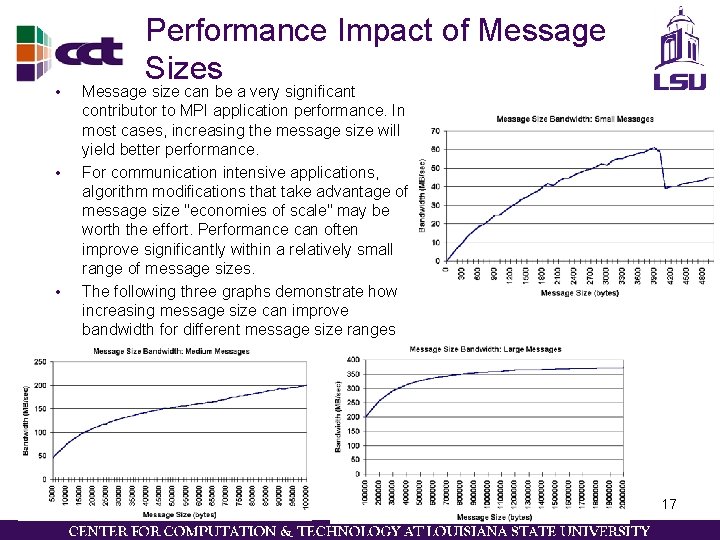
• • • Performance Impact of Message Sizes Message size can be a very significant contributor to MPI application performance. In most cases, increasing the message size will yield better performance. For communication intensive applications, algorithm modifications that take advantage of message size "economies of scale" may be worth the effort. Performance can often improve significantly within a relatively small range of message sizes. The following three graphs demonstrate how increasing message size can improve bandwidth for different message size ranges 17

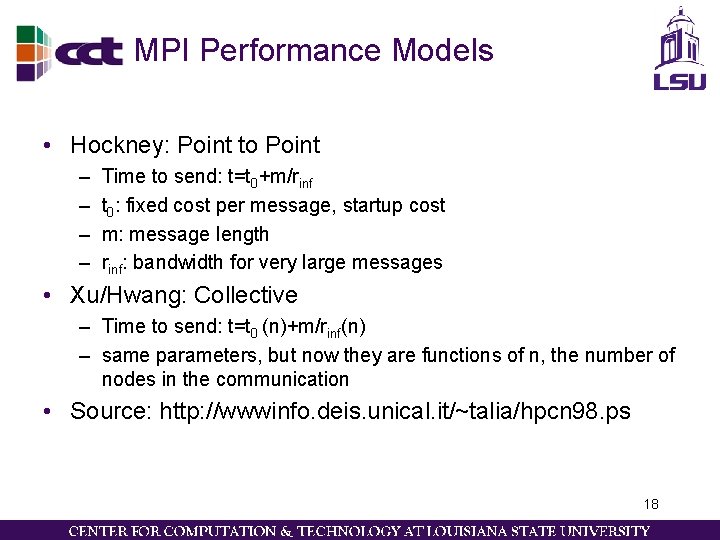
MPI Performance Models • Hockney: Point to Point – – Time to send: t=t 0+m/rinf t 0: fixed cost per message, startup cost m: message length rinf: bandwidth for very large messages • Xu/Hwang: Collective – Time to send: t=t 0 (n)+m/rinf(n) – same parameters, but now they are functions of n, the number of nodes in the communication • Source: http: //wwwinfo. deis. unical. it/~talia/hpcn 98. ps 18

Topics • • Introduction Performance Characteristics & Models Performance Models : Log. P Performance Models : Log. GP Benchmarks : b_eff MPI Tracing : PMPI TAU & MPI Summary – Materials for Test 19

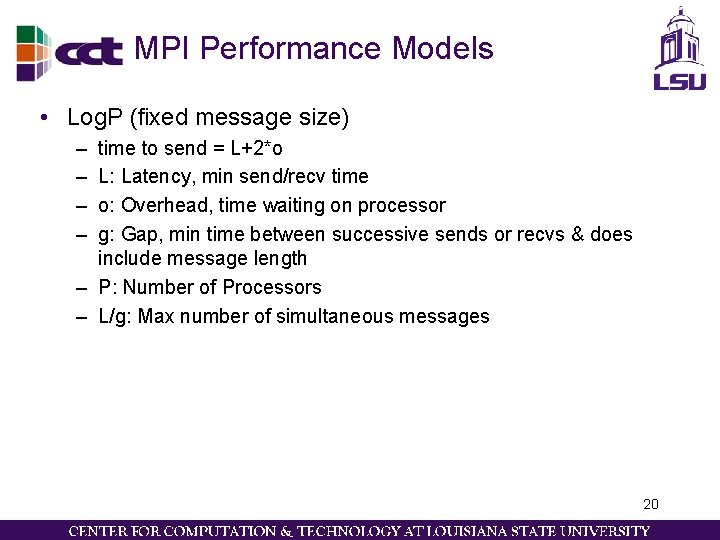
MPI Performance Models • Log. P (fixed message size) – – time to send = L+2*o L: Latency, min send/recv time o: Overhead, time waiting on processor g: Gap, min time between successive sends or recvs & does include message length – P: Number of Processors – L/g: Max number of simultaneous messages 20

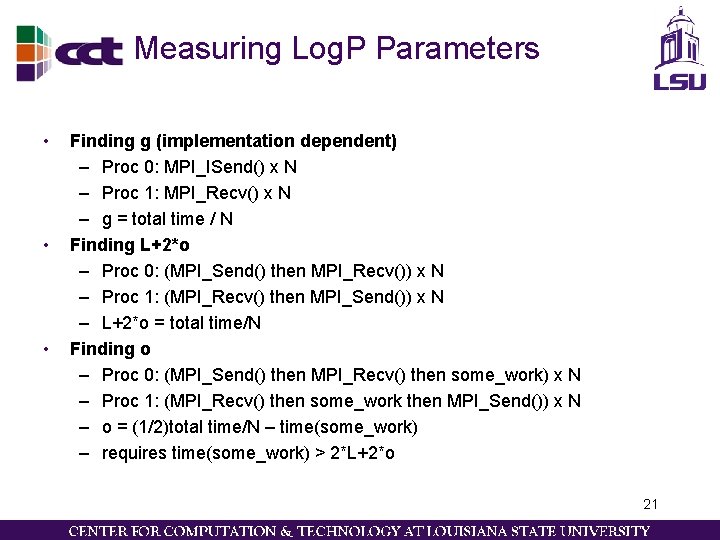
Measuring Log. P Parameters • • • Finding g (implementation dependent) – Proc 0: MPI_ISend() x N – Proc 1: MPI_Recv() x N – g = total time / N Finding L+2*o – Proc 0: (MPI_Send() then MPI_Recv()) x N – Proc 1: (MPI_Recv() then MPI_Send()) x N – L+2*o = total time/N Finding o – Proc 0: (MPI_Send() then MPI_Recv() then some_work) x N – Proc 1: (MPI_Recv() then some_work then MPI_Send()) x N – o = (1/2)total time/N – time(some_work) – requires time(some_work) > 2*L+2*o 21

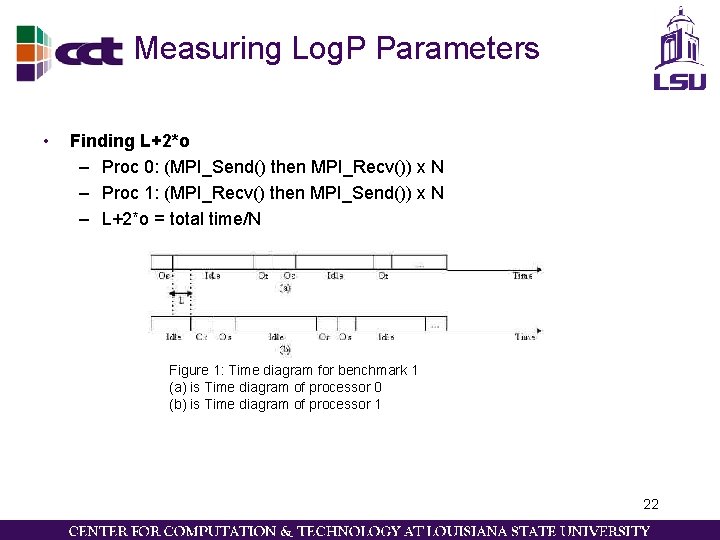
Measuring Log. P Parameters • Finding L+2*o – Proc 0: (MPI_Send() then MPI_Recv()) x N – Proc 1: (MPI_Recv() then MPI_Send()) x N – L+2*o = total time/N Figure 1: Time diagram for benchmark 1 (a) is Time diagram of processor 0 (b) is Time diagram of processor 1 22

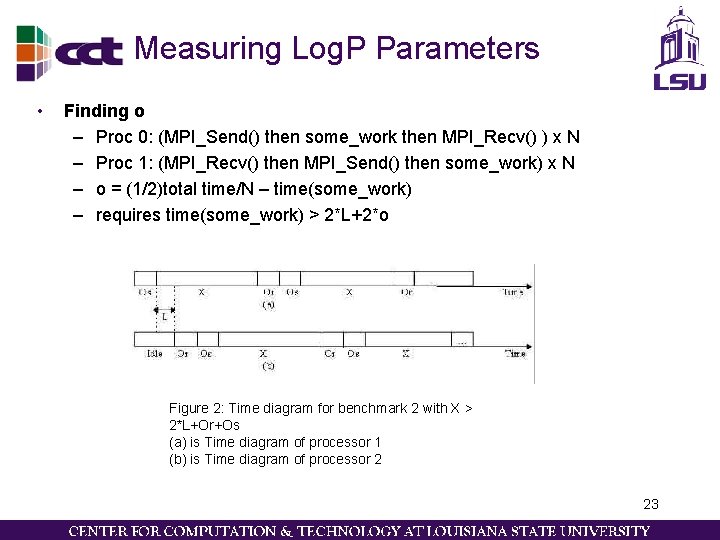
Measuring Log. P Parameters • Finding o – Proc 0: (MPI_Send() then some_work then MPI_Recv() ) x N – Proc 1: (MPI_Recv() then MPI_Send() then some_work) x N – o = (1/2)total time/N – time(some_work) – requires time(some_work) > 2*L+2*o Figure 2: Time diagram for benchmark 2 with X > 2*L+Or+Os (a) is Time diagram of processor 1 (b) is Time diagram of processor 2 23

Demo • Measure Log. P parameters 24

Topics • • Introduction Performance Characteristics & Models Performance Models : Log. P Performance Models : Log. GP Benchmarks : b_eff MPI Tracing : PMPI TAU & MPI Summary – Materials for Test 25

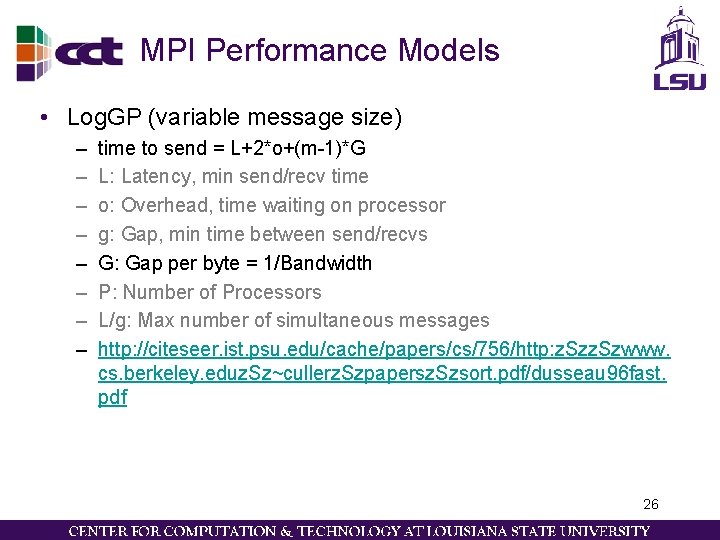
MPI Performance Models • Log. GP (variable message size) – – – – time to send = L+2*o+(m-1)*G L: Latency, min send/recv time o: Overhead, time waiting on processor g: Gap, min time between send/recvs G: Gap per byte = 1/Bandwidth P: Number of Processors L/g: Max number of simultaneous messages http: //citeseer. ist. psu. edu/cache/papers/cs/756/http: z. Szwww. cs. berkeley. eduz. Sz~cullerz. Szpapersz. Szsort. pdf/dusseau 96 fast. pdf 26

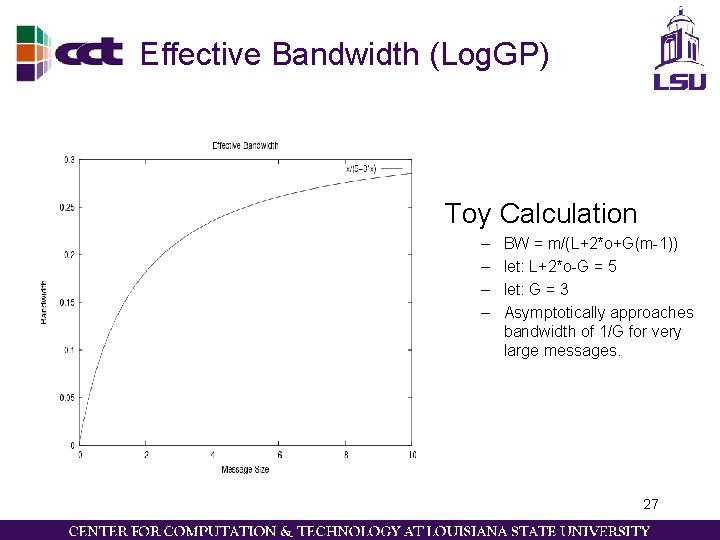
Effective Bandwidth (Log. GP) Toy Calculation – – BW = m/(L+2*o+G(m-1)) let: L+2*o-G = 5 let: G = 3 Asymptotically approaches bandwidth of 1/G for very large messages. 27

Topics • • Introduction Performance Characteristics & Models Performance Models : Log. P Performance Models : Log. GP Benchmarks : b_eff MPI Tracing : PMPI TAU & MPI Summary – Materials for Test 28

HPC Challenge Benchmarks • HPC Challenge: http: //icl. cs. utk. edu/hpcc/ – See results tab – b_eff benchmark is a part of this larger database – more info than just HPL! 29

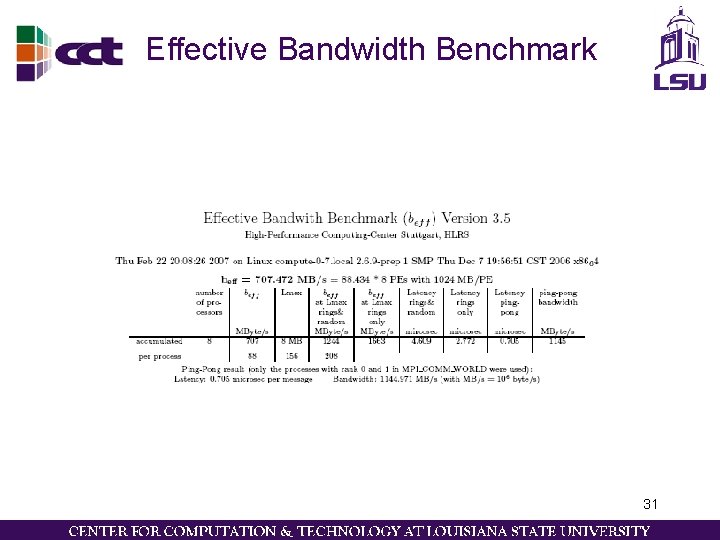
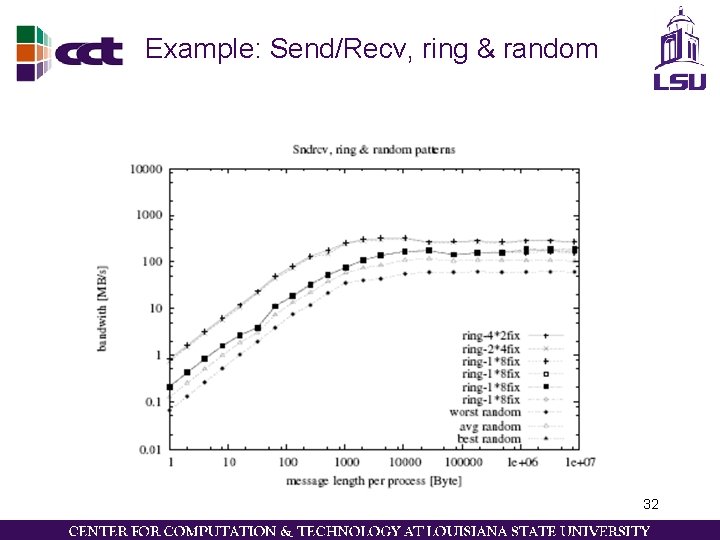
b_eff • Standard Benchmark – part of HPC Challenge – Provides effective bandwidth and latency • Averages a variety of message sizes and communication patterns • Determines an effective latency and bandwidth • b_eff depends on: – – hardware: interconnect, memory software: MPI implementation tuneable parameters of the os: buffers etc. See : http: //www. hlrs. de/organization/par/services/models/mpi/b_eff/ 30

Effective Bandwidth Benchmark 31

Example: Send/Recv, ring & random 32

Demo • running of b_eff 33

Topics • • Introduction Performance Characteristics & Models Performance Models : Log. P Performance Models : Log. GP Benchmarks : b_eff MPI Tracing : PMPI TAU & MPI Summary – Materials for Test 34

Portable MPI Tracing: PMPI • An API to MPI for tracing, debugging, performance measurements of MPI applications • MPI_<command>() calls PMPI_<command>() • MPI_Pcontrol(int) – 0: disabled – 1: enabled – Default Level – 2: flush trace buffers 35

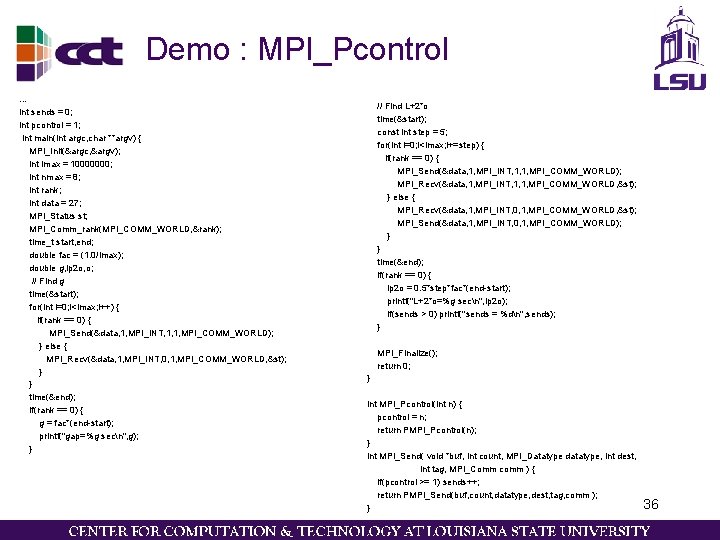
Demo : MPI_Pcontrol … int sends = 0; int pcontrol = 1; int main(int argc, char **argv) { MPI_Init(&argc, &argv); int imax = 10000000; int nmax = 8; int rank; int data = 27; MPI_Status st; MPI_Comm_rank(MPI_COMM_WORLD, &rank); time_t start, end; double fac = (1. 0/imax); double g, lp 2 o, o; // Find g time(&start); for(int i=0; i<imax; i++) { if(rank == 0) { MPI_Send(&data, 1, MPI_INT, 1, 1, MPI_COMM_WORLD); } else { MPI_Recv(&data, 1, MPI_INT, 0, 1, MPI_COMM_WORLD, &st); } } time(&end); if(rank == 0) { g = fac*(end-start); printf("gap=%g secn", g); } // Find L+2*o time(&start); const int step = 5; for(int i=0; i<imax; i+=step) { if(rank == 0) { MPI_Send(&data, 1, MPI_INT, 1, 1, MPI_COMM_WORLD); MPI_Recv(&data, 1, MPI_INT, 1, 1, MPI_COMM_WORLD, &st); } else { MPI_Recv(&data, 1, MPI_INT, 0, 1, MPI_COMM_WORLD, &st); MPI_Send(&data, 1, MPI_INT, 0, 1, MPI_COMM_WORLD); } } time(&end); if(rank == 0) { lp 2 o = 0. 5*step*fac*(end-start); printf("L+2*o=%g secn", lp 2 o); if(sends > 0) printf("sends = %dn", sends); } MPI_Finalize(); return 0; } int MPI_Pcontrol(int n) { pcontrol = n; return PMPI_Pcontrol(n); } int MPI_Send( void *buf, int count, MPI_Datatype datatype, int dest, int tag, MPI_Comm comm ) { if(pcontrol >= 1) sends++; return PMPI_Send(buf, count, datatype, dest, tag, comm ); } 36

Demo • MPI tracing, custom implementation 37

Topics • • Introduction Performance Characteristics & Models Performance Models : Log. P Performance Models : Log. GP Benchmarks : b_eff MPI Tracing : PMPI TAU & MPI Summary – Materials for Test 38

TAU and MPI • Tau uses the PMPI interface to track MPI calls • Jumpshot is used as the viewer – Shows subroutine calls and mpi calls 39

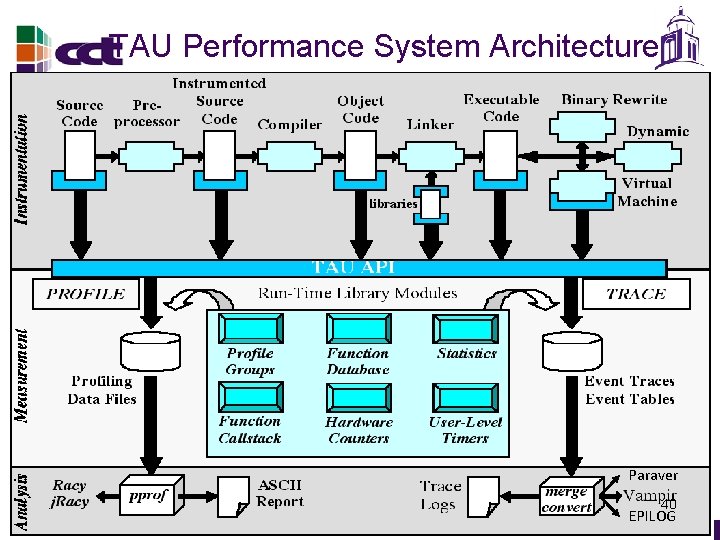
TAU Performance System Architecture Paraver 40 EPILOG

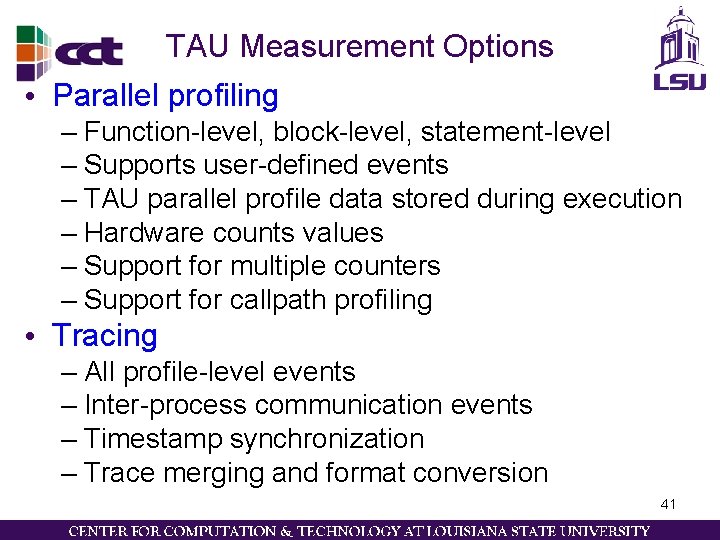
TAU Measurement Options • Parallel profiling – Function-level, block-level, statement-level – Supports user-defined events – TAU parallel profile data stored during execution – Hardware counts values – Support for multiple counters – Support for callpath profiling • Tracing – All profile-level events – Inter-process communication events – Timestamp synchronization – Trace merging and format conversion 41

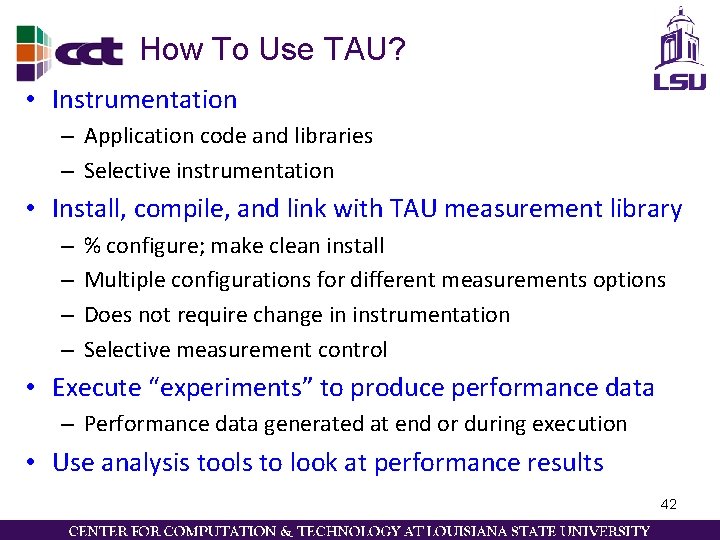
How To Use TAU? • Instrumentation – Application code and libraries – Selective instrumentation • Install, compile, and link with TAU measurement library – – % configure; make clean install Multiple configurations for different measurements options Does not require change in instrumentation Selective measurement control • Execute “experiments” to produce performance data – Performance data generated at end or during execution • Use analysis tools to look at performance results 42

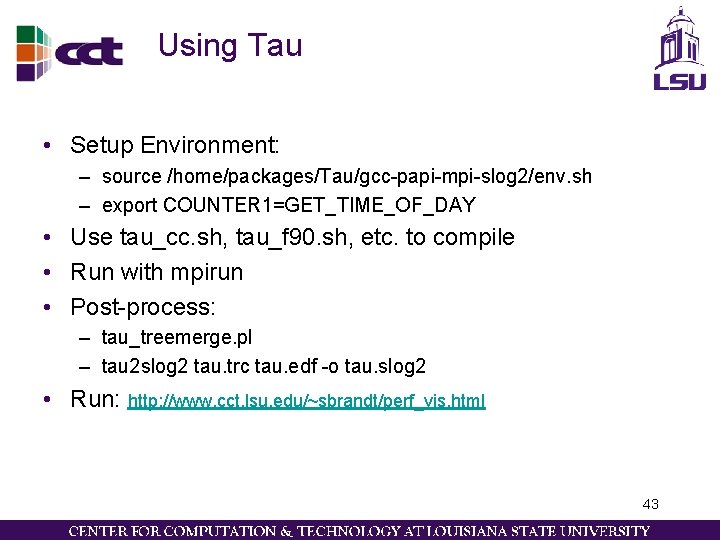
Using Tau • Setup Environment: – source /home/packages/Tau/gcc-papi-mpi-slog 2/env. sh – export COUNTER 1=GET_TIME_OF_DAY • Use tau_cc. sh, tau_f 90. sh, etc. to compile • Run with mpirun • Post-process: – tau_treemerge. pl – tau 2 slog 2 tau. trc tau. edf -o tau. slog 2 • Run: http: //www. cct. lsu. edu/~sbrandt/perf_vis. html 43

Demo • Tau and Jumpshot 44

Topics • • Introduction Performance Characteristics & Models Performance Models : Log. P Performance Models : Log. GP Benchmarks : b_eff MPI Tracing : PMPI TAU & MPI Summary – Materials for Test 45

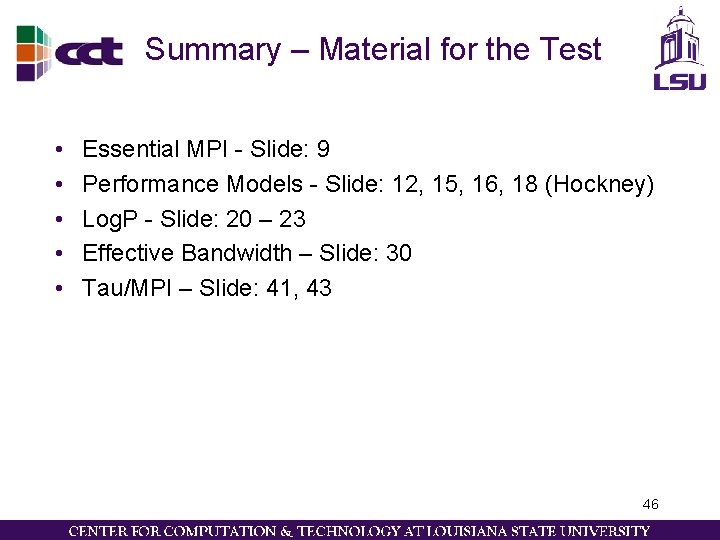
Summary – Material for the Test • • • Essential MPI - Slide: 9 Performance Models - Slide: 12, 15, 16, 18 (Hockney) Log. P - Slide: 20 – 23 Effective Bandwidth – Slide: 30 Tau/MPI – Slide: 41, 43 46

Sources • • http: //www. cs. uoregon. edu/research/tau/docs. php (tau) http: //www. llnl. gov/computing/tutorials/mpi_performance/ http: //www. netlib. org/utk/papers/mpi-book/node 182. html (mpi profiling interface) http: //www-unix. mcs. anl. gov/mpi/tutorial/perf/index. html (Gropp course) http: //www. ecs. umass. edu/ece/ssa/papers/jpdcmpi. ps (Log. P paper with figures) http: //www. netlib. org/utk/people/Jack. Dongarra/PAPERS/coll-perf-analysiscluster-2005. pdf (more Log. P stuff) http: //www. hlrs. de/organization/par/services/models/mpi/b_eff/ (b_eff bench) http: //icl. cs. utk. edu/hpcc/ (hpc challenge) 47

48